What Is a Service Dependency Map? Types, Benefits, and Tools for IT Teams
Last updated: July 27, 2026
When an application fails during a peak business window, the first question every operations team asks is: what else is connected to this? Without a current picture of how services depend on each other, the answer takes hours to reconstruct.
This is the gap that service dependency mapping tools close. A service dependency map gives you that picture before the question becomes urgent. It shows which configuration items (servers, databases, middleware, and cloud resources) support each named business service, and what breaks if any one of them fails. For IT teams adopting agentic workflows, it also defines the trust boundary within which any automated action should operate.
What are the best service dependency mapping tools?
Leading service dependency mapping tools for IT teams in 2026 include Virima (discovery-sourced business service maps with ITSM overlays across 7 platforms), ServiceNow Service Mapping (Now Platform-native), Dynatrace (APM and cloud-native topology), Device42 and Faddom (hybrid discovery maps), SolarWinds SAM and ManageEngine (monitoring-led dependency views), Datadog (DevOps service catalog), and BMC Helix Discovery (enterprise cloud-native discovery). Choose by ITSM platform fit, discovery method, and whether your priority is business-service blast radius or application topology.
What is a service dependency map?
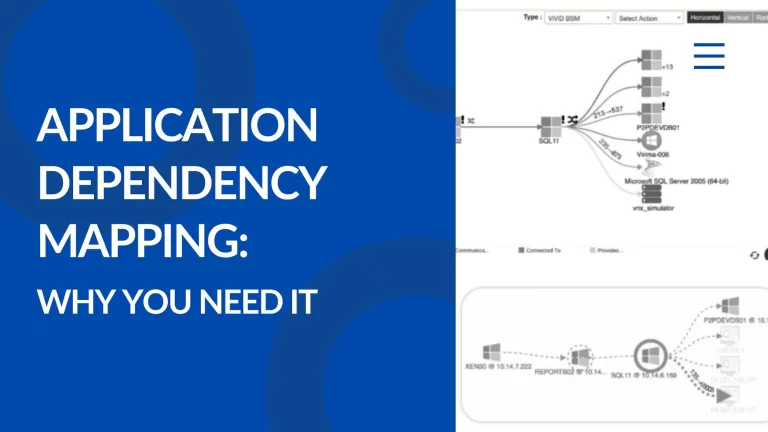
A service dependency map is a visual representation of how IT services, applications, infrastructure components, and their relationships connect within your environment. It goes beyond a simple inventory of assets: it shows the upstream and downstream connections between servers, databases, middleware, network devices, and cloud resources that together deliver a named business service.
A service dependency map shows every configuration item — servers, databases, middleware, network devices, and cloud resources — that collectively delivers a named business service. It answers the question every operations team asks during an outage: what is connected to this, and what breaks if it goes down? Without it, teams reconstruct dependency chains manually under pressure. With it, blast radius (the set of services affected when one component fails) is visible in seconds.
The difference from a plain asset inventory is context. Knowing you have 500 servers tells you what exists. A service dependency map tells you which twelve of those servers support your payment processing service, and what happens to that service if the shared database tier goes down.
For IT teams working to understand infrastructure in context, a service dependency map provides the operational picture that static asset lists and spreadsheet-based CMDBs cannot. It turns raw infrastructure data into a structured view of how services actually run, so decisions about changes, incidents, and risk are grounded in evidence rather than assumptions.
Service dependency maps and agentic IT
AI agents acting on IT infrastructure (remediating incidents, executing changes, provisioning resources) require a live, accurate picture of what exists and how it connects before taking any action. A stale or incomplete service dependency map means agents act on wrong assumptions, creating cascading failures. Service dependency mapping is the prerequisite layer that makes agentic IT safe: it defines what the agent knows before it decides.
AI agents need service dependency maps before taking any action on IT infrastructure. Without a current dependency picture, an automated remediation step can resolve one alert while triggering three more downstream. The service dependency map defines the blast radius and trust boundary for every agentic decision, making it the governance layer beneath any autonomous IT operation.
This dependency context matters across three agentic scenarios:
Incident auto-remediation
An AI agent identifying a root cause needs to know the dependency chain (which downstream services a proposed fix will affect) before applying it. A dependency map built from discovery data collected this week supports safe automated action. A map last updated six months ago does not.
Change execution
Before an agent approves or executes a change, it needs current blast radius data. Which services depend on the CI being modified? Who owns those services? Are any in an active freeze window? A service dependency map answers all three questions simultaneously.
Compliance attestation
When an agentic workflow triggers a change record or incident ticket, the service dependency map provides the evidence trail: what connected to what, what changed, and how far the impact reached.
→ Discover how Virima delivers Trusted Runtime Truth for Agentic IT
Understanding service dependency mapping tools
Service dependency mapping tools (also called IT service mapping tools or service dependency mapping software) automate the discovery and visualization of IT asset relationships. They identify how apps, services, hosts, and data centers connect and depend on each other. The result is better visibility for ITSM processes, faster incident resolution, and lower change risk.
Organizations can build these maps manually, through spreadsheets, interviews, and network traces, but manual approaches are slow, error-prone, and stale within weeks of completion. Automated tools use scheduled discovery cycles to build and maintain maps, then expose them through visual interfaces that support operational decisions.
| Aspect | Manual mapping | Automated mapping |
| Time to map | Hours to days | Minutes to hours |
| Accuracy | Prone to human error and omissions | High accuracy from discovery-sourced data |
| Update frequency | Infrequent, often outdated | Updated on scheduled discovery cycles |
| Incident response | Slower without dependency context | Faster root cause identification |
| Scalability | Difficult at scale | Scales across on-prem, cloud, and hybrid |
| Agentic readiness | Not safe for AI agent decisions | Trust-grade input for autonomous IT ops |
For teams focused on pure application-to-infrastructure topology (migration planning, APM-adjacent visibility, or code deployment blast radius), see Top application dependency mapping tools. A companion guide covering the ADM tool set in depth.
Types of service dependency maps
Not all service dependency maps answer the same operational question. The type you need depends on the problem you are trying to solve.
What are the main types of service dependency maps?
The five main types are: business service maps (all CIs supporting a named service), application dependency maps (app-to-app and app-to-infrastructure connections), communication flow maps (host-to-host with port and protocol detail), cloud relationship maps (AWS and Azure alongside on-premises), and network device dependency maps (switch, router, and firewall topology). Each answers a different operational question.
Business service maps
A business service map groups all the CIs (servers, databases, applications, load balancers, network paths) that collectively deliver a named business service such as “Customer Portal” or “Payroll Processing.” This is the most commonly used view because it connects infrastructure to business outcomes. When leadership asks what is at risk if a specific server fails, the business service map provides the answer.
In Virima, ViVID™ service maps render these as interactive maps built from discovery-sourced data and machine-learned relationships. ITSM records (open incidents, pending changes, active vulnerabilities) overlay directly on the map so the operational state of each CI is visible at a glance.
Application dependency maps
An application dependency map shows how software applications communicate with each other and with the infrastructure they rely on: which APIs connect to which databases, which front-ends pull from which services. This view is essential for migration planning, performance troubleshooting, and understanding blast radius during code deployments.
Communication flow maps
Communication flow maps show server-to-server and host-to-host connections at the network level, including port numbers and protocol details. These maps are useful for identifying undocumented connections, validating firewall rules, and spotting machines that communicate on your network but are not yet recorded in your CMDB.
Cloud relationship maps
Cloud relationship maps visualize how cloud resources across AWS and Azure connect to each other and to your on-premises infrastructure. As organizations move to hybrid and multi-cloud architectures, these maps become critical for understanding cross-environment dependencies that traditional network monitoring service mapping tools miss.
Network device dependency maps
Network device dependency maps chart the connections between switches, routers, firewalls, and other network infrastructure. They help network teams understand topology, identify single points of failure, and plan capacity changes with full visibility into what sits downstream of each device.
Key capabilities to evaluate in service dependency mapping tools
When evaluating service mapping tools, these eight capabilities separate a working solution from one that becomes shelfware.
What should I look for in a service dependency mapping tool?
Eight capabilities separate working service dependency mapping tools from shelfware: scheduled discovery scans, discovery-sourced relationship data (not traffic inference only), visual mapping with live ITSM overlays, bidirectional ITSM and CMDB integration, scalability across hybrid environments, security and compliance support (audit trails, CI ownership), configurable alerting and reporting, and historical data for change tracking and post-incident review.
- Scheduled discovery scans: The tool should find and map your environment automatically, using scheduled discovery cycles to keep data current. Look for flexible scan scheduling (daily, weekly, or triggered by change events) rather than manual refresh only.
- Discovery-sourced relationship data: Direct device interrogation produces far more accurate maps than inferring relationships from network traffic alone. Virima IT Discovery uses agentless (WMI, SSH, SNMP), agent-based (Windows, macOS, Linux), and API-based (AWS, Azure) scanning to populate CI relationships from the source.
- Visual mapping with operational overlays: Strong implementations overlay live ITSM records (incidents, changes, problems) directly on the dependency map. This is the core function of Virima ViVID™.
- ITSM and CMDB service mapping integration: The tool should connect bidirectionally with your CMDB software and ITSM platform. Virima integrates with ServiceNow, Jira Service Management, Ivanti, Xurrent, HaloITSM, Hornbill, and TeamDynamix — bidirectionally, so changes in either system update the other.
- Scalability: The tool should handle growth in services, CIs, and users without architectural limits. This matters particularly in hybrid environments where cloud resource counts shift weekly.
- Security and compliance support: Access controls, audit trails, and CI ownership tracking all support compliance reporting. When an auditor asks which assets support a regulated service, the answer should come from the tool, not a spreadsheet.
- Configurable alerting and reporting: Alerts for significant changes to mapped services help teams act before an issue escalates. Custom reporting supports both operational review and executive-level service health briefings.
- Historical data and change tracking: Comparing the current state of a service map against its state 30 days ago helps identify drift, support post-incident reviews, and satisfy audit requirements.
Why ITSM teams use service dependency mapping tools
Faster incident response
Service dependency maps reduce MTTR (mean time to resolution) by collapsing the context-gathering phase of incident response. Atlassian’s incident management research identifies diagnostics, “are you able to figure out what the problem is quickly?,” as one of the primary variables separating fast recoveries from slow ones…
Better change management
Before approving a change, teams need to know its blast radius — what else breaks if this goes wrong. Service dependency maps make that analysis immediate rather than requiring manual tracing through CMDB records. Teams using Virima run impact analysis against ViVID™ maps before every change window, reducing unplanned outages caused by changes with unexpected downstream effects.
Improved resource visibility
Service dependency mapping reveals the true cost and complexity of supporting each service. Teams can identify underutilized infrastructure, duplicate resources, and components that carry unacknowledged risk, all mapped to the services they support.
Proactive risk management
With a current picture of how services connect, teams can spot single points of failure before they cause an outage. A database server that sits in the dependency chain of six production services is a risk that shows up immediately on a service map and stays invisible in a flat asset inventory.
Security and compliance alignment
Visualizing service relationships helps security teams identify what is exposed and what is protected. When a vulnerability surfaces, the service dependency map shows which services depend on the affected CI, making triage and prioritization faster. This supports IT asset management workflows and audit readiness across compliance frameworks including SOX, HIPAA, and ISO 27001.
Stronger team collaboration
When operations, change management, and security teams share one dependency map, they work from the same evidence. Everyone sees service ownership. Everyone agrees on impact scope. Change discussions become data-driven rather than tribal-knowledge-driven.
Virima publishes this guide and sells Virima Discovery and ViVID™ service mapping. Tools in this table are evaluated against the criteria below using publicly available product information as of July 2026.
Inclusion criteria. A tool appears here only if it meets at least four of the following six:
- Automated CI and/or relationship discovery (agentless, agent, API, or traffic-based)
- Visual service or dependency topology output
- Business-service or application-service grouping (not metrics-only dashboards)
- Hybrid or multi-cloud coverage path
- ITSM or CMDB integration for incident, change, or impact workflows
- Actively marketed for service or dependency mapping in 2025. 2026
Excluded: pure code-library dependency tools, BCM platforms without IT discovery, and spreadsheet-only approaches.
Editor’s note (July 2026): Tool set expanded from 5 to 10 entries to include consensus service and dependency mapping platforms actively marketed for ITSM use in 2026. Pure APM tools and code-library dependency tools are excluded per the criteria above.
Comparing service dependency mapping tools
| Tool | Best for | Discovery approach | Service map depth | ITSM / CMDB fit | Hybrid / cloud | Notable limitation |
|---|---|---|---|---|---|---|
| Virima | ITSM teams needing discovery-sourced business service maps across multiple platforms | Agentless (WMI, SSH, SNMP), agent-based, AWS and Azure APIs | Business service + application dependency + communication flow + cloud relationship + network device | ServiceNow, Jira Service Management, Ivanti, Xurrent, HaloITSM, Hornbill, TeamDynamix (bidirectional) | On-prem, AWS, Azure | Named service definitions set by the IT team. Not auto-inferred |
| ServiceNow Service Mapping | Enterprises fully standardized on Now Platform | Platform-native (ServiceNow Discovery engine) | Business service maps natively within ServiceNow CMDB | Native ServiceNow ITSM and CMDB | On-prem, AWS, Azure via Discovery | Map depth and cost depend on ITOM Discovery licensing; multi-ITSM estates still need an external discovery layer |
| Dynatrace | SRE and platform engineering teams managing cloud-native and microservices environments | APM observability telemetry (agent + Smartscape topology) | Application and service topology with real-time performance correlation | APM-first; integrations with ServiceNow, PagerDuty, and Jira | AWS, Azure, Kubernetes, on-prem | Weaker as a multi-ITSM configuration system of record vs. discovery-led CMDB platforms |
| Device42 | Migration planning and data-center rationalization in complex hybrid estates | Agentless (WMI, SSH, SNMP), NetFlow, cloud APIs | Application dependency flows + infrastructure topology + asset inventory | Integrates with ServiceNow, Jira; deep ITSM overlays require configuration | On-prem, AWS, Azure, virtual | Deep bidirectional ITSM operational overlays require additional configuration vs. ITSM-native mappers |
| Faddom | Mid-market teams that need fast, lightweight dependency maps without agent deployment | Agentless (passive traffic analysis, no credentials required) | Application-to-infrastructure topology; live dependency visualization | Connects with ServiceNow and Splunk; limited multi-ITSM depth | On-prem, AWS, Azure, hybrid | Less emphasis on multi-platform ITSM record overlays and CMDB governance than dedicated ITSM discovery suites |
| SolarWinds SAM | IT departments that need integrated dependency and performance management | Agent-based polling; WMI, SNMP, API monitoring | Application and server dependency maps with performance correlation | Integrates with ITSM tools; primarily performance-monitoring-led | On-prem, AWS, Azure (IaaS, PaaS, SaaS) | Service relationship depth weaker than dedicated ITSM-oriented service mapping platforms |
| ManageEngine Applications Manager | Teams already using ManageEngine ServiceDesk Plus | ADDM (Application Discovery and Dependency Mapping) feature; agent-optional | Application dependency maps within unified monitoring dashboard | Native ServiceDesk Plus integration; supports 150+ technologies | On-prem, cloud, hybrid, virtual | Visual mapping depth limited vs. specialized service mapping platforms |
| Datadog | Engineering and DevOps teams managing distributed cloud services | APM tracing telemetry; Software Catalog auto-discovery and manual definition | Service dependency maps via Service Map and Software Catalog | Integrates with PagerDuty, ServiceNow, Jira; engineering-workflow-first | AWS, Azure, Kubernetes, hybrid | Business-service grouping and ITSM record overlays weaker than discovery-led service mapping platforms |
| BMC Helix Discovery | Large enterprises needing broad cloud-native discovery with BMC Helix ITSM integration | Cloud-native; covers software, hardware, network, storage, and cloud services per scan | Application dependency maps built from any available CI information | Native BMC Helix ITSM; integrates with third-party platforms | On-prem, AWS, Azure, hybrid | Pricing and licensing complexity favor organizations already invested in the BMC Helix suite |
| Ivanti Neurons | Ivanti-native IT environments with strong automation and CMDB sync requirements | Agent-based and agentless; integrates with Ivanti ITSM natively | Service dependency mapping within Ivanti ITOM and ITSM workflows | Native Ivanti ITSM; bidirectional CMDB sync | On-prem, cloud, hybrid | Complex setup; highest value inside the full Ivanti suite |
→ Schedule a demo — see ViVID™ map your environment in under 60 minutes
Top service dependency mapping tools
The tools below meet the inclusion criteria above and are actively used by enterprise IT and ITSM teams for service dependency mapping as of 2026. Each entry covers what the tool is, its primary strength for ITSM use cases, and an honest limitation.
1. Virima
Virima is a discovery and CMDB platform with ViVID™ service dependency maps built from scheduled agentless, agent-based, and cloud API discovery (AWS and Azure). Best for ITSM teams that need business-service blast radius, CI ownership, and incident and change overlays across ServiceNow, Jira Service Management, Ivanti, Halo, Xurrent, Hornbill, and TeamDynamix. Limitation: named service definitions are set by the IT team, not auto-inferred.
2. ServiceNow Service Mapping
ServiceNow Service Mapping builds dependency maps inside the Now Platform and feeds the ServiceNow CMDB for native ITSM workflows. Best for enterprises fully standardized on ServiceNow that want change and incident context on maps without a separate tool. Limitation: map depth and cost depend on ITOM Discovery licensing; multi-ITSM estates still need an external discovery truth layer.
3. Dynatrace
Dynatrace maps services and dependencies through observability telemetry with strong cloud-native and microservices coverage. Best for SRE and platform engineering teams that prioritize real-time performance topology and automated root cause analysis. Limitation: weaker as a multi-ITSM configuration system of record compared with discovery-led CMDB platforms.
4. Device42
Device42 discovers physical, virtual, and cloud assets and builds application and infrastructure dependency views for complex hybrid estates. Best for migration planning, data-center rationalization, and asset-centric teams. Limitation: deep bidirectional operational overlays with multiple ITSM platforms require additional configuration compared with ITSM-native mappers.
5. Faddom
Faddom is an agentless dependency mapping tool that builds live application-to-infrastructure topology with minimal setup and no credential requirement. Best for mid-market and hybrid teams that need fast maps without configuration overhead. Limitation: less emphasis on multi-platform ITSM record overlays and CMDB governance than dedicated ITSM discovery suites.
6. SolarWinds Server & Application Monitor
SolarWinds SAM maps application dependencies and server relationships with built-in performance correlation and configurable alerting. Best for IT departments that need integrated dependency and performance management in one product. Limitation: service relationship depth is weaker than dedicated ITSM-oriented service mapping platforms.
7. ManageEngine Applications Manager
ManageEngine Applications Manager provides dependency mapping and performance insights across servers, applications, and databases within a unified monitoring dashboard. Best for teams already using ManageEngine ServiceDesk Plus who want performance and dependency context in one product. Limitation: visual mapping depth is limited compared with specialized service mapping platforms.
8. Datadog
Datadog maps service dependencies through its Software Catalog and APM tracing telemetry, tracking relationships between services automatically and supporting manual definition. Best for engineering and DevOps teams managing distributed cloud systems who need service dependency context alongside performance metrics. Limitation: business-service grouping and ITSM record overlays are weaker than discovery-led service mapping platforms.
9. BMC Helix Discovery
BMC Helix Discovery is a cloud-native discovery and dependency mapping solution with broad hardware, software, network, and cloud coverage per scan. Best for large enterprises that need deep asset-to-service dependency context with BMC Helix ITSM integration. Limitation: pricing and licensing complexity favor organizations already invested in the BMC Helix suite.
Steps to implement service dependency mapping
Step 1: Choose the right tool. Match the tool to your environment size, ITSM stack, and discovery depth requirements. A mid-market team running Jira Service Management has different integration needs than an enterprise team on ServiceNow. Virima supports both, and five other platforms, through bidirectional integrations.
Step 2: Run automated discovery. Enable scheduled discovery scans to build your initial CI inventory and relationship data. Most environments produce a usable first map within hours of the initial scan. Virima users reach their first service dependency map in under 60 minutes.
Step 3: Define your service boundaries. Service definitions — the grouping of CIs into named business services — require a manual input step. You decide which CIs belong to each service. In Virima, this can be done directly in the interface, via spreadsheet import, or through integrations such as LeanIX. Once defined, ViVID™ renders the dependency map automatically from discovery data.
Step 4: Integrate with your ITSM platform. Connect the mapping tool to your ITSM platform so incidents, changes, and problems surface on the service map. A map without ITSM context is a diagram. A map with live ITSM overlays is an operational dashboard.
Step 5: Set alerts and review cadence. Configure alerts for significant changes to mapped services. Schedule a periodic map review — monthly for stable environments, weekly for fast-changing ones — to verify accuracy.
Step 6: Train your team. Walk operations, change management, and incident response teams through the map interface. The goal: during an incident, the map is the first place responders open, not the last.
How Virima ViVID™ raises the ceiling for service dependency mapping
Virima ViVID™ renders service dependency maps from discovery-sourced CI data, then overlays open incidents, pending changes, active vulnerabilities, and ownership information directly on those maps. Unlike service mapping tools that produce static topology diagrams, ViVID™ shows the operational state of every CI in its service context, so teams see both the structure and the current health of each service simultaneously.
ViVID™ supports five map types: business service maps, application dependency maps, communication flow maps (host-to-host with port and protocol detail), cloud relationship maps (AWS and Azure alongside on-premises), and network device dependency maps. All five draw from the same discovery-driven CMDB data, requiring no separate configuration or data pipeline.
For change management specifically, ViVID™ integrates with ServiceNow, Jira Service Management, Ivanti, Xurrent, HaloITSM, Hornbill, and TeamDynamix to surface pending changes on the map before they execute. A change approver can see exactly which services sit downstream of the CI being modified, with current incident status visible, before authorizing the work.
One customer team reported cutting outage investigation time significantly. From roughly four hours to under 35 minutes in one documented incident. Because a failed database server had impacted several upstream services before anyone identified the root cause.
→ Schedule a demo — see ViVID™ map your environment in under 60 minutes
Frequently asked questions
What is the difference between a service dependency map and an application dependency map?
An application dependency map focuses on how software applications communicate with each other and with their supporting infrastructure: which APIs call which databases, which front-ends depend on which microservices. A service dependency map takes a broader view: it groups those application dependencies, hardware, network infrastructure, and cloud resources into named business services and shows how those services relate to each other. Application dependency data feeds into service dependency maps, but the service-level view connects infrastructure directly to business outcomes.
How does a service dependency map reduce mean time to resolution?
When an incident fires, responders using a service dependency map see the full dependency chain and all active incidents on a single view. Instead of querying multiple systems to reconstruct what connects to what, they identify the probable root-cause CI and the blast radius within seconds. This compression of the context-gathering phase is the primary mechanism through which service dependency maps reduce MTTR.
Can Virima ViVID™ deliver service mapping depth without ServiceNow Discovery?
Yes. ViVID™ is source-agnostic: it builds service dependency maps from Virima Discovery, SCCM, Intune, AWS, Azure, or any connected data source, and overlays live ITSM records from seven platforms on a single map. For organizations running non-ServiceNow ITSM, or those seeking equivalent service map depth at lower total cost, Virima delivers the same operational context without requiring separate Discovery licensing. (For teams already on ServiceNow, see the Virima ServiceNow integration, which enriches the ServiceNow CMDB rather than competing with it.)
Are service definitions in ViVID™ created automatically?
No. Virima Discovery automatically detects CIs and their relationships using agentless and agent-based scanning, and machine learning learns connection patterns. Your IT team sets service definitions. The step where you group CIs into named business services. Manually, imports them via spreadsheet, or populates them through integrations such as LeanIX. ViVID™ then renders the service dependency map automatically from those definitions and the discovery-sourced relationship data.
What ITSM platforms does Virima integrate with for service dependency mapping?
Virima integrates bidirectionally with ServiceNow, Jira Service Management, Ivanti, Xurrent, HaloITSM, Hornbill, and TeamDynamix. Through these integrations, ViVID™ overlays active incident records, pending changes, and vulnerability data directly onto your service dependency maps, so operational context is always visible alongside the dependency structure.
Do I need service dependency mapping if I already have APM?
APM tools (Dynatrace, Datadog, AppDynamics) map how services perform and communicate in real time. They answer “is this service slow and why?” Service dependency mapping answers a different question: “which business services depend on this CI, and what breaks if it fails?” The two are complementary. APM gives you performance telemetry; service dependency mapping gives you business-impact context for incident triage, change approval, and compliance. Teams running APM alone still reconstruct business service impact manually during major incidents.