A comprehensive guide to application dependency mapping

When hybrid stacks mix cloud services, microservices, and older apps, one change can stop work far from the ticket. Operators need a clear answer before they upgrade, move, or retire anything.
Application dependency mapping (ADM) finds and visualizes how applications depend on other apps, services, servers, databases, APIs, and external systems. The map is the working picture of upstream and downstream links so you can ask, before impact: which business paths break if this host, library, or API fails?
With that picture, change planning gets safer, outages get shorter root-cause paths, and migration waves follow real dependency depth instead of host lists alone.
At its foundation, ADM relies on automatic mapping technology that scans, discovers, and refreshes relationship views on a scheduled cadence, feeding dependency data into ITSM workflows.
According to a 2024 study, the median annual downtime from high-impact IT outages is 77 hours, with engineering teams spending about 30% of their time on disruptions.
With a maintained map, you make better change decisions, reduce surprise blast radius, and fix problems faster because you know what connects where.
What is Application Dependency Mapping (ADM)?
Application dependency mapping software, or ADM, is about finding and showing how apps connect. It identifies all dependencies between applications, servers, and databases, and creates a visual representation of these links to reveal how your IT ecosystem truly operates.
In practice, this map can be a diagram or an interactive graph. It shows which apps rely on which services. For example, ServiceNow calls ADM “an accurate map of an IT ecosystem.” That means it includes apps, services, infrastructure, and all their links.
What is application dependency mapping?
Application dependency mapping (ADM) identifies and visualizes how applications rely on other applications, services, servers, databases, APIs, and external systems. The map shows upstream and downstream relationships so teams can predict blast radius for changes, outages, migrations, and security events instead of discovering them after impact.
With ADM, you can answer smart questions. For instance, “If I shut down this server, which business services will break?” Or, “If one app fails, what other systems will stop?”
These answers help you avoid surprises when apps, services, and infrastructure share hidden paths.
It also helps you understand the relationships between applications, particularly in cloud-based environments where infrastructure changes frequently.
How ADM differs from service mapping, APM topology, and code dependencies
Teams often mix four different pictures. Mixing them creates false confidence in change and migration plans.
| Concept | Primary question | Typical outputs | Common owner |
|---|---|---|---|
| Application dependency mapping | What does this app need to run, and what needs it? | App-to-app and app-to-infra links, data paths, shared platforms | Infra / IT Ops / CMDB |
| Service mapping | Which CIs make up this business or technical service? | Service-bounded maps for impact, ownership, and ITSM | ITSM / service owners |
| APM / app topology | Where is latency or error in the runtime call graph? | Traces, service graphs, bottleneck views | SRE / app owners |
| Code or library dependency mapping | Which packages and modules does this build use? | SBOM-style graphs, version risk | Engineering / AppSec |
ADM answers stack truth. Service mapping answers service-level impact once service definitions exist. APM explains runtime behavior. Code dependency maps cover build-time libraries. Many programs need ADM plus service maps. APM and SBOM tools do not replace either.
What is the difference between application dependency mapping and service mapping?
Application dependency mapping shows how apps and infrastructure components depend on each other. Service mapping groups those components under defined business or technical services for impact, ownership, and ITSM workflows. ADM is stack truth. Service maps are service-bounded truth used in change and incident decisions.
For a deeper split of when each approach is enough, see application dependency mapping vs service mapping.
When dependency truth has to hold up under change freezes and agentic automation, start with how Virima frames Trusted Runtime Truth for live, explainable operational context.
Why map dependencies? Key benefits
A well-maintained dependency map delivers multiple strategic benefits:
Improved visibility & faster troubleshooting
A dependency map works like a live blueprint of your IT systems. It shows how every part connects, including all applications running across environments. When an outage happens, the map speeds up problem-solving. You can trace the issue step by step. For example, a failed app may point back to a broken database. Without the map, this can take much longer to find.
Combining dependency maps with Network and Application Monitoring ensures that performance anomalies and connectivity issues are detected in the context of the relationships the map reveals, turning raw alerts into actionable insights.
A dependency map also plays a huge role in incident response, helping IT teams quickly locate affected nodes or services by tracing data paths down to the IP address level.
| Here’s a real story. An admin once shut down a server that looked unused. But that server secretly supported the HR app. When it went down, the whole HR system crashed. A dependency map would have shown this hidden link and saved the day. |
Reduced risk and downtime
A dependency map shows you every important connection before trouble starts. This way, you can spot risks early. For example, a flaw in one app’s SSL can create security holes in others.
With this insight, your team can respond faster and stronger. You can plan fixes, set priorities, and recover more quickly.
Organizations leveraging advanced ADM and ADM tools are better equipped to anticipate outages and evaluate the potential impact of every single change.
| The average cost of an unplanned IT outage reached US $14,056 per minute in 2024—up nearly 10 % from 2022. ADM helps you invest smarter. You spend on the hardware, licenses, and staff time that matter most. We avoid wasting resources on tools or services that add no value. |
Optimized resource allocation
A clear dependency map helps you use money and resources wisely. It shows where your systems connect and depend on each other. As a result, teams can identify extra parts they don’t really need.
| ADM helps you invest smarter. You spend on the hardware, licenses, and staff time that matter most. We avoid wasting resources on tools or services that add no value. |
Smarter change and capacity planning
With a dependency map, every change becomes safer. Whether it’s a software update or a cloud move, you know what’s at risk. Atlassian compares a full map to a GPS for your IT world. It guides you to make changes in a timely and accurate way.
Instead of guessing, you can see exactly which services depend on what. For example, if many apps rely on one database, you plan updates without breaking them. This planning saves headaches and prevents downtime.
Along with this, mapping is the process that helps visualize the entire network topology, so teams can better understand traffic patterns, dependencies, and data flows within the application stack.
Application dependency mapping for cloud migration
Lift-and-shift plans fail when move groups ignore shared data stores, identity systems, and edge services. ADM sequences waves by dependency depth: map the candidate app, list upstream and downstream links, mark shared platforms that cannot move alone, then freeze a validated wave list before cutover.
Use the map in change advisory packs so hosts that look unused but still sit on an HR or payments path stay in scope. Re-scan after each wave. Cloud tags and new private endpoints change the graph even when the business service name stays the same.
Migration teams that treat the dependency map as a living checklist cut failed cutovers that come from hidden shared databases, forgotten middleware, and third-party APIs that only show up when traffic moves.
Enhanced security and compliance
Dependency mapping also makes security stronger. It shows you which systems use outside tools, like APIs or cloud services, and how sensitive data moves through them. With this view, you can spot weak points before attackers find them.
Critical considerations before you start
Implementing ADM requires upfront planning. Consider these factors:
Scope of the map
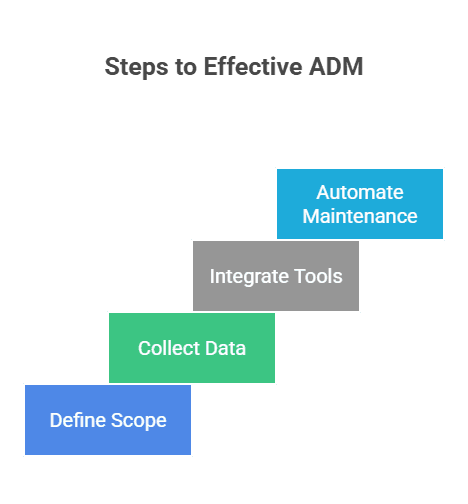
First, decide how big your map should be. You might start with one department, a key app, or your whole company. However, a smaller scope, such as your ERP system, provides quick wins and faster results.
On the other hand, a full-scale map shows every link across your hybrid cloud data center. This gives the most complete picture but takes more time.
No matter which you choose, set clear boundaries. Your team needs to know exactly what to include and what to leave out.
Data collection methods
You can collect dependency data in two main ways: manually or automatically. Manual work, like code reviews or interviews, can help with small apps. But it takes a lot of time and effort.
Automated tools make the job much faster. Network scans, flow analysis, or CMDB audits can find links quickly. For example, a simple “sweep and poll” pings devices to build an inventory. More advanced tools, like packet capture or NetFlow, reveal how systems talk in real time.
The best plan is often a mix. By combining manual and automated methods, you get both accuracy and speed.
Mapping tools and integration
When picking a mapping application, check its main features. Look for data visualization, auto-discovery, and integration options. The right tool should also grow with your environment. These criteria also define leadership in the application dependency mapping tool market, where flexibility, scalability, and ecosystem integration determine long-term value.
It’s important that it connects with your ITSM or CMDB systems. For example, if you use ServiceNow or Jira Service Management, choose a tool that links directly. This way, discovered services map to configuration items automatically.
With this setup, incidents in your ITSM can connect back to the dependency map. That makes problem-solving faster and more reliable.
Maintenance and automation
A map only helps if it stays up to date. You need a process to refresh it whenever your systems change. Manual updates often fall behind and give an incomplete picture.
By automating, you save your team from boring upkeep. Your map always shows the real state of your IT world. By evaluating scope, data methods, tooling, and upkeep, you prepare to build an effective dependency map. It will truly reflect your dynamic IT landscape.
How often should application dependency maps be updated?
Update maps on a defined discovery or agent refresh cycle, then validate after major releases, cloud waves, and serious incidents. Automation keeps the baseline current. Human review still confirms service meaning, ownership, and exceptions the scanners cannot infer.
How to create an application dependency map: Step-by-step
Once ready, follow these steps to build a useful ADM map:
Step 1: Define the project scope
Start by deciding what you want to map. Is it one application, one department, or the whole network? A small scope helps you move fast, while a larger scope gives a full picture.
Next, write a clear goal statement. For example: “Map all services in the e-commerce platform.” This keeps everyone aligned and focused on the same outcome.
Step 2: Inventory all networking components
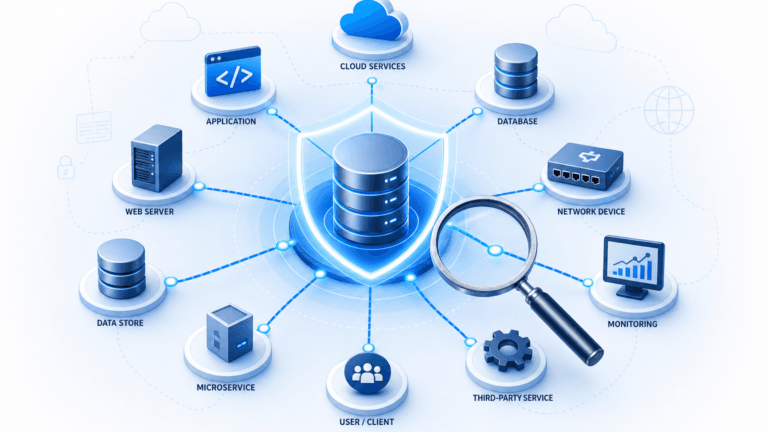
Make a full list of everything in your chosen scope. This includes apps, microservices, databases, servers, VMs, containers, and external services.
Don’t forget the hidden pieces like middleware, API gateways, or third-party SaaS tools. Often, these carry key connections.
A complete inventory is the base of any accurate dependency map. Without it, important links may stay hidden.
Step 3: Gather dependency data
There are several ways to collect dependency data. Each has strengths and trade-offs. You can mix them for the best results.
| Manual Analysis: Review code or documents to spot library and API calls. This is very accurate but slow. It works best for small systems or audits. (Spreadsheets are possible, but they’re time-consuming and easy to mess up.) Automated Discovery: Use network tools or orchestrators. They can sweep IP ranges, check traffic logs, or read orchestration data. As a result, you can see which apps communicate with which servers with less effort. Agent-Based Monitoring: Place lightweight agents on hosts. They log real-time connections at the process level. As a result, agents can distinguish apps on the same server and update maps as things change. However, the trade-off is deploying and managing them everywhere. |
Step 4: Select a mapping tool
Next, pick a tool that can take your collected data and turn it into a clear visual representation of your system. Many platforms provide drag-and-drop dashboards or auto-generated graphs. It becomes simple to see how everything connects.
Atlassian suggests using diagrams or visual charts for this step. Pictures are easier to understand than long lists. A good tool will let you link services directly to their servers, databases, and network gear.
With the right platform, you get a map that’s not only accurate but also easy to use.
Step 5: Build the map
Start with a simple, high-level diagram of your system. Then, add more detail step by step. Each application becomes a node on the map. Draw arrows to show data flows or service calls between nodes.
Don’t forget to include network paths, shared data storage, and API links. As you go, add key details like owners, SLAs, or performance notes next to each node.
In the end, you’ll have a rich map that acts like a single pane of glass for your entire environment.
Step 6: Validate and maintain
A map only helps if it stays correct. That’s why you should test it often. Atlassian suggests checking your dependencies against real events. For example, if you reboot a server, make sure the map shows all the services that went down.
Plan regular re-scans or sync agents to catch new deployments. Treat the map as a living document that updates whenever apps or systems change.
Whenever possible, use automation. This way, the map stays current without your team spending hours redrawing it by hand.
By following these steps, your team can build a strong dependency map. As you keep refining it, the map becomes even more valuable. Over time, it grows into a trusted guide — the single source of truth for how your IT systems connect and work together.
Common mapping approaches
Different methods of dependency mapping suit different environments:
1. Top-down vs. bottom-up
There are two main ways to start mapping project. The top-down method begins with one critical service and traces its connections. This approach is very precise and works well for mission-critical apps.
The bottom-up method scans the entire infrastructure first. It quickly finds all endpoints and then groups them into logical services. This gives you a broad view of the network.
In practice, many teams use both methods together. This way, you get the precision of top-down and the full coverage of bottom-up.
2. Network discovery (“sweep and poll”)
This is a low-touch way to find network devices on your network. It pings each device and pulls system details. The result is a quick inventory of all hosts.
However, this method has limits. It can miss short-lived or encrypted traffic. ServiceNow also points out that sweeps may struggle in fast-changing cloud setups. In very large data centers, they can also take a lot of time.
3. Flow analysis
Flow analysis looks directly at live network traffic. Methods like packet capture or NetFlow show how apps and servers communicate in real time. This makes it easy to see actual patterns instead of guesses.
The drawback is scale. These tools can generate huge amounts of data. You need enough storage and good filters to cut through the noise.
4. Agent-based monitoring
With this method, you install small software application agents on each machine. These agents capture detailed data, such as process-to-process calls. They can even spot interactions between apps running on the same host.
Agents also adapt as applications change, so your map stays accurate. The trade-off is the extra work. You need to deploy, manage, and update agents across all systems, which can feel heavy for large environments.
There’s no single best way to build a dependency map. Small and stable environments may do fine with manual diagrams or simple scans. But larger or hybrid environments gain more value from automated, agent-driven discovery.
Many teams begin with what they already have, such as CMDB software records. Then, they refine the map over time using dynamic tools for more accuracy and depth.
Method comparison at a glance
| Method | What it sees | Strengths | Blind spots | Best fit |
|---|---|---|---|---|
| Top-down from a critical service | Service to supporting components | Precise for mission-critical paths | Slow to cover the full estate | Priority apps, high-risk changes |
| Bottom-up inventory | Hosts and endpoints, then grouping | Broad coverage fast | Weak service meaning without definitions | Greenfield discovery |
| Sweep and poll | Reachable devices and coarse roles | Light, single vantage | Misses short-lived cloud churn and some encrypted paths | Stable LAN and data center baselines |
| Flow or packet analysis | Who talked to whom | Observed communication | Noise, scale, weak process identity on shared IPs | Hybrid and unknown estates |
| Agent-based | Process-level connections | Separates apps on one host | Deploy and maintain agents everywhere | Deep app estates, multi-tenant hosts |
| Orchestration-sourced | Declared deploy topology | Matches platform truth | Blind outside the orchestrator | Container platforms |
Choosing the right application dependency mapping method and tools
The right way to build your dependency map depends on a few key factors:
- Complexity of your environment: Big, complex systems benefit from automated tools. Teams can manage smaller setups manually.
- Level of detail needed: If you need deep insights, you may need to perform manual code reviews. For a broad overview, automated tools usually work well.
- Budget and resources: Automated tools cost more but save time and effort. Manual analysis is cheaper but takes longer.
Some organizations also explore open-source ADM options. Score them on protocol coverage, CMDB export quality, support load, and whether your team can own ongoing maintenance.
By weighing these factors, you can pick the method and tools that fit your needs best.
Application dependency mapping tools
Mapping is a cornerstone for handling the complexity of IT systems. To get the most value, you need the right tools.
Start with selection criteria: discovery depth, CMDB join, refresh model, and ITSM fit. Then compare options. One discovery-sourced approach is Virima Service Mapping with ViVID™ overlays.
Virima service mapping with ViVID overlays
Virima Service Mapping is one of the top tools for application dependency mapping. It uses a special feature called Virima Visual Impact Display (ViVID™).
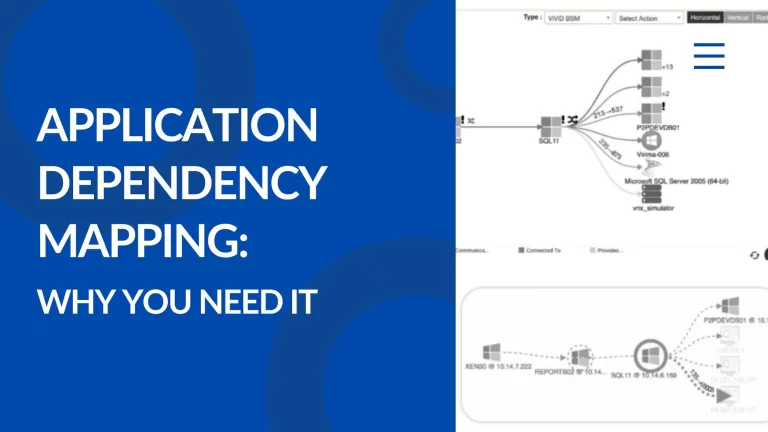
ViVID™ overlays add live data to your maps, such as app health, performance, ownership, and ITSM details. This extra layer makes the map much richer and easier to understand.
With this clear view, you gain a full picture of your IT world. It helps your team make smarter and faster decisions before problems grow.
- Automated Discovery: Virima scans your network to find apps, servers, databases, and outside services.
- Dependency Mapping: It then maps how these parts connect, showing clear data flows and interactions.
- ViVID™ overlays: After service definitions are provided, maps can show health, performance, ownership, and ITSM context on the dependency view so operators read impact in one place.
- Scalability: Virima can handle complex systems and expand as your IT environment grows.
- Integration: It works with ITSM platforms such as ServiceNow, Jira Service Management, Ivanti, HaloITSM, Xurrent, and Hornbill. See the full list on the Virima integrations page.
Additional application dependency mapping tools
Adjacent categories often appear in the same shortlist. Treat them carefully so you do not confuse runtime graphs with CMDB-grade dependency programs.
- SolarWinds-style monitoring suites may include dependency views next to network and application monitoring.
- Dynatrace and AppDynamics focus on APM topology and business transactions. Use those graphs as runtime evidence, not as a full replacement for discovery-sourced ADM joined to configuration data.
- Microsoft SCOM provides operations management with lighter dependency features and fits teams already deep in the Microsoft stack.
When you shortlist tools, score discovery depth, refresh model, CMDB and ITSM join, and how clearly the product separates APM topology from application dependency mapping.
Best practices for reliable mapping
To get the most out of your dependency map, follow these expert tips:
Automate what you can
Manual maps lag the first autoscaling event or SaaS cutover. Automate discovery or agent refresh on a defined cadence so the diagram is not last quarter’s truth during this week’s change. This way, your map stays accurate and you avoid heavy manual redraw work.
This way, your map always stays accurate. You save time and avoid the heavy effort of manual updates.
Document and share
Don’t keep the map hidden. Publish it in a shared dashboard or wiki so everyone can see it. You can also share an executive summary for quick reference.
Be sure to document critical findings. For example: “Database X is shared by Apps A, B, and C.”
This way, both technical teams and executives understand the system landscape and can make better decisions together.
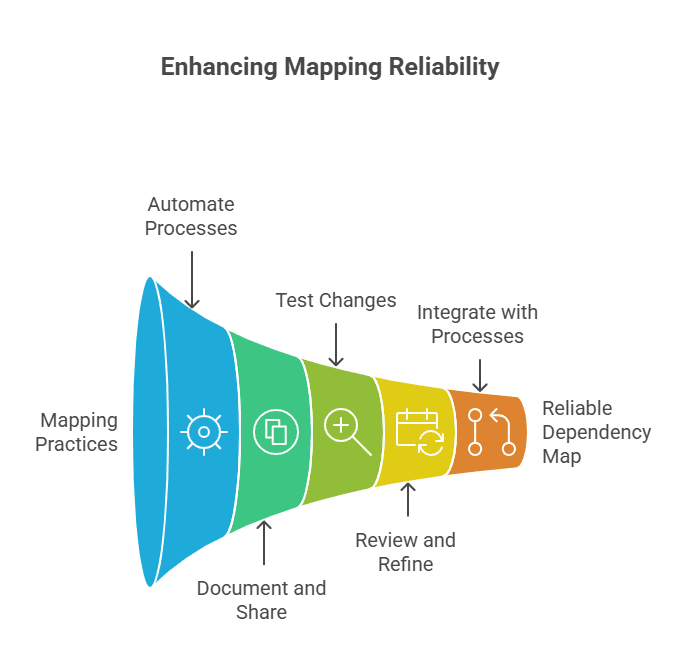
Test changes
A map that never fails a rehearsal is untrusted. After a QA refresh or controlled reboot, confirm every service that actually dropped still appears on the impacted path. Test dependencies so the map matches reality before changes go live.
Atlassian recommends regularly testing your dependencies to be sure the map matches reality. For example, if you refresh a QA environment, confirm that all inter-app calls still appear correctly on the map.
By testing often, you keep the map reliable and avoid surprises when changes go live.
Review and refine
Dependency mapping is not a one-time project. To stay useful, the map needs regular reviews.
Set up periodic checkpoints to keep it fresh. Consult team members or review system logs to identify any missed services. Then update the map right away.
Atlassian recommends revisiting workflows and gathering stakeholder input often. This ensures your map always matches reality and supports smart decisions.
Integrate with processes
Your map is most powerful when it’s part of everyday work. Tie it directly into change management. For example, require every change request to reference the dependency map. This helps reviewers see the downstream impacts before approving.
You can also use snapshots of the map when planning major projects, like cloud migrations or data center moves. This approach ensures you miss nothing and makes major changes with minimal risk.
By institutionalizing these practices, your application dependency map becomes a living document. It continually reduces risk and improves operations.
Discover the difference a dynamic map can make
With this insight, you can manage risk, fix problems faster, and plan smarter. A well-maintained dependency map is vital when migrating workloads, modernizing apps, or managing hybrid cloud environments.
If you’re ready to begin, start by picking a solid tool and defining your first scope. Many teams find success with solutions like Virima Service Mapping, which can discover dependencies on a scheduled cadence and build maps after service definitions are provided.
Virima goes further by adding operational context to your maps. It can overlay performance metrics and ownership details on mapped components after service definitions are in place. This gives you a dynamic service map that stays accurate and easy to use.
For live dependency views tied to ITSM work, see ViVID™ service mapping.
When you want to see discovery-sourced maps with ViVID™ overlays on your own estate, request a Virima demo.
Frequently asked questions (FAQ)
How often should dependency maps be updated?
Refresh on a scheduled discovery or agent cycle, and re-validate after major releases, cloud migration waves, and high-severity incidents. Automation keeps inventory relationships current. Owners still confirm service meaning and exceptions scanners miss.
Can application dependency mapping help with cloud migration?
Yes. ADM shows shared databases, identity systems, and edge services that block simple lift-and-shift waves. Teams sequence move groups by dependency depth, keep shared platforms in the right wave, and re-map after cutover when new cloud endpoints appear.
What is the difference between ADM and service mapping?
ADM maps application and infrastructure dependencies across the stack. Service mapping binds components to defined business or technical services for impact and ownership in ITSM. Many IT organizations run both: ADM for technical truth, service maps for service-level decisions.
Should we use agents or agentless discovery for ADM?
Agentless flow or sweep methods start faster and avoid host installs. Agents add process-level detail and separate multiple apps on one server. Large hybrid estates often combine both: broad agentless coverage plus agents on critical app tiers.
How does Virima approach application dependency mapping?
Virima discovers assets and relationships on a scheduled cadence, stores them for CMDB and ITSM use, and builds service dependency maps with ViVID™ overlays after service definitions are provided. Teams use those maps for blast radius, ownership, and change context rather than static drawings alone.