ViVID™ Service Mapping: Live Dependency Maps for Agentic IT
Service mapping is the layer that separates reactive IT teams from proactive ones. Most organizations approve changes and respond to incidents without a clear picture of service dependencies. Those relationships often surface only after something breaks.
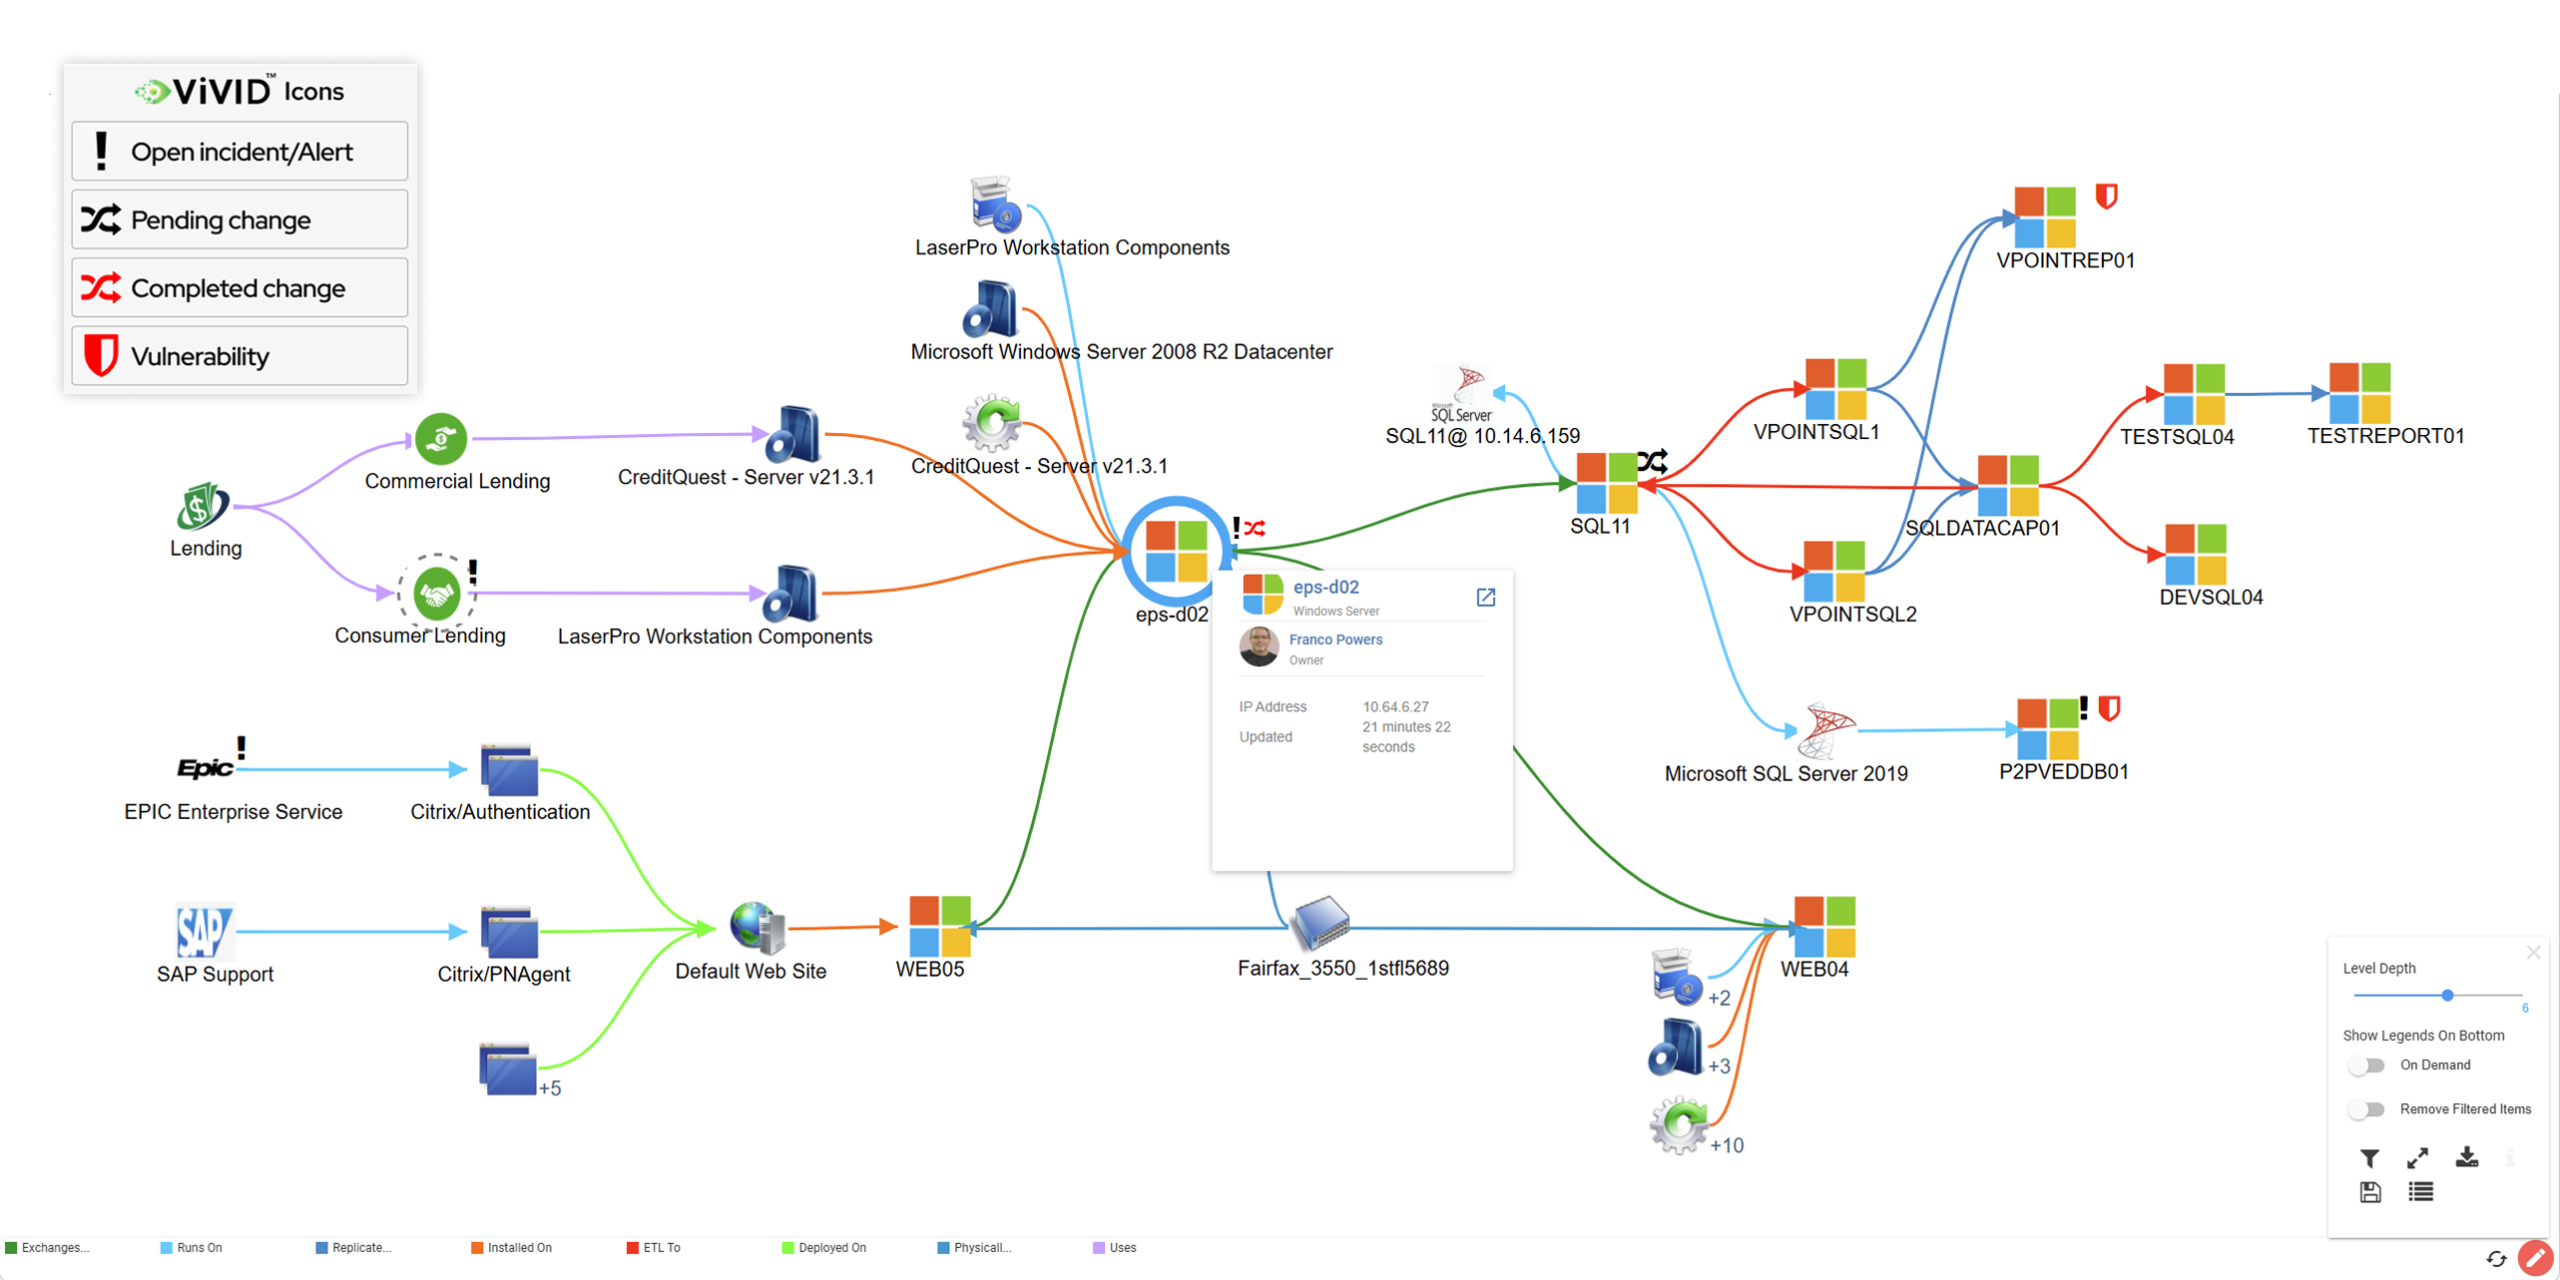
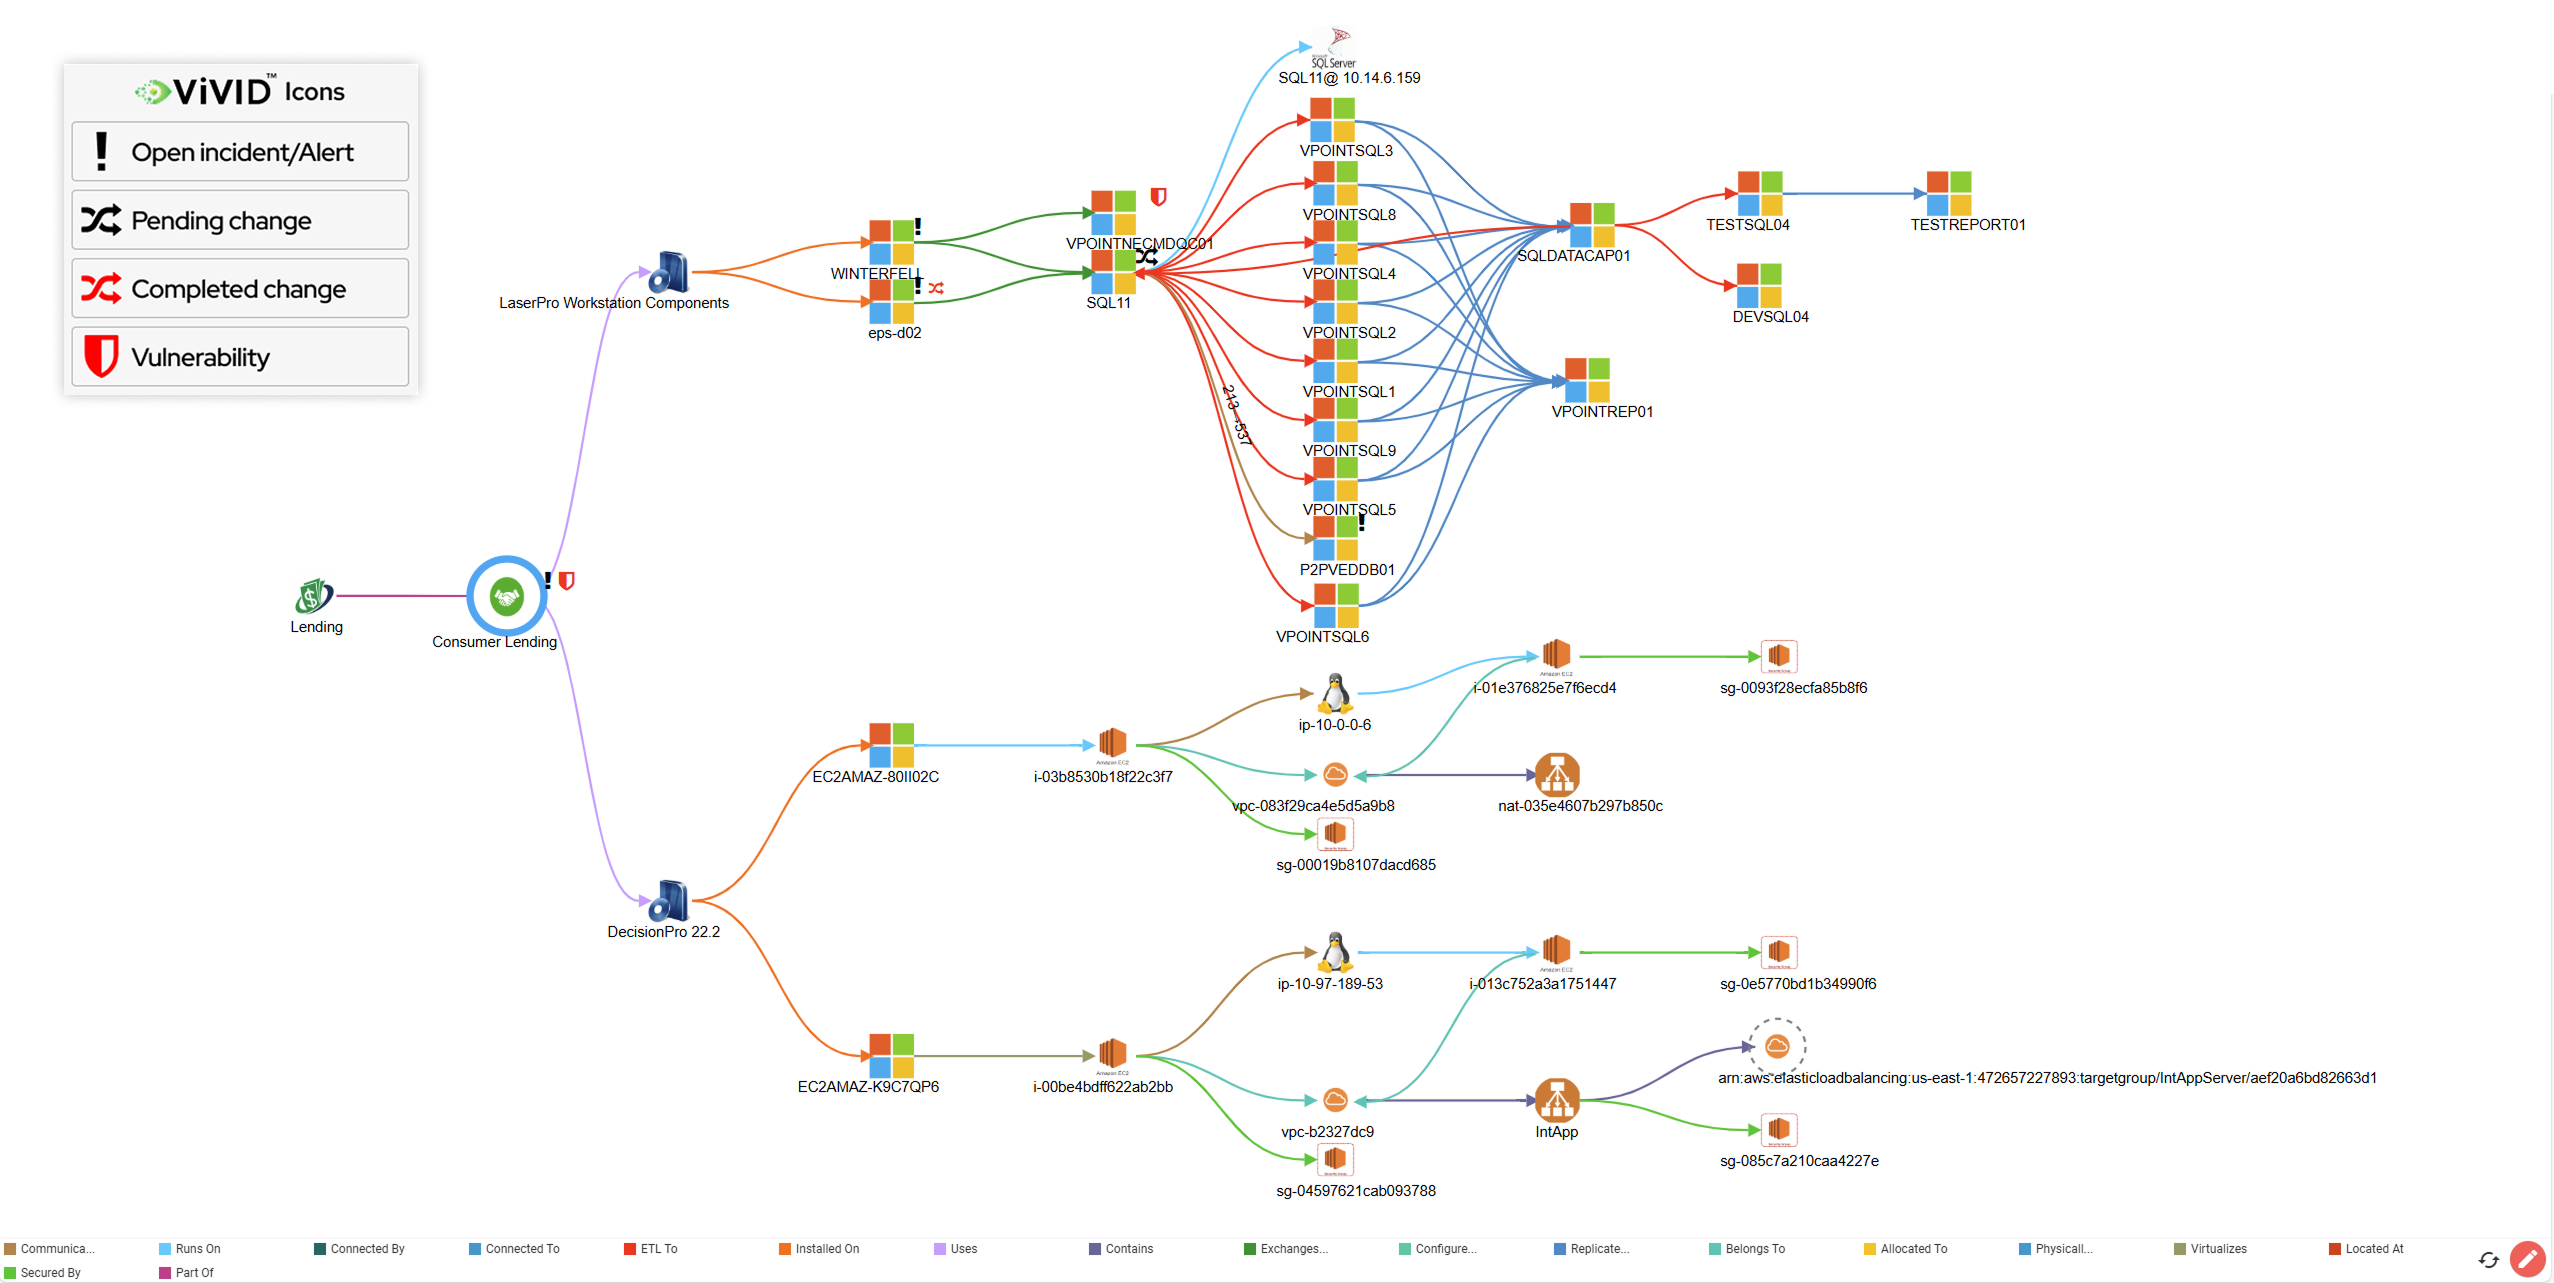
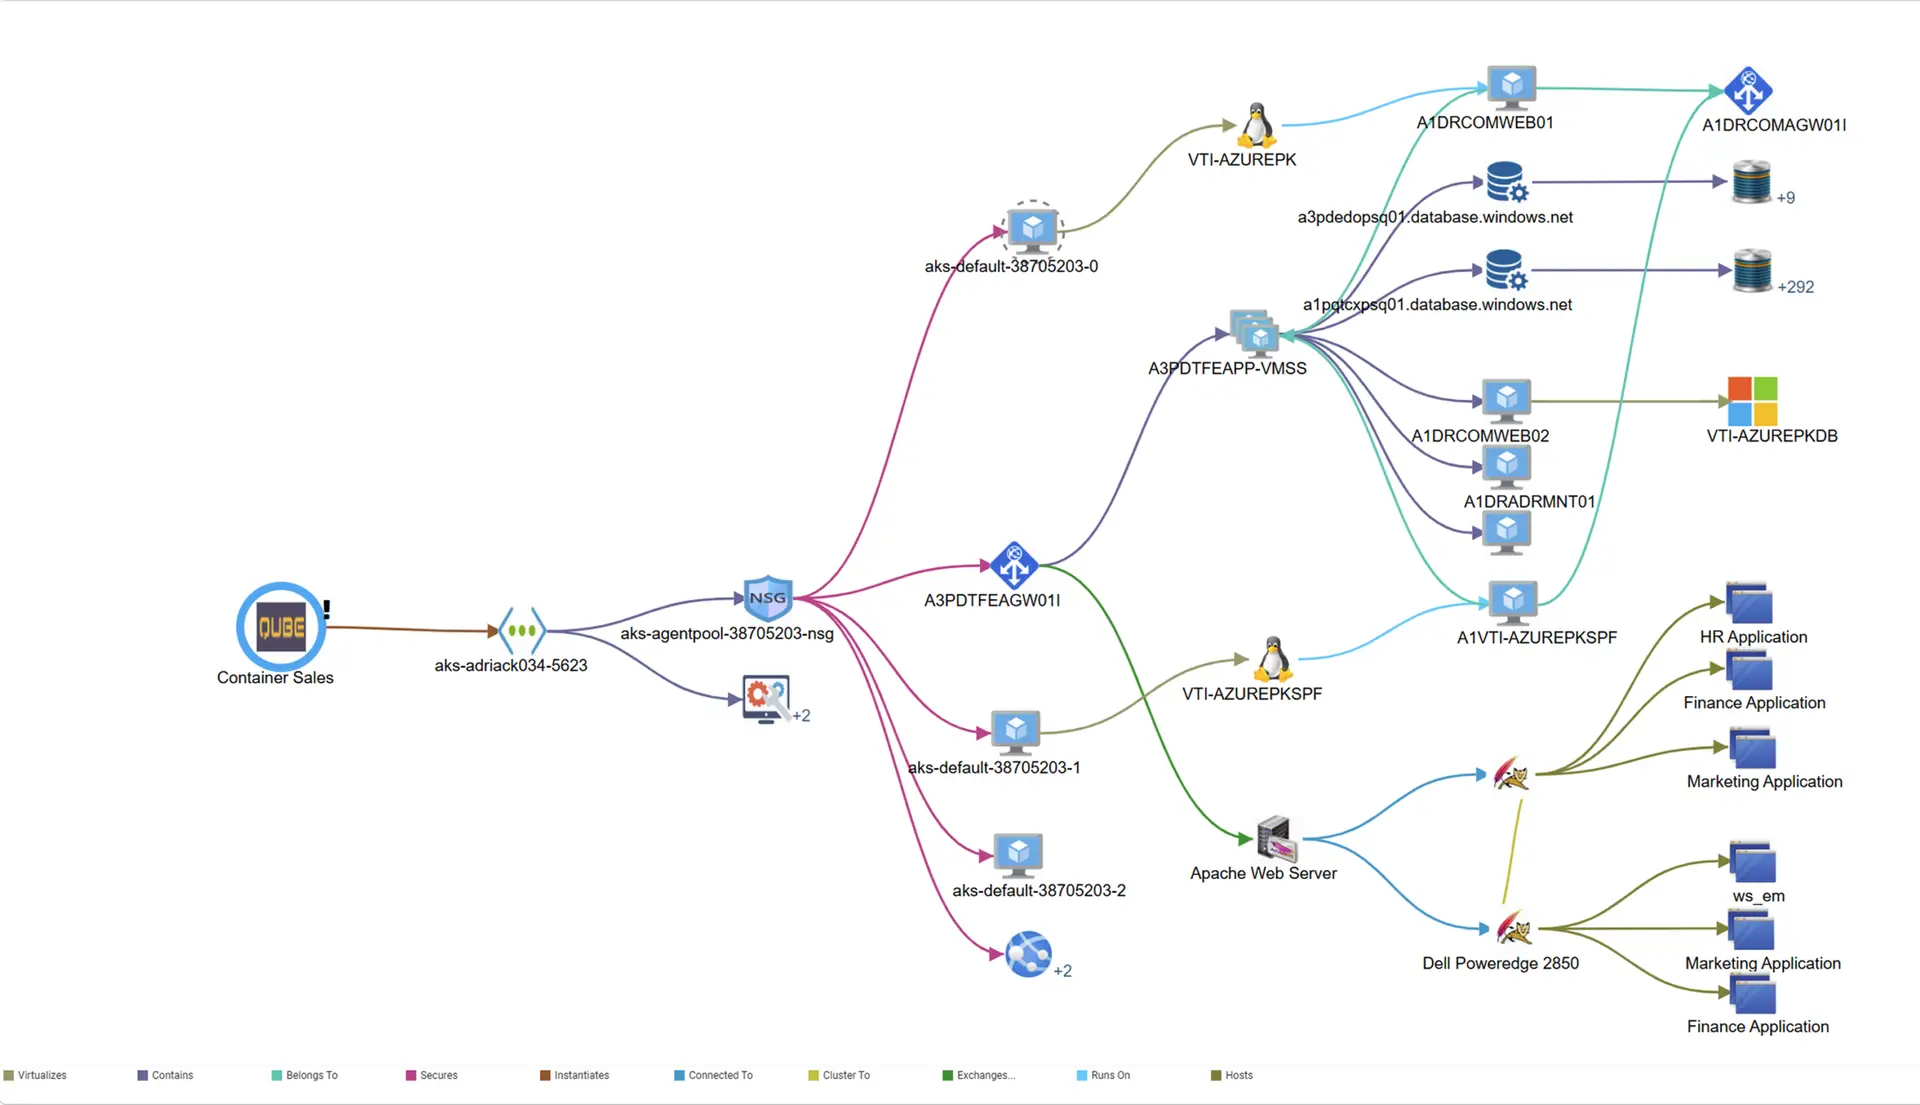
ViVID™ builds live service maps directly from your discovery data, overlaying ITSM records, vulnerability data, and change history onto every map view. No manual maintenance. No diagrams built in workshops that are stale before the meeting ends. The result is Trusted Runtime Truth for your full IT estate — blast radius, dependencies, ownership, and change risk — visible before any action fires.
Dynamic AI/ML Relationships
ITSM and Vulnerability Overlays
Change Impact Analysis
Root Cause Analysis
Simplify IT Asset and Service Management with Virima
Simplify IT Asset Management
Top Two Ways Virima Visual Impact Display Benefits IT Operations
Vivid for IT Ops
Top Two Ways Virima Visual Impact Display Benefits Cybersecurity
Vivid for Cybersecurity
Why Trusted Runtime Truth Changes Everything
Operational intelligence, not just maps
ViVID™ transforms static service maps into a live, discovery-sourced heads-up display —
overlaying incidents, changes, alerts, and vulnerabilities so your teams can act faster.
Faster mean time to
resolution (MTTR)
Blast radius visibility
before every change
always current
Clarity when it matters most
When an outage hits, the first question is always: “What changed?” ViVID™ answers that instantly by correlating service dependencies with live operational data, helping teams pinpoint root causes and slash MTTR.
Change without the guesswork
Every change carries risk. ViVID™ visually highlights blast radius, stakeholders, and downstream dependencies, giving IT managers the confidence to plan changes without blind spots.
ML-driven accuracy
A collaboration hub for IT, SecOps & DevOps
ViVID™ centralizes incidents, changes, vulnerabilities, and asset context into a single shared view, enabling cross-team alignment during outages, change planning, and security investigations.
A CMDB that works for everyone
Instead of a spreadsheet-like CMDB buried in forms, ViVID™ turns configuration data into a visual, navigable, and actionable asset that drives better decisions across the organization.
Complements, not replaces, your ITSM
ViVID™ fills the visibility gaps that ITSM tools alone can’t solve — bringing context, dependency awareness, and real-time impact analysis to platforms like ServiceNow, Jira, and Ivanti.
Virima Visual Impact Display (ViVID™)
How ViVID™ Service Mapping Works
stays current automatically.

Discovery data
Virima discovers your infrastructure via scheduled scans, keeping asset inventory fresh and accurate.

Service definitions
Our team defines services once — using the Virima UI or by importing a CSV.

Dependency mapping
ViVID™ builds the full dependency structure automatically and refreshes it as new scan data comes in.

Live dependency map
Always current with the latest scan data. No manual maintenance. No stale diagrams. Explainable at every layer.
See your environment like never before
Change Management
With ViVID™ and Without ViVID™
With ViVID™
Without ViVID™
Operational Context on Every Map
ViVID™ overlays active operational data directly onto your service maps through bi-directional integrations
with ServiceNow, Jira Service Management, Ivanti, Halo, Xurrent, and Hornbill:
Active incidents
Open tickets on components within the map
Pending changes
Recent changes
NVD vulnerabilities
NIST-sourced CVEs overlaid on affected assets with business service criticality from the map
When an incident fires, responders open one map — not five tools. They see what is connected,
what changed, what is vulnerable, and who owns it.
ViVID™ and Agentic IT:
Blast Radius Context Before Every Agent Action
AI agents now operate inside enterprise IT. They remediate alerts, execute runbooks, approve changes, and adjust configurations — often without a human in the loop. An agent that acts without blast radius context can execute a locally correct change that triggers a P1 downstream.
That is trusted runtime truth for agentic IT — what actually exists, how it’s connected, what changed, what could break, and who owns it. Live, explainable, and policy-aware.
With ViVID™
- Alert fires: high CPU on a web server.
- Before approving the agent’s action, an IT ops engineer opens ViVID™.
- Map shows: server’s role in the payments-authentication path, two open incidents on downstream CIs, and a pending change in the same window.
- Engineer overrides autonomous execution. Coordinated fix scheduled instead.
OUTCOME
Without ViVID™
- Alert fires: high CPU on a web server.
- Agent follows runbook — restarts process, scales instance, closes alert. Resolved in 40 seconds.
- Unknown: that server sat in the communication path between the payments service and its authentication cluster. The restart disrupted the session token handoff.
- Payments errors appear 90 seconds later. Human-declared P1 follows.
OUTCOME
What Makes ViVID™ Unique?
ViVID™ overlays operational context — ITSM records, vulnerability data, and change history — directly onto machine-learned service maps.
This is trusted runtime truth in action: every dependency, risk, and change visible in one view.

ITSM Records
Through bi-directional integrations with many popular ITSM platforms, incidents, recent changes, and pending changes are shown within every map view to reduce the guesswork in both change planning and incident response.

Vulnerability Insights
NIST NVD vulnerabilities are displayed on ViVID's maps so remediation priorities are based not only on the severity of the vulnerability, but also on the criticality of the affected asset and the business services it supports.

Visual Dependency Intelligence
ViVID™ assigns distinct colors to each dependency type, giving teams an immediate, intuitive understanding of service relationships — and how a single change or failure could ripple across the environment.
Why Vivid™
What ViVID™ Shows That Other
Service Mapping Tools Don't
with live runtime truth layered directly on top.

Blast radius before the change, not after the incident
Other tools show dependencies. ViVID™ shows you which services and assets a proposed change will touch — before CAB approves it. Pending changes and open incidents on related CIs are visible on the map, not buried in a separate ticket queue.

ITSM overlays — incidents, changes, and vulnerabilities on the map itself
ViVID™ pulls live ITSM records from ServiceNow, Jira Service Management, Ivanti, Halo, Xurrent, Hornbill, and TeamDynamix and overlays them directly onto discovery-sourced maps — whichever of those platforms your tickets live in.

Cross-platform portability
Unlike platform-native service maps that only live inside one tool, ViVID™ maps are sourced from Virima's discovery layer — making the same service intelligence available to every ITSM platform you connect. Teams on Jira Service Management see the same blast radius visibility as teams on ServiceNow.

Shadow assets and undocumented connections
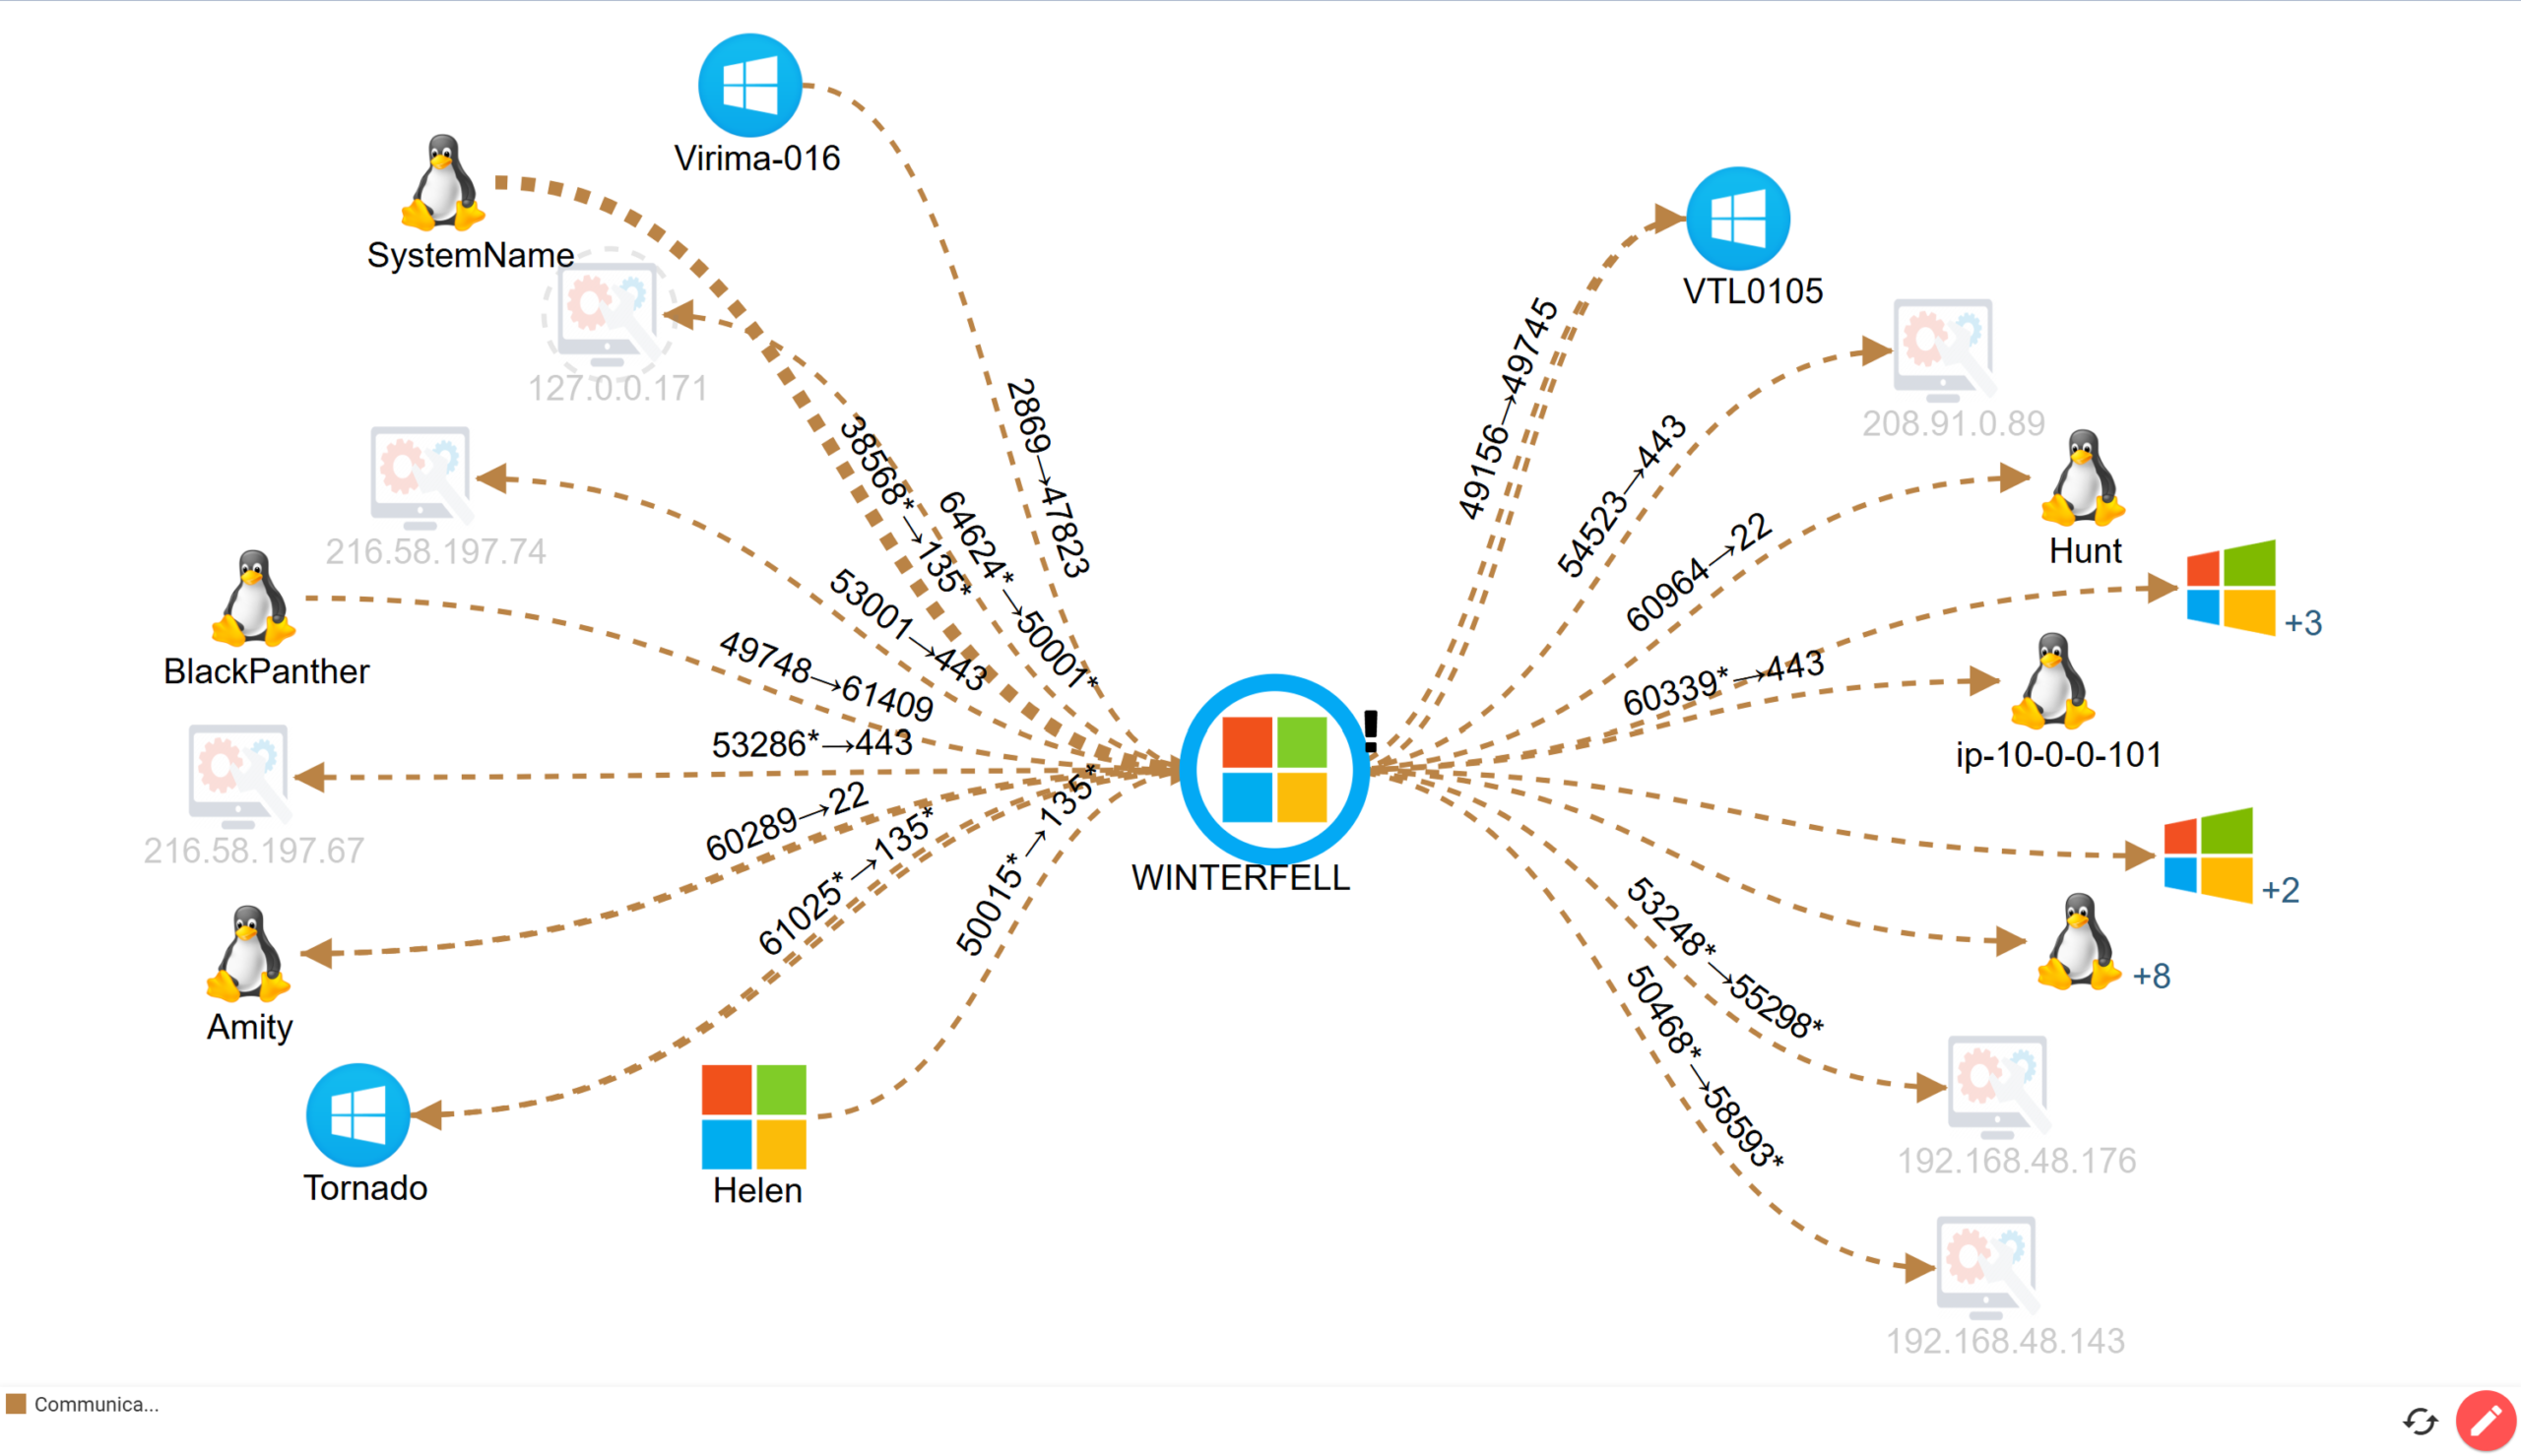
ViVID™ Communication Flow views surface host-to-host connections, including assets not yet in your CMDB. Undocumented dependencies no longer stay hidden until they cause an incident.

NIST NVD vulnerabilities on the service map
Vulnerability tools give you CVE lists ranked by CVSS score. ViVID™ shows CVEs on the map, weighted by the criticality of the business service the affected asset supports — so remediation priority follows service impact, not a raw severity score.
Dynamic Visualizations
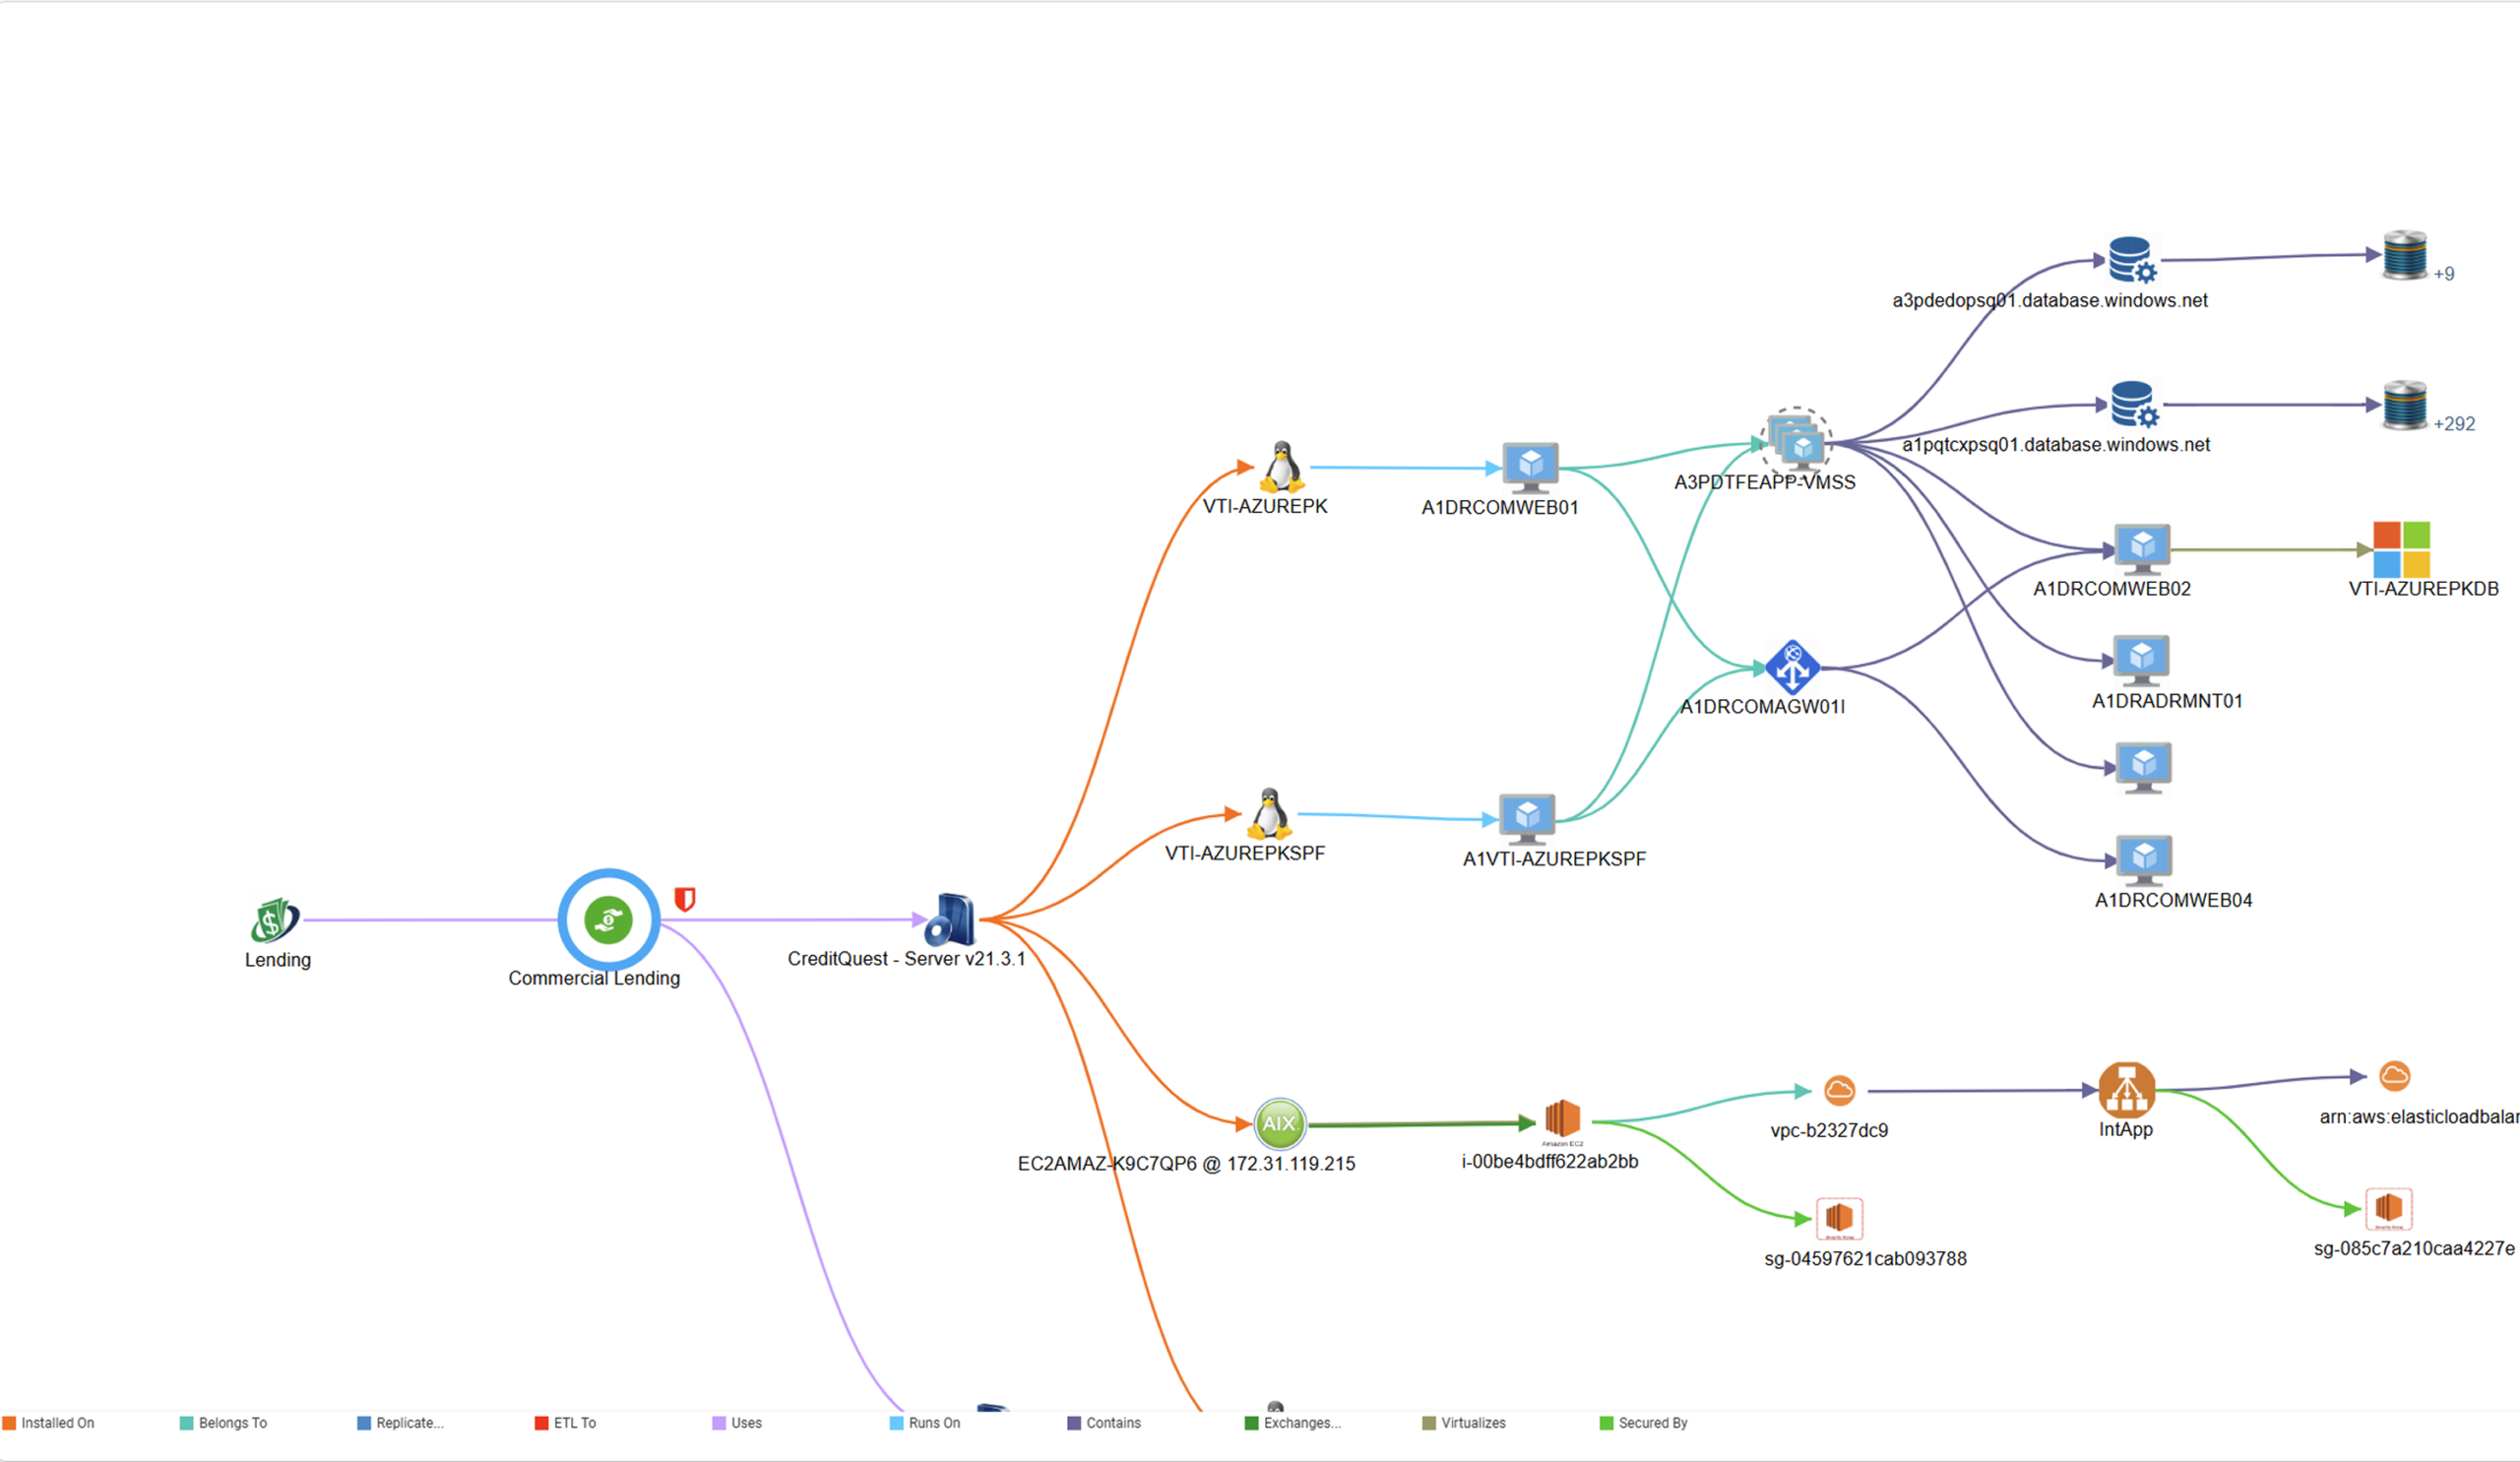
Business Service Map
This is generally considered the most useful view because it provides detailed visibility into how your business services and major applications are supported across the entire IT estate. Add in ITSM overlays and you have a heads-up display for root cause and impact analysis.
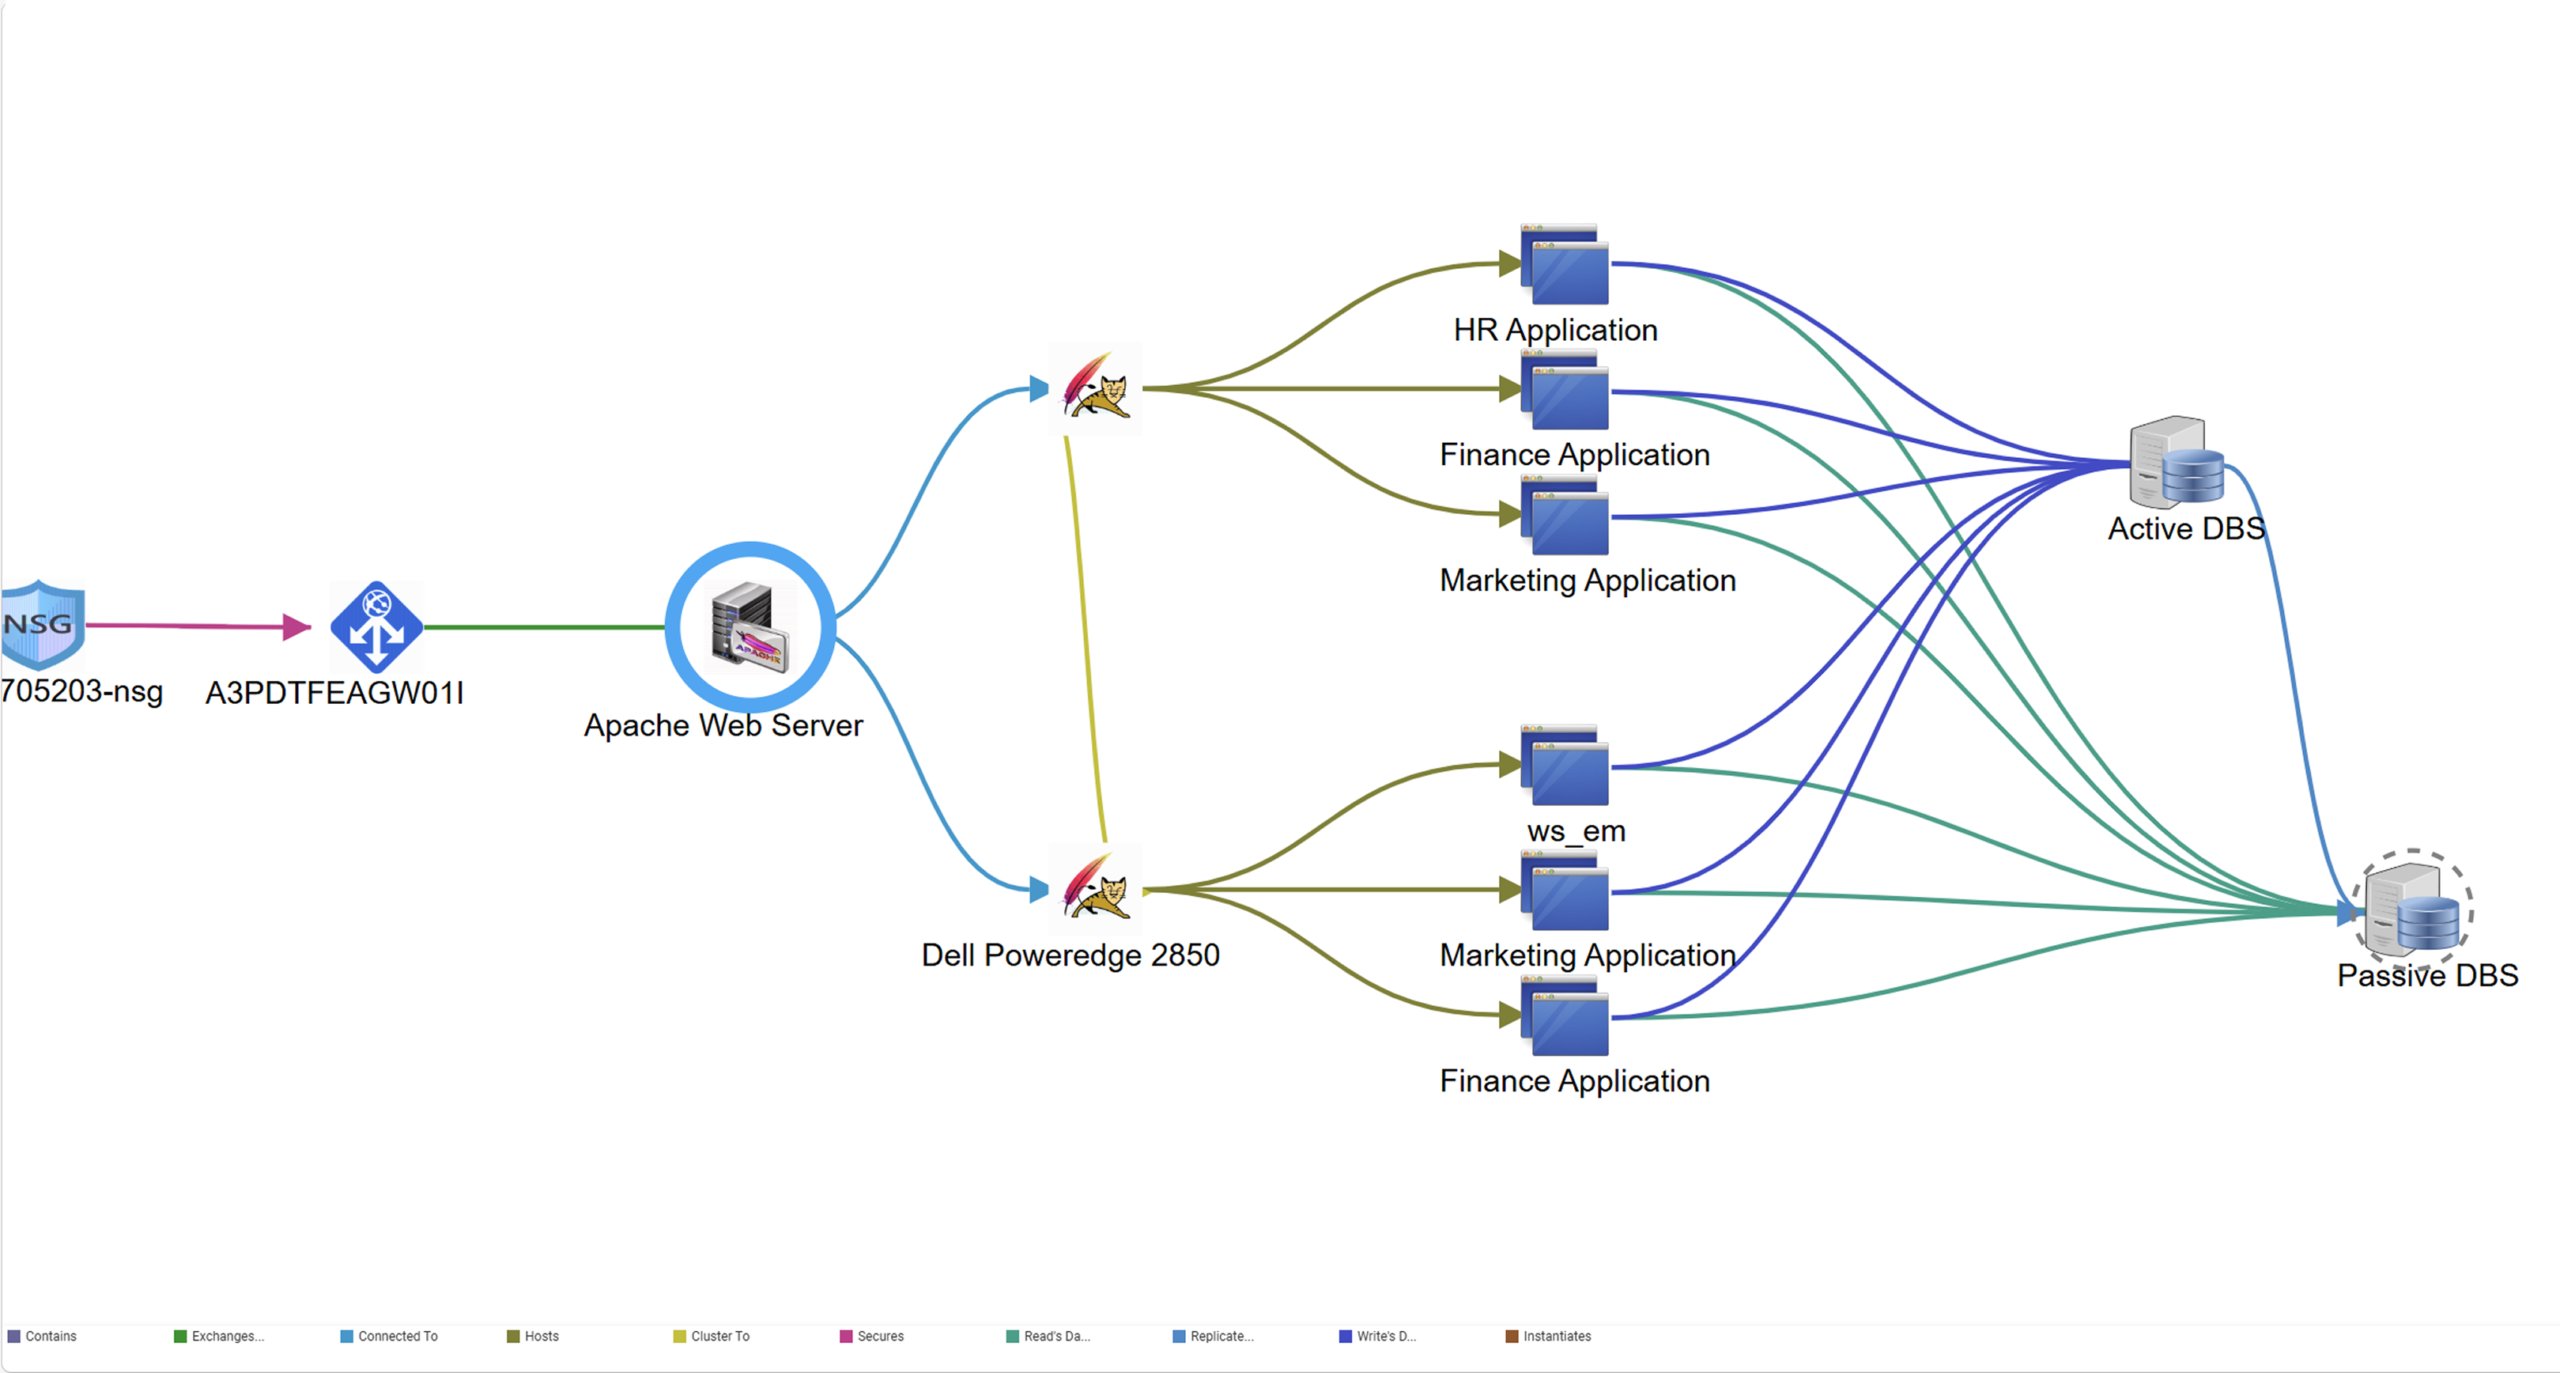
Application Dependency Mapping
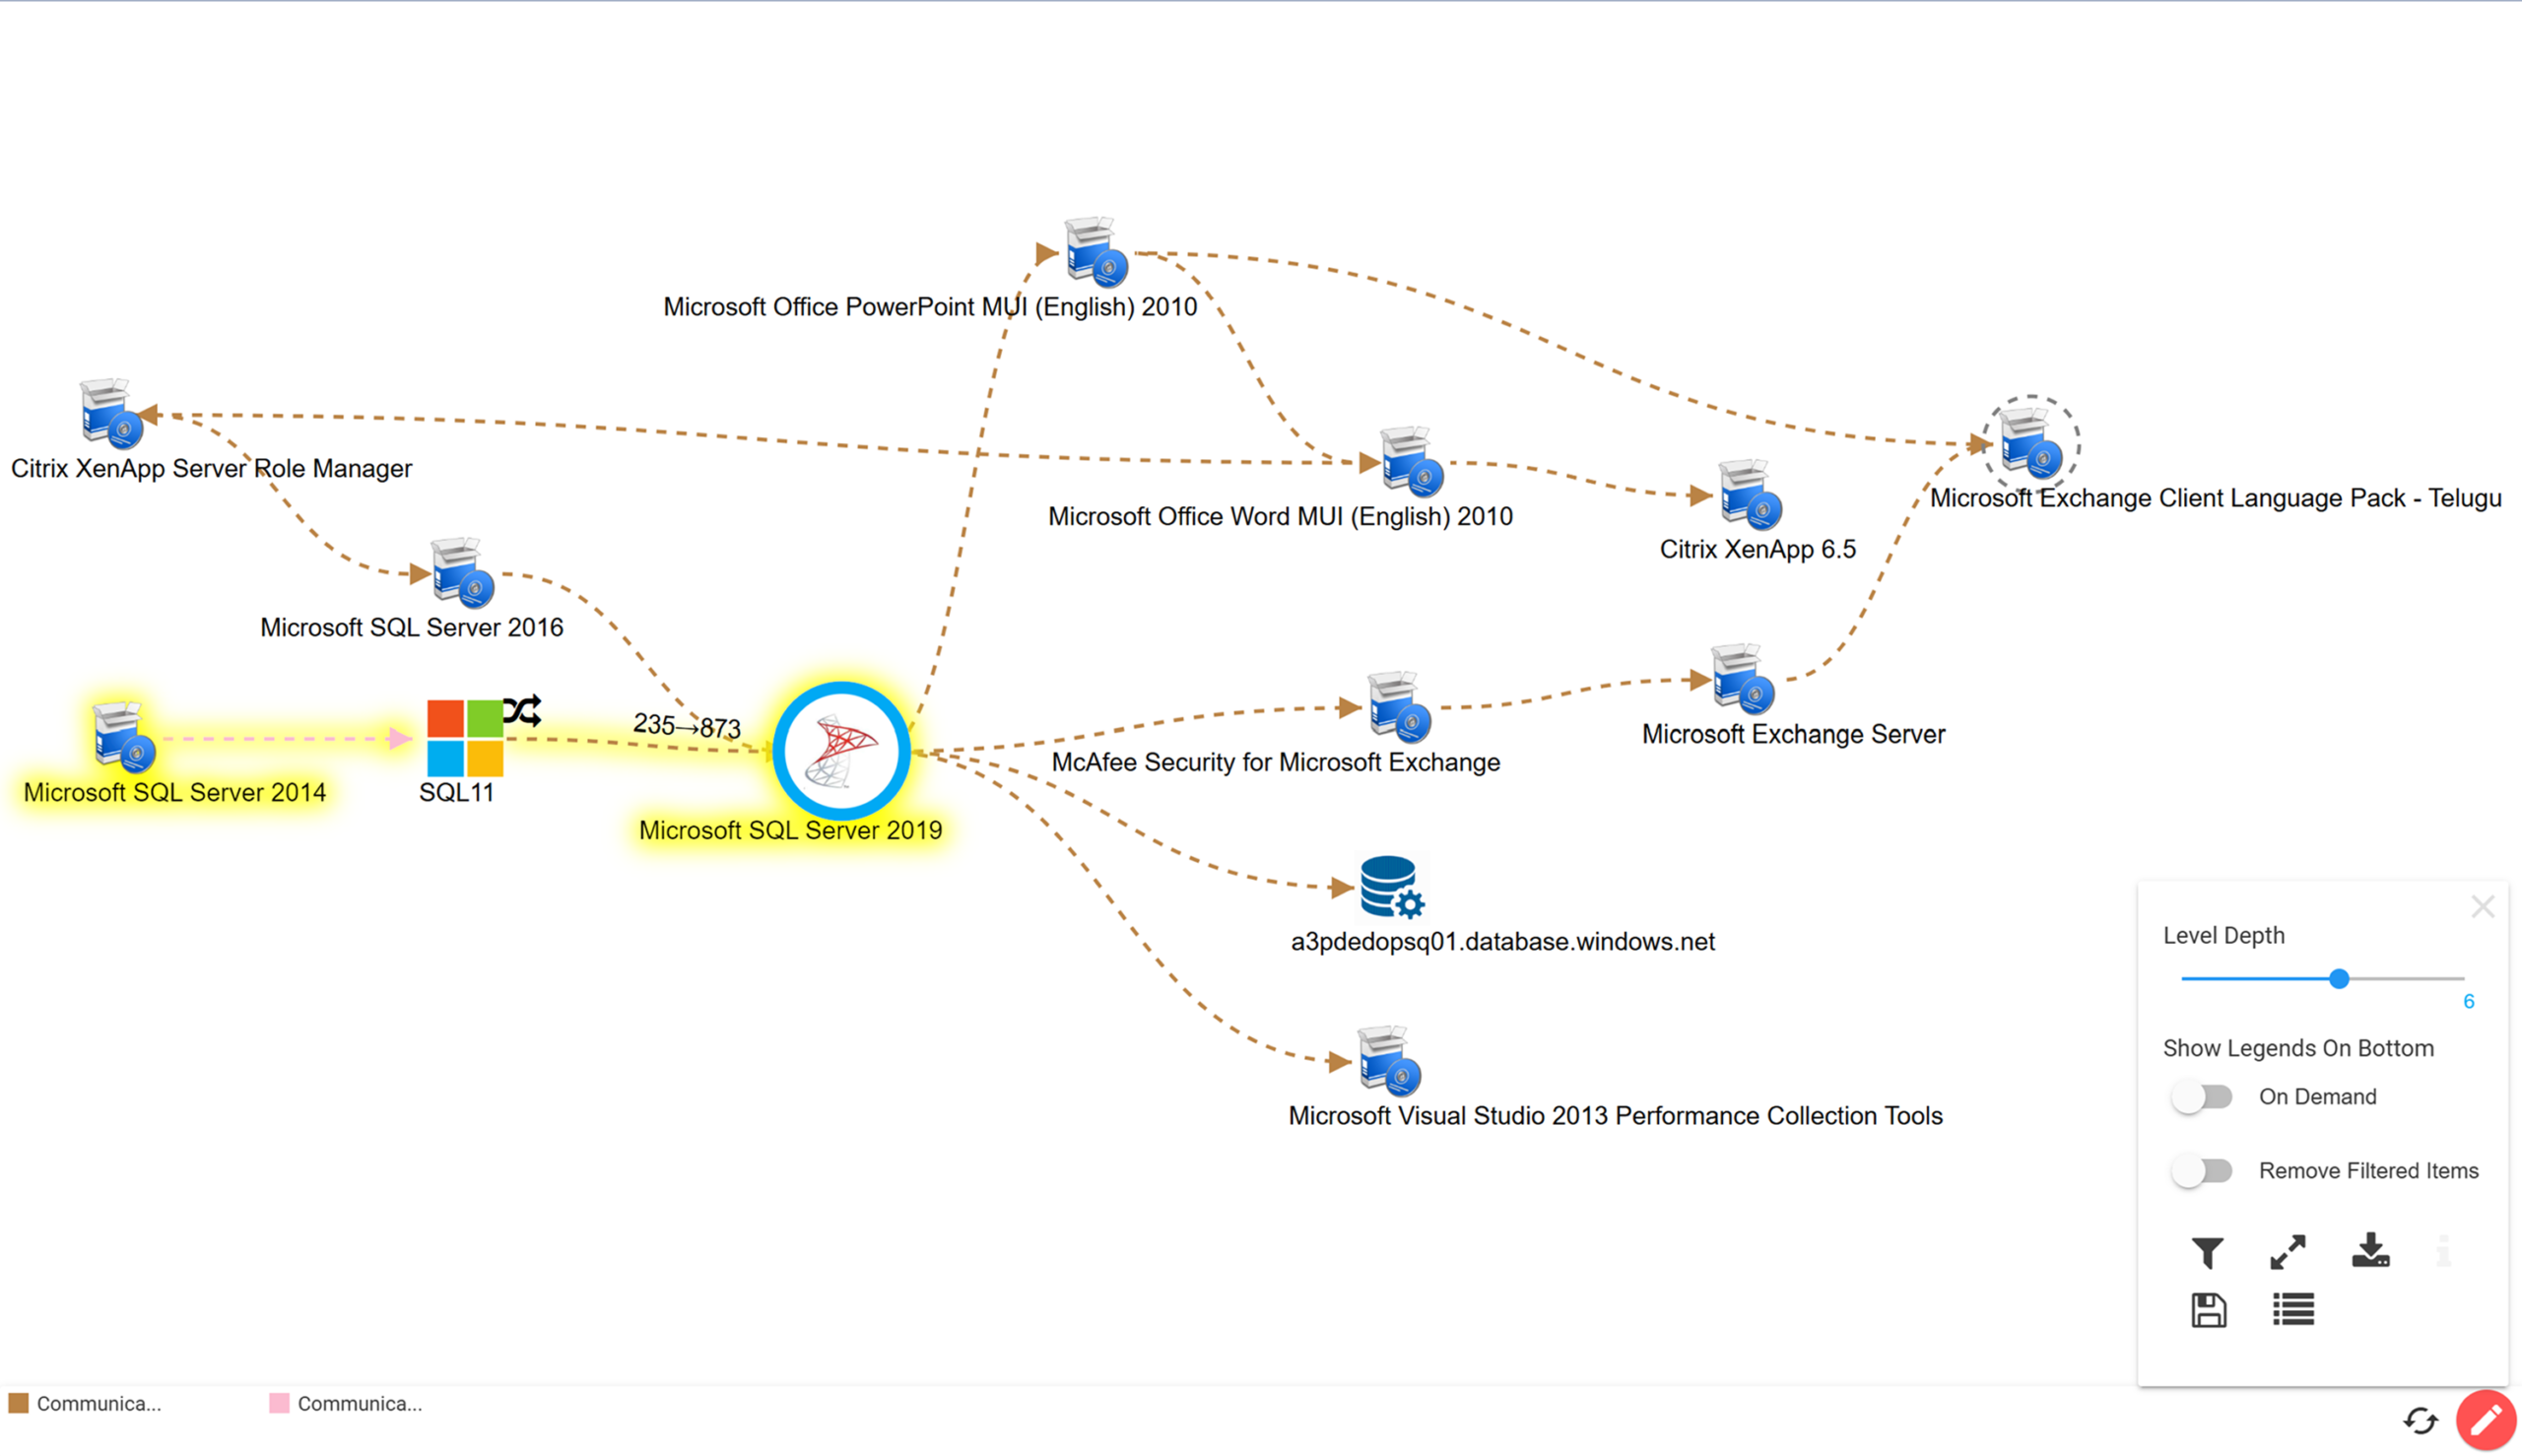
Communication Flows
View server-to-server and server-to-host communications with port numbers and protocol details, including “ghost machines” not yet in the CMDB. Useful for identifying undocumented connections and understanding how traffic moves across your environment.
Cloud Relationships
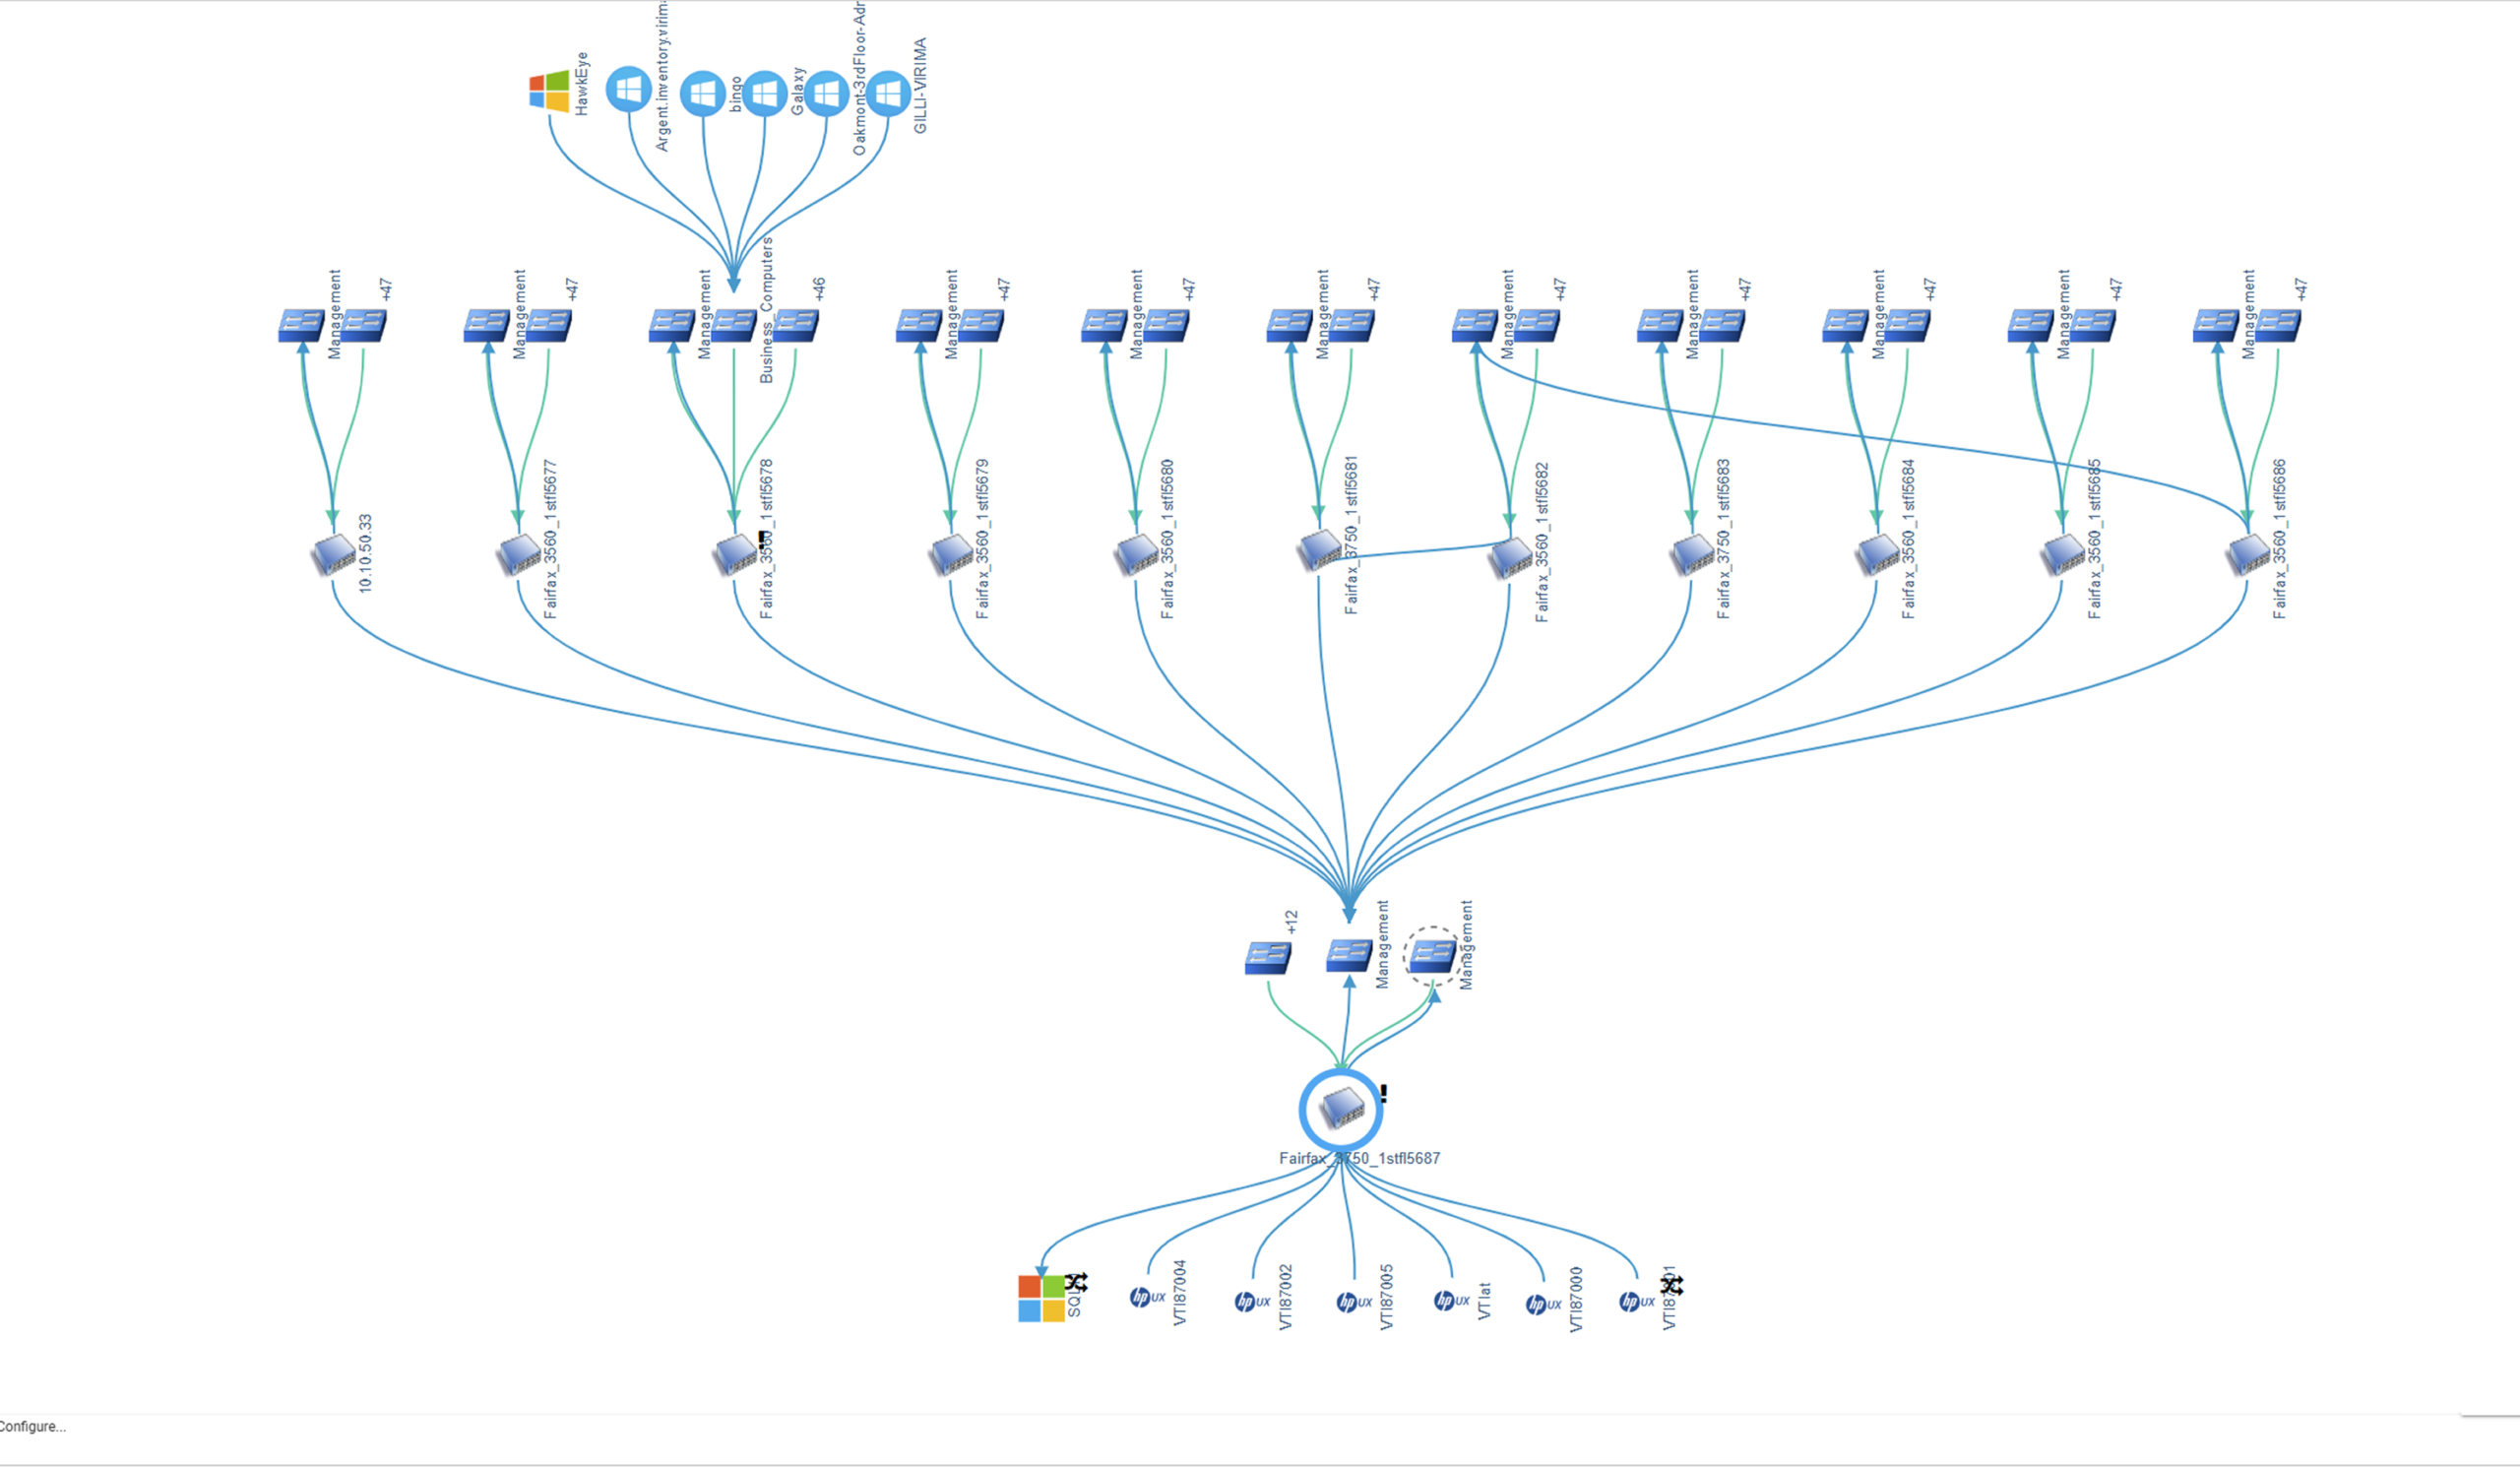
Network Device Dependencies
Map VLANs and device connectivity across your network infrastructure. Understand how routers, switches, firewalls, and load balancers connect and which services depend on them.
Service Topology
Top ViVID™ Service Mapping Use Cases


Root Cause Analysis

Vulnerability Prioritization
Prioritize vulnerability remediation based on asset criticality and business service impact, with NVD vulnerabilities shown directly on the map — so teams act on what matters, not just what scores highest in CVSS.

Business Continuity Planning


Service Dependency Mapping Built for ITSM Teams
ITSM teams need more than a diagram. They need to know which services a change will touch, which incidents trace back to a shared dependency, and which vulnerabilities matter most given what they support.
ViVID™ answers those questions from discovery data, not from a static workshop diagram. It works across ServiceNow, Jira Service Management, Ivanti, Halo, Xurrent, and Hornbill, so the same dependency intelligence shows up wherever your team already works.
FAQ’s around
ViVID™ Service Mapping
01. What is service mapping in ITSM?
Service mapping in ITSM is the process of identifying and documenting the relationships between IT assets, applications, and the business services they support. In practice, it answers one question before any change executes or incident escalates: if this component changes or fails, which business services are affected, who owns them, and what is the downstream impact?
Within the ITIL 4 framework, service mapping supports Service Configuration Management by providing a live, accurate picture of service dependencies. ViVID™ takes service mapping beyond documentation by connecting it to high-frequency discovery data, live ITSM records, and National Vulnerability Database (NVD) vulnerability data — so the map stays current and reflects the live environment, not a static diagram from a workshop six months ago.
02. How does ViVID Service Mapping work?
ViVID™ service mapping follows a four-step process. First, Virima Discovery scans your infrastructure on high-frequency cycles, building and maintaining an accurate asset inventory. Second, your team defines services once — using the Virima UI or via a CSV import. Service definitions require institutional knowledge from your team; they are not inferred automatically.
Third, ViVID™ builds the full dependency structure from those definitions and the latest discovery data. Fourth, the map refreshes as new scan data arrives from your high-frequency cycles, overlaying active incidents, pending and recent changes, and NIST NVD vulnerabilities from your connected ITSM platforms.
03. Why is Service Mapping important to my business?
Service mapping is important because complex IT environments have dependencies that are invisible until something breaks. A change to a shared network component may look low-risk in a ticket but could affect three business-critical services that route through it — a relationship that only a service map would reveal before the change executes.
Organizationally, service maps reduce incident cost by accelerating root cause analysis, reduce change risk by making blast radius visible to the change advisory board (CAB), support compliance audits with documented service relationships, and enable better vulnerability prioritization by tying CVE remediation to business service impact.
04. Are discovery and service mapping the same thing?
No. Discovery and service mapping are related but distinct processes. IT discovery scans infrastructure to identify every asset, its configuration, running processes, open ports, and connections. Service mapping uses that discovery data as input to build a service-level model, grouping related infrastructure components under the business service they support.
Discovery answers: “What exists and how is it configured?” Service mapping answers: “Which services depend on which assets, and what is the impact if something changes or fails?” In ViVID™, the two are tightly coupled — discovery runs the data, and service mapping builds the service-context layer on top of it.
05. What is the difference between service mapping and application dependency mapping?
Application dependency mapping (ADM) traces technical relationships between software components — which application communicates with which database, which API calls which service, and which ports those communications use. It answers infrastructure-level questions from a development and operations perspective.
Service mapping adds the business layer: which collection of applications and infrastructure components together constitute a business service, who owns it, what its SLA is, and what the business impact of a failure would be. ViVID™ provides both views, making it possible to move between the business service perspective and the application dependency perspective on the same dataset.
06. How does service mapping help with incident management and MTTR?
When an incident fires, the first question is always “what changed?” and the second is “what else is affected?” A service map answers both immediately. Responders open one map and see the affected service’s full dependency chain, overlaid with recent changes on related CIs and open incidents on upstream and downstream components — without manually querying four separate tools.
This context directly reduces mean time to resolution (MTTR). Instead of spending the first 20 minutes of an incident determining which team owns which component, responders can follow the map to the originating CI, see what changed and when, and engage the right team immediately.
07. Can service mapping work across hybrid and multi-cloud environments?
Yes. ViVID™ maps services across on-premises infrastructure, cloud-hosted resources (AWS, Azure), SaaS applications, and containerized environments. Virima Discovery identifies assets across these environments, and ViVID™ builds the service dependency structure across the full hybrid footprint.
ViVID™ Communication Flow views surface host-to-host connections across hybrid boundaries, including assets not yet formally cataloged in the CMDB, so migrations and consolidation projects proceed with accurate dependency information rather than assumptions.
08. What data does service mapping need from discovery?
A complete, current service map needs three things from discovery:
- A full asset inventory — servers, applications, virtual machines, containers, network devices, and cloud resources.
- The configuration state of each asset — running processes, installed software, and open ports.
- The communication relationships between assets — which hosts communicate with which, over which ports and protocols.
In ViVID™, Virima Discovery provides all three layers through high-frequency scan cycles using agentless and agent-based techniques, as well as API connectors for cloud platforms and third-party asset management tools.
09. What are common service mapping challenges and how do you overcome them?
The three challenges organizations encounter most often are stale maps, incomplete CMDB data, and lack of stakeholder adoption.
Stale maps: ViVID™ builds maps from live discovery data that refreshes on high-frequency cycles. The map updates when the environment updates, not when someone schedules a workshop.
Incomplete CMDB data: ViVID™ Communication Flow views surface host-to-host traffic and expose undocumented dependencies, giving teams visibility into what their maps are missing.
Stakeholder adoption: ViVID™ cross-platform portability — the same service maps available across connected ITSM platforms — ensures maps are embedded in the workflows teams already use.
10. What is the role of service mapping in change management?
Service mapping is the information foundation that change management depends on to assess impact and risk. Without a current service map, a change advisory board approves changes based on what a ticket says, not on what the environment actually looks like. That gap is where failed changes and unplanned outages originate.
With ViVID™ in the change management workflow, blast radius is visible before CAB approval: which services route through the CI being changed, what other changes are scheduled in the same window, and which open incidents exist on downstream components.
11. Who is ViVID™ service mapping for?
ViVID™ is built for enterprise IT teams who need operational context for change management, incident response, vulnerability prioritization, compliance, and IT governance. Primary users include:
- Change Managers and CAB members — blast radius context before approving changes.
- Incident and Problem Managers — trace root cause and identify what changed in the dependency chain.
- Security Engineers and CISOs — prioritize vulnerability remediation by business service criticality.
- IT Directors and VP IT Operations — visibility into service health and single points of failure.
- Compliance and GRC Leaders — documented evidence for SOX, HIPAA, and PCI audits.
- SREs and Infrastructure Architects — full dependency visibility for migration and capacity planning.
- Platform Engineers — dependency context and impact analysis for IT operations.
ViVID™ is part of the Virima platform — used alongside Virima Discovery and CMDB to give teams across the IT service lifecycle a current, dependency-aware view, the foundation for runtime truth.

Move faster. Act safely.
dependency, change, and risk in one map.