IT Change Management Statistics: Failures, Costs & Benchmarks

This article compiles verified IT change management statistics drawn from Uptime Institute, DORA, IBM, and industry benchmarks. It covers failure rates, outage costs, DORA performance tiers, and the data-quality gap that drives most of the preventable failures. If you are evaluating your current change process or building a case for improvement, these numbers give you a solid, defensible foundation.
Why IT Change Management Failures Happen More Often Than You Think
IT change management failures are more common than most teams realize. Industry research consistently shows that configuration errors and inadequate pre-change impact analysis account for a large share of significant IT outages. Understanding the root causes is the first step toward reducing your own failure rate.
Most IT outages do not come from hardware failures. They come from changes: patches applied without dependency checks, configuration edits that affect downstream services, or emergency changes pushed without proper review. The data backs this up clearly.
According to the Uptime Institute 2025 Annual Outage Analysis , IT and networking issues were the leading cause of significant outages in 2024, with change management problems and misconfigurations identified as key drivers. The same report found that 20% of outages cost more than $1 million, a four-percentage-point increase compared with the prior year.
This trend is important. Even as organizations improve redundancy and disaster recovery, the human and process element of change still generates costly incidents. Poor dependency visibility, incomplete CMDB data, and weak CAB governance repeatedly surface as root causes in post-incident reviews.
For a closer look at how CMDB accuracy affects change outcomes, see CMDB for Change Management: How It Reduces Risk at Every Stage .
What percentage of IT outages are caused by change management failures?
Industry research consistently shows that a significant share of major IT outages trace back to change management issues and misconfigurations. The Uptime Institute’s 2025 Annual Outage Analysis identified change management problems as a primary driver of IT and networking outages in 2024, with 20% of incidents costing organizations more than $1 million.
IT Change Management Statistics: Failure Rates at a Glance
Change failure rate is one of the most revealing metrics in IT operations. It measures the percentage of changes that result in incidents, rollbacks, or unplanned downtime. Published benchmarks from DORA and ITIL frameworks show a wide performance gap between high-performing and low-performing organizations.
Change failure rate (CFR) measures the share of changes that lead to incidents, unplanned rollbacks, or service degradation. It is one of the four DORA metrics and a core ITIL KPI. Here is what the data shows across performance tiers.
| Performance Tier | Change Failure Rate | Source |
| Elite performers | ~5% or lower | DORA 2024 State of DevOps Report |
| High performers | 10%–15% | DORA 2024 State of DevOps Report |
| Medium performers | 15%–30% | DORA 2024 State of DevOps Report |
| Low performers | Over 30% (up to 64%+) | DORA 2024 State of DevOps Report |
| Industry average (ITIL context) | Typically 10%–20% | ITIL benchmarking references |
The gap between elite and low performers is significant. According to the 2024 DORA State of DevOps Report , elite-performing teams achieve a change failure rate near 5%, while low performers can see rates well above 30%. The gap is rarely about skill alone. It is typically about data accuracy: whether teams have reliable, up-to-date configuration data before they approve and execute a change.
For context on how ITIL frameworks define and track these metrics, see ITIL Change Management and CMDB Accuracy: Why One Depends on the Other .
The Financial Cost of Failed IT Changes
Failed IT changes carry a direct financial cost that extends beyond lost productivity. Incident response, rollback labor, and reputational damage compound the direct outage cost. Understanding these numbers helps IT leaders frame change management investment as a business risk decision, not just an operational one.
When a change fails, the cost extends well beyond the immediate service disruption. IT teams spend hours on root cause analysis and rollback. Business units lose productivity. And in regulated industries, compliance violations can add a separate financial layer. Here is what the research shows.
Outage Cost Benchmarks
- 20% of significant IT outages cost more than $1 million (Uptime Institute 2025).
- That $1M+ figure represents a four-percentage-point year-over-year increase.
- Change management failures and misconfigurations are the leading cause of IT and networking outages.
- The average cost per major IT incident often includes both direct costs (recovery, labor) and indirect costs (lost revenue, SLA penalties, reputational damage).
For security-related incidents, the picture is equally stark. The IBM Cost of a Data Breach Report 2024 found that the global average cost of a data breach reached $4.88 million in 2024 — the highest figure recorded in the report’s history. While not all breaches trace back to change management, misconfigurations introduced during changes are a documented contributing factor to security incidents.
The financial argument for investing in better change management processes is straightforward. Preventing one major failure per year typically covers the cost of improved tooling, training, and process refinement. However, organizations often undercount indirect costs, focusing only on direct labor and downtime. A more complete view includes SLA breach penalties, customer churn risk, and audit preparation time after an incident.
How much do failed IT changes cost organizations?
Failed IT changes generate costs across multiple categories: direct incident response labor, rollback time, business productivity loss, SLA penalties, and in some cases regulatory exposure. The Uptime Institute’s 2025 report found that 20% of major outages cost organizations more than $1 million, with change management issues among the leading causes.
For a deeper look at the financial and operational impact of poor change governance, see Risk Assessment vs Impact Analysis in IT Change Management .
Key IT Change Management KPIs and Industry Benchmarks
Change management KPIs give IT leaders a consistent way to measure process health. The most widely used metrics include change failure rate, change success rate, mean time to restore, and CAB utilization rate. Knowing where your organization stands against published benchmarks helps identify which areas need the most attention.
Beyond failure rate, mature change management programs track a set of KPIs that give IT leaders a more complete picture of process health. The benchmarks below reflect commonly cited standards across ITIL-aligned organizations.
| KPI | Benchmark Target | What It Measures |
| Change Success Rate | 80%–90%+ (mature orgs) | % of changes implemented without incidents |
| Change Failure Rate | Under 10% (high performers) | % of changes causing incidents or rollbacks |
| Emergency Change Rate | Under 5% of total changes | % of changes bypassing standard CAB review |
| Mean Time to Restore (MTTR) | Under 4 hours (high performers) | Time to recover from a failed change |
| CAB Utilization Rate | 90%+ of normal changes reviewed | Governance coverage across change pipeline |
| Unauthorized Change Rate | Near 0% | Changes executed outside approved process |
| Backout/Rollback Rate | Under 5% | % of changes requiring full rollback |
These benchmarks are not universal targets. Context matters: a DevOps team running continuous deployments operates differently from an enterprise IT team managing quarterly change windows. However, they provide a useful baseline for evaluating your change management process and identifying where your program may be underperforming.
DORA Benchmarks: What High-Performing Teams Do Differently
The DORA (DevOps Research and Assessment) metrics provide the most widely cited benchmarking framework for software delivery and operational performance. Within DORA, change failure rate is one of four key performance indicators. The 2024 State of DevOps Report data shows a clear separation between tiers.
Change Failure Rate by Tier
- Elite: ~5% CFR — deployments on demand, sub-day lead time.
- High: 10%–15% CFR — strong governance with some process gaps.
- Medium: 15%–30% CFR — inconsistent CAB coverage or dependency visibility.
- Low: 30%–64%+ CFR — high manual overhead, limited pre-change impact analysis.
Elite performers are not just faster. They are more accurate. Their low failure rates trace back to better pre-change data: clear dependency maps, confident CI-level impact assessments, and governance processes that catch risk before the change window opens.
Mean Time to Restore (MTTR)
- Elite: Under 1 hour
- High: Under 24 hours
- Medium: 1 day to 1 week
- Low: Over 1 week
The MTTR gap is particularly striking. When a change fails, elite teams restore service in under an hour because they already know what changed, what it affected, and how to roll back. Low performers often spend hours just determining the blast radius before recovery work can begin. A well-maintained CMDB with accurate dependency data is the foundation that makes fast recovery possible.
What are the DORA benchmarks for change failure rate?
The 2024 DORA State of DevOps Report groups organizations into four tiers. Elite performers achieve a change failure rate near 5%, high performers fall between 10% and 15%, medium performers range from 15% to 30%, and low performers can see rates above 30%. Elite teams also restore service in under one hour, compared to days or weeks for low performers.
The Data Quality Gap: Why Most Change Failures Are Preventable
Most change failures are preventable. The underlying cause is usually not a broken process on paper but inaccurate or stale configuration data that the process depends on. When teams approve changes based on outdated CMDB records, they cannot see the full impact before the change window opens.
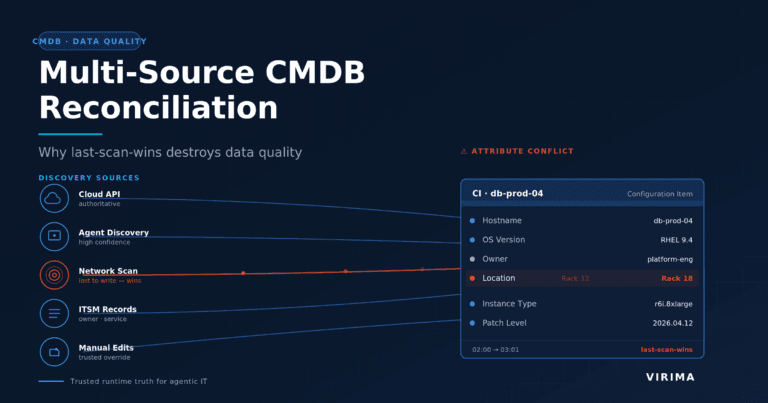
Process maturity alone does not drive down change failure rates. The teams that consistently achieve low failure rates share one characteristic: they work from accurate, current configuration data at every step of the change workflow. When CMDB records are stale or incomplete, even a well-structured CAB process approves changes based on an inaccurate picture of the environment.
This creates a predictable pattern. The change request looks clean on paper. The CAB reviews it and approves it. The change is executed. And then something unexpected breaks, because the actual state of the environment differed from what the CMDB showed. It is a data problem disguised as a process problem.
Discovery-driven configuration data addresses this gap. When IT discovery runs on a high-frequency schedule, CMDB records reflect the real state of the environment: what exists, what is connected, what changed recently, and what other services depend on a given CI. Change managers and CAB members can then conduct impact analysis based on live dependency data rather than assumptions.
For a practical look at how this works, see Application Change Management: Key Strategies for Success and Top 10 ITSM Change Management Best Practices .
Common Root Causes Behind Change Management Failures
Understanding the statistics is useful. Understanding why failures happen is more useful. Post-incident reviews across enterprise IT consistently surface the same root causes.
1. Incomplete or Stale CMDB Data
Change managers approve changes based on what the CMDB shows. If CMDB records are weeks or months old, dependencies are missing, and ownership data is outdated, the pre-change impact assessment is unreliable. This is the most common underlying cause of unexpected change-related outages.
Key Features
- Continuous automated discovery (agent-based and agentless) that keeps CI records current instead of relying on periodic manual updates
- Automated dependency and relationship mapping so connections between CIs are captured, not hand-documented
- Ownership and attribute tracking that updates as the environment changes
- Reconciliation that flags stale, duplicate, or orphaned records against the discovered state
Pros
- Gives change managers a CMDB they can actually trust for pre-change impact assessment
- Removes the manual upkeep burden that lets records drift out of date
- Reduces change-related outages traced back to missing dependencies or bad ownership data
Best For: Organizations whose change decisions rest on a CMDB that’s updated infrequently and where stale data is the root cause of surprise outages.
2. Insufficient Pre-Change Impact Analysis
Many organizations rely on manual dependency checks or spreadsheets to assess change impact. ViVID Service Mapping builds dynamic dependency maps from discovery data, giving change managers a visual picture of which services a CI connects to. Without a tool like this, impact analysis depends heavily on individual engineers’ memory and documentation.
Key Features
- ViVID Service Mapping builds dynamic dependency maps directly from discovery data
- Visual service topology showing which services and CIs a given change will touch
- Blast-radius view that surfaces downstream dependencies before approval, not after
- Discovery-fed maps that stay current as the environment shifts, unlike static spreadsheets
Pros
- Replaces memory-and-documentation guesswork with a visual, data-backed picture of impact
- Lets change managers see second- and third-order dependencies that manual checks miss
- Makes impact analysis repeatable and consistent rather than dependent on which engineer reviews it
Best For: Teams still assessing change impact through manual dependency checks or spreadsheets, where analysis quality varies with individual engineers’ knowledge.
3. High Emergency Change Rates
When emergency changes exceed 5% of total change volume, it signals process gaps. Emergency changes often bypass CAB review and have less documented rollback planning. Organizations with high emergency change rates tend to have higher overall failure rates because the governance that catches problems is routinely skipped.
Key Features
- Automated change workflows with configurable CAB approval routing, so the emergency path isn’t the path of least resistance
- Discovery-fed impact analysis (via ViVID Service Mapping) that makes standard changes fast and confident to assess — reducing the “we had to rush it because we didn’t understand the blast radius” scenario
- Change dashboards that track emergency-vs-standard change ratio as a live metric
- Integration with ServiceNow, Jira, and Ivanti to enforce the process inside the ITSM tools teams already use
Pros
- Turns emergency change rate into something measured and visible rather than discovered after an outage
- Lowers reliance on the emergency route by making the standard route quick
- Keeps governance intact even when teams are under time pressure
Best For: Change and IT ops teams whose emergency changes are drifting past the ~5% threshold and who need both visibility into the ratio and workflow enforcement to bring it down.
4. Unauthorized Changes
Unauthorized changes, those executed outside the approved process, are a persistent problem in enterprise IT. Engineers under time pressure sometimes make configuration tweaks without submitting a change request. When those tweaks cause incidents, root cause analysis takes longer because the change is not logged in the change management system.
Key Features
- Scheduled automated discovery (agent-based and agentless) that detects configuration drift between scans
- CMDB change history and audit trail showing what changed, when, and on which CI
- Reconciliation of discovered state against the authorized baseline, flagging changes with no matching change request
- Dependency context from Service Mapping so a detected change can be traced to the services it touches
Pros
- Surfaces out-of-process changes that would otherwise stay invisible until they cause an incident
- Speeds root cause analysis by tying incidents to the actual change, even one that was never logged
- Acts as a deterrent — engineers behave differently when changes are automatically detected
Best For: Enterprises with distributed or under-pressure engineering teams where shadow changes and out-of-process tweaks are a recurring source of incidents and slow RCAs.
5. Poor Rollback Planning
Many change records include a rollback plan written as a formality. When a change fails and the rollback is untested or vague, MTTR rises sharply. High-performing teams treat rollback planning as an equal priority to the change implementation itself.
Key Features
- Change workflows that treat rollback documentation as a required, structured field rather than free-text formality
- Dependency context from Service Mapping to inform what a rollback actually needs to restore
- CMDB baseline and change history giving a clear “last known good” state to roll back to
- Audit trail tying the rollback plan to the specific CIs and services affected
Pros
- Moves rollback planning from afterthought to a first-class part of the change record
- Grounds rollback plans in real dependency data, so they’re more likely to work under pressure
- Helps contain MTTR when a change fails, because the recovery path is documented and specific
Best For: Change teams where rollback plans are written as a checkbox exercise and untested recovery steps are driving up MTTR when changes fail.
What are the most common root causes of IT change management failures?
Post-incident analysis consistently identifies five root causes: stale or incomplete CMDB data that makes pre-change impact analysis unreliable, insufficient dependency mapping before changes are approved, high rates of emergency changes that bypass governance, unauthorized configuration changes outside the approved process, and untested rollback plans that slow recovery when a change fails.
What Good Looks Like: Benchmarks for High-Performing Change Programs
If your change failure rate is above 15%, there are clear, practical steps that high-performing organizations use to close the gap. The benchmarks below reflect what mature programs achieve and how they get there.
| Metric | Low Performer | High Performer (Target) |
| Change Failure Rate | 30%+ | Under 10% |
| Emergency Change Rate | 10%–20%+ | Under 5% |
| Unauthorized Change Rate | Unknown / High | Near 0% |
| MTTR After Failed Change | Days to weeks | Under 4 hours |
| CMDB Data Currency | Months old | High-frequency updated |
| CAB Coverage | Inconsistent | 90%+ of normal changes |
| Rollback Success Rate | Below 80% | Above 95% |
Reaching these benchmarks requires more than process changes. It requires reliable data at the point of decision. That means IT discovery running on a high-frequency schedule, dependency maps that reflect the current state of the environment, and CMDB records that change managers can trust when they conduct impact analysis. For guidance on building this foundation, see Top 10 Change Management Best Practices in 2025 and Best IT Change Management Tools: Buyer’s Guide .
| See how Virima gives your change management team discovery-driven impact analysis. Schedule a demo. |
How Discovery-Driven Data Reduces Change Risk
The statistics above point to a consistent theme: better data produces better outcomes. Organizations that reduce their change failure rate most effectively do so by closing the gap between what their CMDB shows and what is actually running in the environment.
Virima’s discovery-driven approach keeps CMDB records current by running high-frequency discovery cycles across on-premises and cloud infrastructure. AWS and Azure environments are covered via API-based discovery. On-premises assets are covered through agentless scanning and agent-based methods. The result is a CMDB that reflects the actual state of the environment, not a snapshot from the last quarterly audit.
ViVID Service Mapping then builds dynamic dependency maps from that discovery data. Change managers can see exactly which services connect to a given CI before a change is submitted for CAB review. This means impact analysis is based on live dependency data, not an engineer’s memory or a document that was accurate six months ago. For more on how service mapping integrates with change planning, see Service Mapping Is Critical for Change Management Planning .
The change management integrations with ServiceNow, Ivanti, Halo, Jira Service Management, and Xurrent mean that discovery-sourced data flows into the change workflow your team already uses. You do not need to replace your ITSM platform to benefit from better pre-change data. Virima sits alongside your existing tools and enriches the data they depend on.
How does IT discovery improve change management success rates?
IT discovery improves change management success by keeping CMDB data current so impact analysis reflects the real state of the environment. When dependency maps are built from discovery-sourced data rather than manual documentation, change managers can identify affected services before the change window opens, reducing the likelihood of unexpected failures and shortening recovery time when issues occur.
Turning IT Change Management Statistics Into a Lower Failure Rate
The IT change management statistics in this article tell a consistent story. Most change failures are preventable. They trace back to stale configuration data, incomplete dependency maps, and governance gaps that let risky changes through. High-performing organizations close these gaps by investing in discovery-driven data quality, not just process documentation.
If your change failure rate is above 10%, the most productive place to start is your CMDB. Ask whether your configuration records reflect the actual state of your environment today. Ask whether your change managers can see real dependency maps before they approve a change. If the answer to either question is no, that is where the work begins.
For a structured view of how to assess and improve your current process, see How Good Is Your IT Change Management Process? .
Frequently Asked Questions
What is a good change failure rate for an IT organization?
A good change failure rate depends on your organization’s size, complexity, and deployment frequency. For enterprise IT teams following ITIL processes, a rate below 10% is considered high-performing. Elite DevOps teams tracked by the DORA program achieve rates near 5% or lower. If your current rate is above 20%, that is typically a signal that pre-change impact analysis, CMDB accuracy, or CAB governance needs attention.
Why do IT changes fail even when they go through a CAB review?
CAB review is only as effective as the data it is based on. If CMDB records are stale, dependencies are missing from the impact assessment, or the change request does not reflect the actual current state of the CI, the CAB can approve a change that is riskier than it appears. Discovery-driven configuration data reduces this risk by giving CAB members an accurate picture of the environment before they vote.
What is the difference between change failure rate and change success rate?
Change failure rate measures the percentage of changes that result in an unplanned outage, service degradation, or rollback. Change success rate measures the inverse: the percentage of changes completed without incident. Both metrics track the same outcome from different angles. Most ITIL-aligned organizations target a change success rate above 85%, which implies a failure rate below 15%.
How often should organizations update their CMDB to support change management?
There is no universal answer, but the data consistently shows that teams with low change failure rates work from current configuration data. High-frequency discovery cycles, rather than quarterly or annual audits, give change managers a CMDB they can rely on at the point of decision. For most enterprise environments, this means running discovery on a regular schedule so that dependency maps and CI attributes reflect recent changes to the environment.