Application Dependency Mapping: How to Automatically Map IT Service Relationships in Your CMDB
Modern enterprise IT environments carry hundreds of interdependent applications, services, and infrastructure components. When something breaks, the team that knows exactly what depends on what resolves incidents in minutes. The team that has to guess spends hours. Application dependency mapping gives IT operations that clarity: a complete, accurate picture of every relationship between every configuration item (CI) in the environment.
Manual approaches to this problem fail consistently. Spreadsheets go stale. Wikis fall behind. The infrastructure changes faster than any human documentation process can track. Virima 6.1.1 solves this with automated Discovery that continuously detects CI relationships and ViVID (Visual Impact Display), a dynamic service mapping layer that renders those relationships into filterable, interactive topology views. This article covers how it works, what you can do with it, and why it matters across incident management, change management, and security operations.
What Is Application Dependency Mapping?
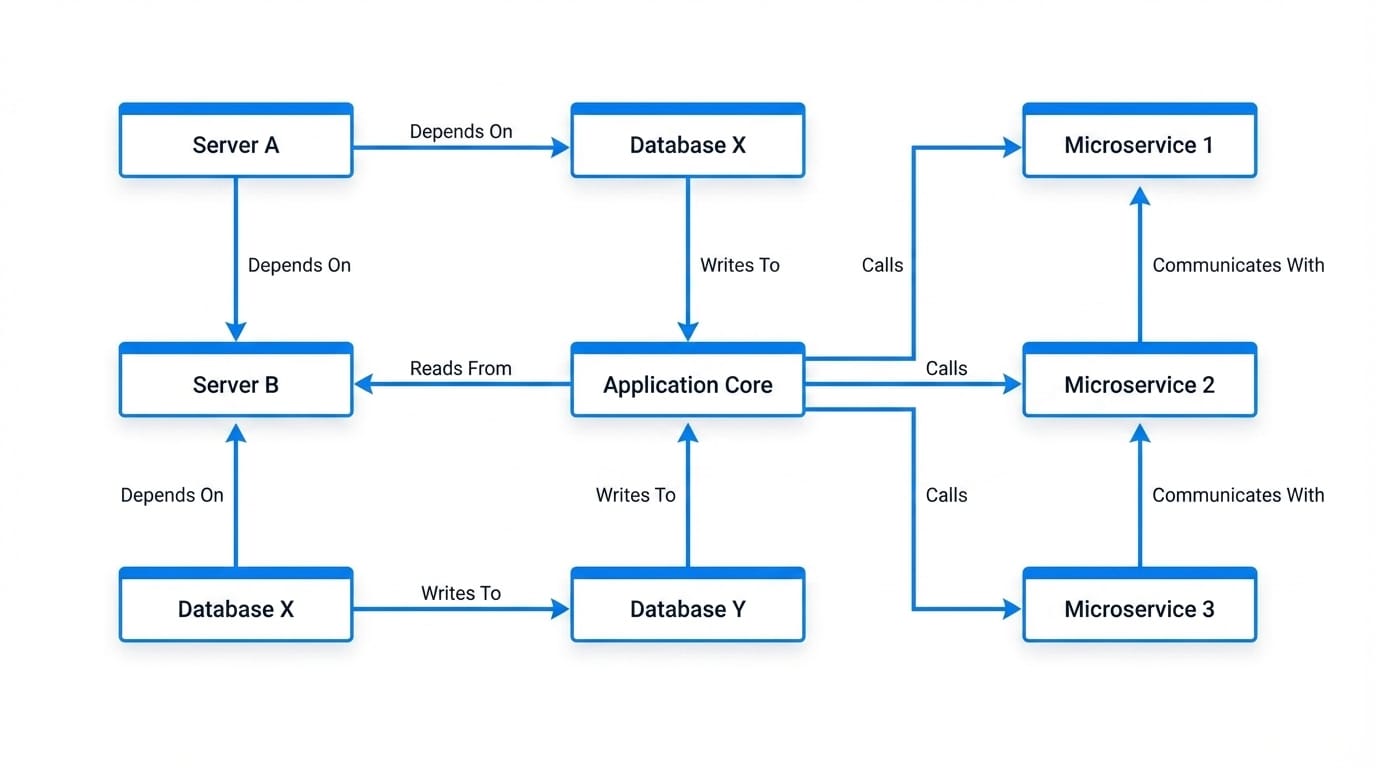
Application dependency mapping (ADM) is the process of identifying and documenting every relationship between applications, infrastructure components, and business services in an IT environment. A complete dependency map answers three questions for any CI: What does this CI depend on? What depends on this CI? How does it communicate with the rest of the environment?
These answers are not just useful for documentation. They are essential for three core ITSM disciplines:
Incident response. When a service goes down, the dependency map shows which CIs are in the blast radius and which upstream CI is the probable root cause. Without it, responders work from intuition and tribal knowledge.
Change management. Before approving a change to a database server, the change advisory board (CAB) needs to know which applications sit on top of it. Application dependency mapping surfaces that full list automatically, so no downstream impact is missed.
Vulnerability remediation. Not every vulnerability can be patched immediately. When teams prioritize CVE remediation by asset criticality rather than just CVSS score, the dependency map determines which vulnerable assets underpin the most critical business services, and those get patched first.
A CMDB that stores CIs without accurate relationship data only solves half the problem. The relationship layer, built and maintained through automated discovery, is what makes the CMDB operationally useful.
The Problem with Manual Dependency Mapping
IT teams have tried to solve dependency mapping through interviews, workshops, network scans run by hand, and documentation sprints. None of these approaches hold up at scale, and here is why.
Change Velocity Outpaces Documentation
In a modern hybrid environment, new VMs spin up, containers deploy, applications update, and cloud resources provision continuously. A dependency map documented in a workshop last quarter reflects an environment that no longer exists.
Spreadsheets Have No Relationship to Live Data
A spreadsheet showing which servers host which applications is accurate the day it is created. Two weeks later, after three deployments and a migration, it is a liability. Teams that trust stale documentation make changes based on incomplete blast radius assessments.
Shadow IT and Undocumented Devices Create Blind Spots
Devices and applications that IT never formally provisioned communicate on the network anyway. Manual documentation processes never capture these because no one knows to document what no one knows exists. These “ghost machines” are invisible in spreadsheet-based dependency maps but very visible in network traffic.
Human Cognitive Load Caps the Scope
A skilled architect can map dependencies for a handful of services. At 200 services with thousands of CIs, no human team can maintain accurate documentation without automated tooling.
Audit and Compliance Failures Follow
When a security audit or regulatory review asks for an accurate map of which systems process sensitive data and what they communicate with, outdated manual documentation produces findings and remediation timelines.
The root problem is not that teams do not try hard enough. Manual dependency mapping simply does not scale. The only durable solution is automated discovery that detects relationships as they exist in real time and feeds them into a CMDB that stays accurate.
How Automated Application Dependency Mapping Works in Virima
Virima Discovery scans the IT environment using agentless and agent-based methods to detect CIs and their relationships. Every scan populates the Virima CMDB not just with CI attributes (hostname, OS, IP, software) but with the relationship types that connect those CIs.
Relationship Types Virima Discovery Auto-Detects
Runs On: an application or service runs on a specific server or virtual machine
Communicates With: a host actively communicates with another host on the network
Connected To: a physical or logical network connection between devices
Installed On: software installed on a hardware or virtual CI
Component Of: a CI that is a sub-component of a larger service or system
Hosted On: a workload hosted on a cloud or hypervisor platform
Virtualized On: a virtual machine running on a hypervisor
Load Balancer For: a load balancer serving traffic to a pool of application servers
How Discovery Keeps Relationship Data Current
These relationships are not static. Every new Discovery scan updates the CMDB, so the relationship data reflects the current state of the environment, not a historical snapshot.
How ViVID Renders Dependency Data Visually
ViVID (Visual Impact Display) sits on top of the Virima CMDB and renders these relationships as interactive, filterable service maps. IT operations teams use ViVID to explore the dependency graph visually, filter by CI type, relationship type, or service context, and drill into specific nodes to understand the full dependency chain.
The result: application dependency mapping that is always accurate, requires no manual effort to maintain, and supports multiple visualization formats for different operational use cases.
5 Key Views in ViVID Service Mapping
ViVID renders the same underlying CMDB relationship data through multiple visualization modes, each designed for a different operational context.
1. Network Topology View
The network topology view shows the physical and logical network connectivity across the environment. It maps Connected To and Load Balancer For relationships, giving network teams and architects a clear picture of how devices interconnect at the infrastructure layer. This view supports network segmentation reviews, firewall rule audits, and network change planning.
2. Application Dependency View
The application dependency view is the core ADM use case. It shows the full dependency chain for a selected application or service: which servers it runs on, which databases it connects to, which other services it depends on, and which services depend on it. Teams use this view during incident triage and change planning. ViVID supports horizontal, vertical, and radial layout options so the team can orient the dependency graph to match their preferred mental model.
3. Communication View
The communication view shows active host-to-host traffic flows based on Discovery scan data. Unlike the application dependency view (which reflects documented CI relationships), the communication view reflects actual observed network communication. This includes open port numbers, traffic direction, and critically, ghost machines: devices that actively communicate on the network but do not appear in the CMDB. Ghost machines represent undocumented infrastructure that creates risk in change management and security audits. The communication view surfaces them automatically.
4. DevOps Service Topology View
The DevOps service topology view presents the environment through a service-oriented lens aligned with modern DevOps and SRE practices. It groups CIs by service context rather than physical infrastructure, making it easier for application teams and DevOps engineers to understand service boundaries, dependencies, and ownership. This view supports service reliability planning and cloud migration assessments.
5. Relationship Drill-Down
From any node in any ViVID view, users can drill down to see the complete set of relationships attached to that CI: relationship type, target CI, and the directionality of the dependency. This drill-down capability is essential during incident triage when the goal is to trace a dependency chain quickly without switching contexts.
How ViVID Supports Incident Root Cause Analysis
Incident root cause analysis (RCA) is one of the highest-value applications of an accurate service map. The challenge in traditional incident management is that the people handling the incident must mentally reconstruct the dependency chain from memory, documentation, and tribal knowledge, often while under pressure.
ViVID removes that cognitive burden by letting teams overlay active incidents directly on the service map. When an incident record is linked to a CI in the Virima CMDB (or via integration with a connected ITSM platform such as ServiceNow, Ivanti, Jira, Xurrent, HaloITSM, Hornbill, or TeamDynamix), ViVID renders the incident indicator on the affected CI node in the service map.
The 5-Step RCA Workflow in ViVID
Step 1. An incident fires for a business-critical application. The responder opens the ViVID application dependency view for that service.
Step 2. ViVID shows all CIs in the dependency chain with incident overlays on every CI that currently has an active or recent incident. If the database server upstream of the application also has an incident, it appears on the map immediately.
Step 3. The responder traces the dependency chain upstream, following the Runs On and Communicates With relationships from the affected application back to the likely root cause CI.
Step 4. The blast radius is visible at a glance. Every downstream service that depends on the suspected root cause CI is visible in the map, so the responder knows the full scope of impact before committing to a remediation path.
Step 5. Once the root cause CI is identified, the team executes the fix. The ITSM incident record updates, and the incident overlay on ViVID clears.
This workflow turns what can be a multi-hour RCA process into a structured, visually guided investigation. For more detail on how Virima supports root cause analysis, see Elevating IT Incident Management with Virima’s Root Cause Analysis.
Change Impact Analysis with ViVID
Undocumented dependencies are the primary cause of failed or unplanned change outcomes. A DBA patches a shared database server, three applications that no one knew were connected to it fail, and the change rolls back at 2 a.m. This scenario repeats across enterprises whose change management processes rely on manual discovery of dependencies.
Pre-Change Blast Radius Analysis
ViVID solves this with pre-change blast radius analysis. Before any change request is approved:
The change manager or change owner opens the ViVID service map for the CI targeted by the change.
ViVID renders the full dependency chain: every CI that runs on, communicates with, or depends on the target CI.
The team reviews the downstream impact scope. If 12 applications depend on the target database, those application owners receive notification before the change window.
The change advisory board approves or rejects the change with complete dependency visibility rather than partial information.
Surfacing Pending Changes and Failed Change History
ViVID also supports the review of pending changes on a CI before a new change is initiated. If a CI already has an open change request or a recent failed change in the ITSM system, ViVID can surface that context on the service map, preventing the mistake of scheduling a second change on an already-unstable component.
ITSM Integration for Unified Change Workflows
The integration with ITSM platforms, including ServiceNow, Ivanti, Jira, Xurrent, HaloITSM, Hornbill, and TeamDynamix, means that ITSM change data and Virima CMDB relationship data work together in a single workflow. Teams do not need to switch between systems to get complete pre-change visibility.
Vulnerability Prioritization Using Service Maps
Security teams face an unsolvable problem with traditional vulnerability management: there are always more CVEs than remediation capacity. CVSS scoring helps rank individual vulnerabilities by severity, but it tells teams nothing about which vulnerable assets are the most operationally important.
How ViVID Overlays NVD Data on the Service Map
ViVID addresses this gap by overlaying NIST NVD vulnerability data directly on the service map. When a Discovery scan identifies software versions and the NIST NVD integration flags CVEs against those versions, ViVID marks the affected CI nodes on the service map with vulnerability indicators. Teams that want to combine these CVE markers with live incident data can extend this into a full vulnerability overlay service map workflow that pinpoints root cause faster during active investigations.
Questions CVSS Alone Cannot Answer
The security operations team can now answer questions that CVSS alone cannot answer:
This server has a CVSS 7.8 vulnerability. What business services depend on it?
We have 40 high-severity CVEs across 30 servers. Which 5 servers sit at the top of our most critical service dependency chains?
If this vulnerability is exploited, what is the blast radius across the business?
Prioritizing Remediation by Business Risk
By combining CVSS severity with service map criticality, teams build a remediation queue that reflects actual business risk rather than theoretical severity scores. A CVSS 7.8 vulnerability on a server that no production service depends on is less urgent than a CVSS 6.5 vulnerability on a server that sits at the base of five critical business services.
Application Dependency Mapping vs. Service Mapping: What’s the Difference?
These terms appear together frequently and are sometimes used interchangeably. They describe related but distinct capabilities.
What Application Dependency Mapping Covers
Application dependency mapping focuses on identifying and documenting the relationships between specific applications and the infrastructure components they depend on. The output is a graph of CIs and their dependency relationships. ADM answers the question: “What does this application need to run?”
What Service Mapping Adds
Service mapping is broader in scope. It connects application dependency data to business services, showing how a collection of CIs and applications collectively deliver a business capability. A service map for the Order Management service, for example, includes the application tier, the database tier, the network tier, the authentication services, and any third-party integrations, all tied together under the business service concept.
How Virima Connects Both Layers
In Virima, application dependency mapping is the foundation layer. Virima Discovery detects CI relationships and stores them in the CMDB. ViVID Service Mapping builds its service dependency mapping on that foundation by rendering those relationships as service-oriented maps, layered with operational context from ITSM incidents, vulnerabilities, and change records.
For a detailed comparison of dependency mapping tools, see CMDB Dependency Mapping: Which Tool Leads the Pack.
Application Dependency Mapping Delivers Operational Clarity When It Is Automated and Visual
Application dependency mapping moves from a documentation exercise to an operational capability when it is automated, always accurate, and rendered in a format that IT teams can act on during incidents, changes, and security reviews. Virima 6.1.1 delivers this through continuous Discovery that populates the CMDB with auto-detected relationships, and ViVID that renders those relationships in actionable, filterable service maps.
Schedule a Demo at virima.com to see how ViVID Service Mapping and automated application dependency mapping work in your environment.
Frequently Asked Questions
What is application dependency mapping in a CMDB?
Application dependency mapping in a CMDB is the process of automatically detecting and storing the relationships between applications, servers, databases, and other configuration items. Tools like Virima Discovery populate the CMDB with relationship types such as Runs On, Communicates With, and Hosted On, so that every CI’s full dependency chain is visible without manual documentation.
How does automated dependency mapping improve incident response?
Automated dependency mapping gives incident responders an immediate visual of the full dependency chain for any affected service. Instead of reconstructing relationships from memory or documentation, responders open the service map, see every upstream and cmdb application dependencies downstream dependency, and trace the root cause in a structured, evidence-based workflow. This reduces mean time to resolution (MTTR) significantly.
What is the difference between application dependency mapping and service mapping?
Application dependency mapping identifies the specific CIs and relationships that an application dependency mapping tool depends on, for example, the servers it runs on and the databases it connects to. Service mapping is broader, connecting those application dependencies to a business service context. In Virima, Discovery provides the dependency data and ViVID renders it service relationship mapping it at both the application dependency and business service level.