Visual CMDB: 4 Benefits That Help IT Teams See What They Manage
Why Configuration Data Is So Hard to Work With
The systems your CMDB describes are critical to business operations. Understanding them through ITSM tables and spreadsheets is like navigating a city with a phone book instead of a map. All the information exists. The context does not.
Modern infrastructure makes this harder. Tracking containerized workloads across Kubernetes environments requires visibility into EKS, ECS, and AKS clusters that shift constantly and rarely appear in static inventories. Storage and hyper-converged infrastructure create dense dependency layers that traditional discovery tools miss entirely. And as AI-driven automation expands, the accuracy and structure of CMDB data for AI agents becomes a foundation requirement rather than a best practice.
A visual CMDB addresses this by giving your team a representation of the environment that matches how human reasoning actually works.
What Is a Visual CMDB?
A visual CMDB translates configuration item records and the relationships between them into interactive, navigable maps. Instead of querying tables to trace what depends on what, your team can see it. Dependency paths, ownership assignments, linked incidents, and change history all appear in context within a single view.
A visual CMDB is a configuration management database that renders CI records and their relationships as interactive dependency maps. It gives IT teams direct visibility into topology, ownership, and service context, reducing the cognitive load of incident triage, change planning, and audit preparation.
4 Core Benefits of a Visual CMDB
1. Your Brain Is Built for Visual Data
The phrase “a picture is worth a thousand words” describes how your visual cortex actually works. When you look at a map of your IT environment, you simultaneously take in topology, relationships, patterns, and anomalies. When you read a list of configuration records, you reconstruct that picture item by item. This difference has a direct operational impact.
With a visual CMDB, your team can:
- Understand an asset’s full context at a glance
- Identify dependency relationships without writing queries
- Spot patterns like redundant paths or single points of failure
- Recognize changes and gaps as they appear
- Trace the blast radius during an incident rather than searching for it
Database relationships between Oracle and MySQL instances, for example, sit at the center of countless service dependencies. Visualizing those connections turns a multi-hour root-cause investigation into a focused, traceable process.
2. Standard ITSM Tools Cannot Show You What a Visual CMDB Can
Most IT departments rely on ITSM platforms and spreadsheets to analyze configuration data. These tools were built to manage tickets and track records, not to reveal the relationships between them. They show you lists. They do not show you the environment.
CMDB accuracy is the foundation. Inaccurate configuration data does not just limit what you can visualize. It actively misleads every decision made downstream. A visual CMDB surfaces data quality problems because gaps that hide in spreadsheets become immediately obvious on a dependency map.
This matters even more as organizations use AI to act on CMDB data. Governing CMDB data for AI workflows requires more than storing configuration records. It demands verifiable, structured data that AI systems can safely interpret. A visual layer helps you find where that data is missing or outdated before a high-frequency discovery cycle can refresh it.
3. Configuration Data Represents Physical Reality
A CMDB is a digital representation of your physical and virtual environment: real servers, real applications, and real dependencies between them. Yet most teams try to make sense of this reality through rows and columns, tools designed to summarize information rather than represent structure.
This mismatch shows up clearly in infrastructure-heavy environments. When storage CMDB coverage is incomplete, entire tiers of physical hardware become invisible to the teams responsible for them. Visual maps expose these blind spots immediately.
IT teams need the ability to transform configuration data back into a visual format. This lets you use natural cognitive abilities to interpret how components interact and how the environment changes over time. Keeping that picture accurate depends on CMDB business rules that validate and correct configuration records on a recurring basis, so the map reflects current reality rather than a stale snapshot.
4. Visual Context Helps You Act With Less Complete Data
Through a visual CMDB, your team can build a useful understanding of the IT environment even when data is partial. The human brain fills gaps. It connects dots. It recognizes patterns even when some records are missing.
That ability is only as useful as the data feeding the picture. This is why understanding CMDB ROI means accounting for what poor data quality actually costs: delayed incident response, failed changes, and the compounding effort of maintaining inaccurate records. A visual CMDB makes those costs visible by showing exactly where gaps exist, which dependencies lack confirmation, and where stale data is concentrated.
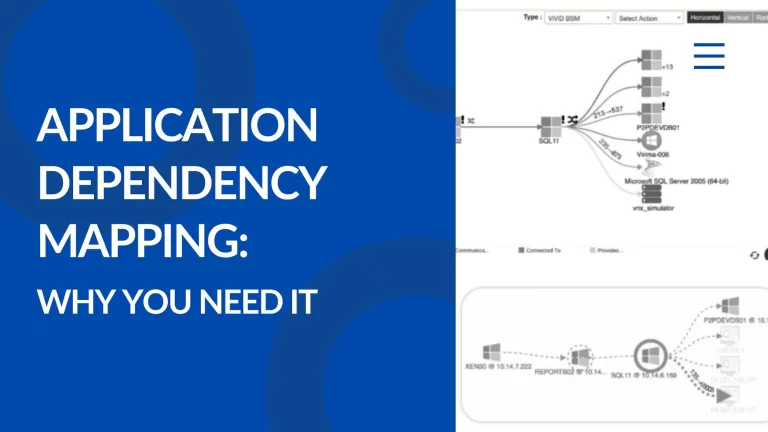
How Virima Delivers Visual CMDB Capabilities
Virima automatically discovers and maps your critical IT resources and the relationships that connect assets, applications, services, and users. Its high-frequency discovery cycles populate and maintain CMDB data without manual updates, so the maps your team relies on reflect what actually exists in the environment.
ViVID service maps provide dynamic dependency visualization, showing blast radius, CI status, linked incidents and changes, and ownership context in a single interactive view. For teams running ITSM on Xurrent, Virima’s discovery capabilities close CMDB gaps by identifying missing CIs, stale relationships, and undiscovered assets. High-frequency discovery cycles keep those maps current between scheduled scans.
Explore how Virima delivers trusted runtime truth across your IT environment, and see what your team has been missing.
Turn Your CMDB Into a Strategic Asset, Not a Stale Spreadsheet
A visual CMDB gives your IT team the clarity to act rather than guess. When configuration data is accurate, structured, and visualized, you resolve incidents faster, approve changes with confidence, and give AI agents the reliable data they need to operate safely. The benefit is not cosmetic. It is operational.
Frequently Asked Questions
What are the main benefits of a visual CMDB?
A visual CMDB improves IT operations in four key ways. It reduces incident resolution time by making dependency relationships visible. It surfaces data gaps that list views hide. It enables accurate change impact analysis before changes are approved. And it gives AI-driven automation the accurate CI data it needs to act safely.
How does a visual CMDB improve incident management?
During an incident, a visual CMDB lets your team trace impact paths immediately. Instead of querying tables to find what depends on a failing component, you see the blast radius on a map. Teams resolve incidents faster when the dependency context is visible and connected rather than scattered across separate records.
What is the difference between a CMDB and a visual CMDB?
A standard CMDB stores configuration item records in a relational database. A visual CMDB renders those records and their relationships as interactive maps, revealing topology, ownership, and service context that list views cannot communicate.
Schedule a demo today to see how Virima’s visual CMDB and ViVID service maps give your IT team the clarity they need before the next incident.