Incident Management KPI Dashboards Still Look Green When the Clock Starts on the Wrong CI

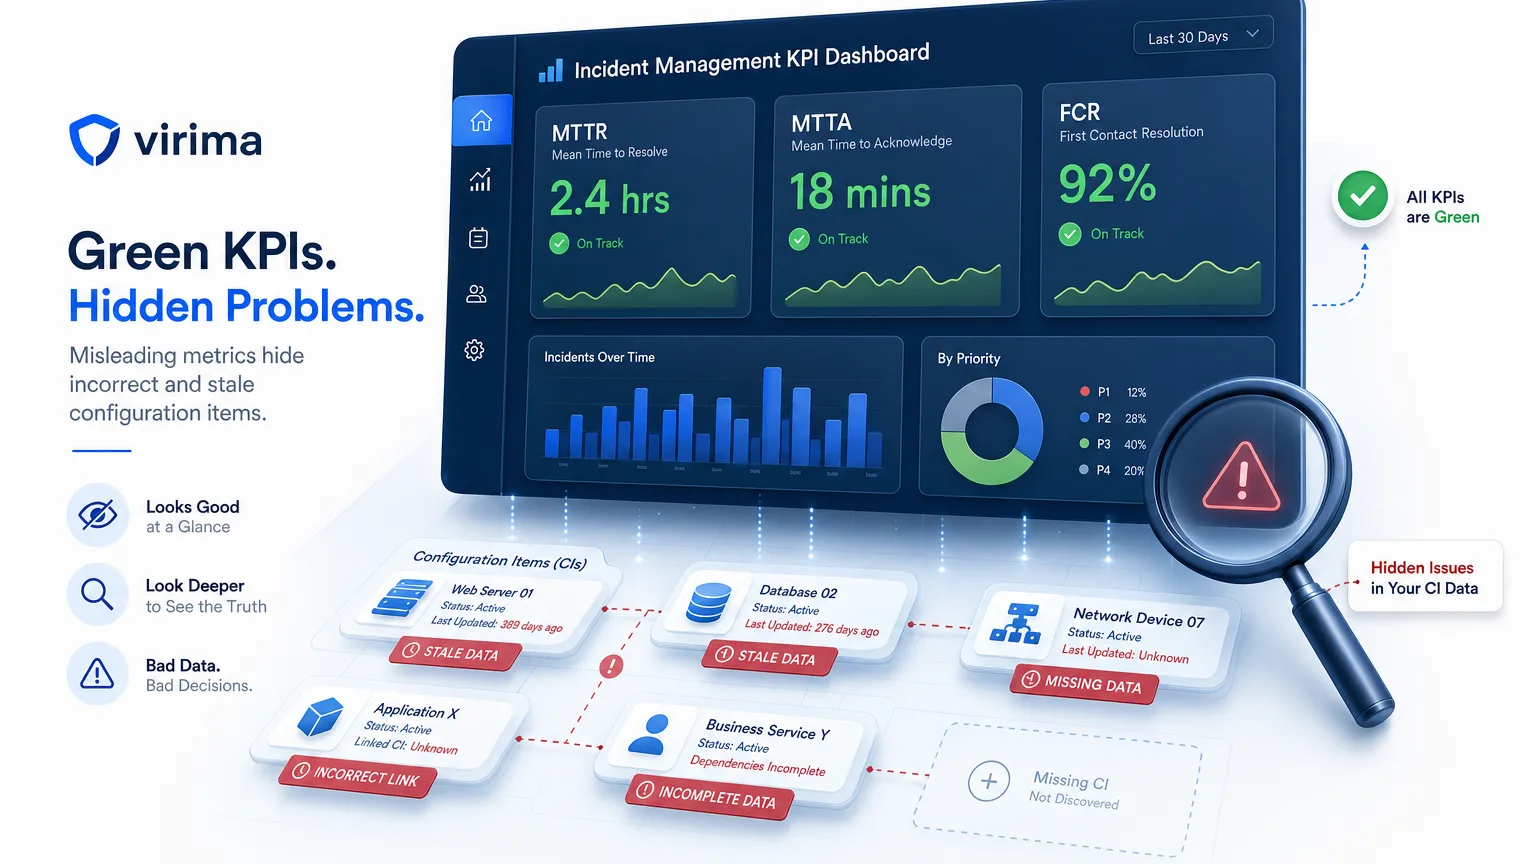
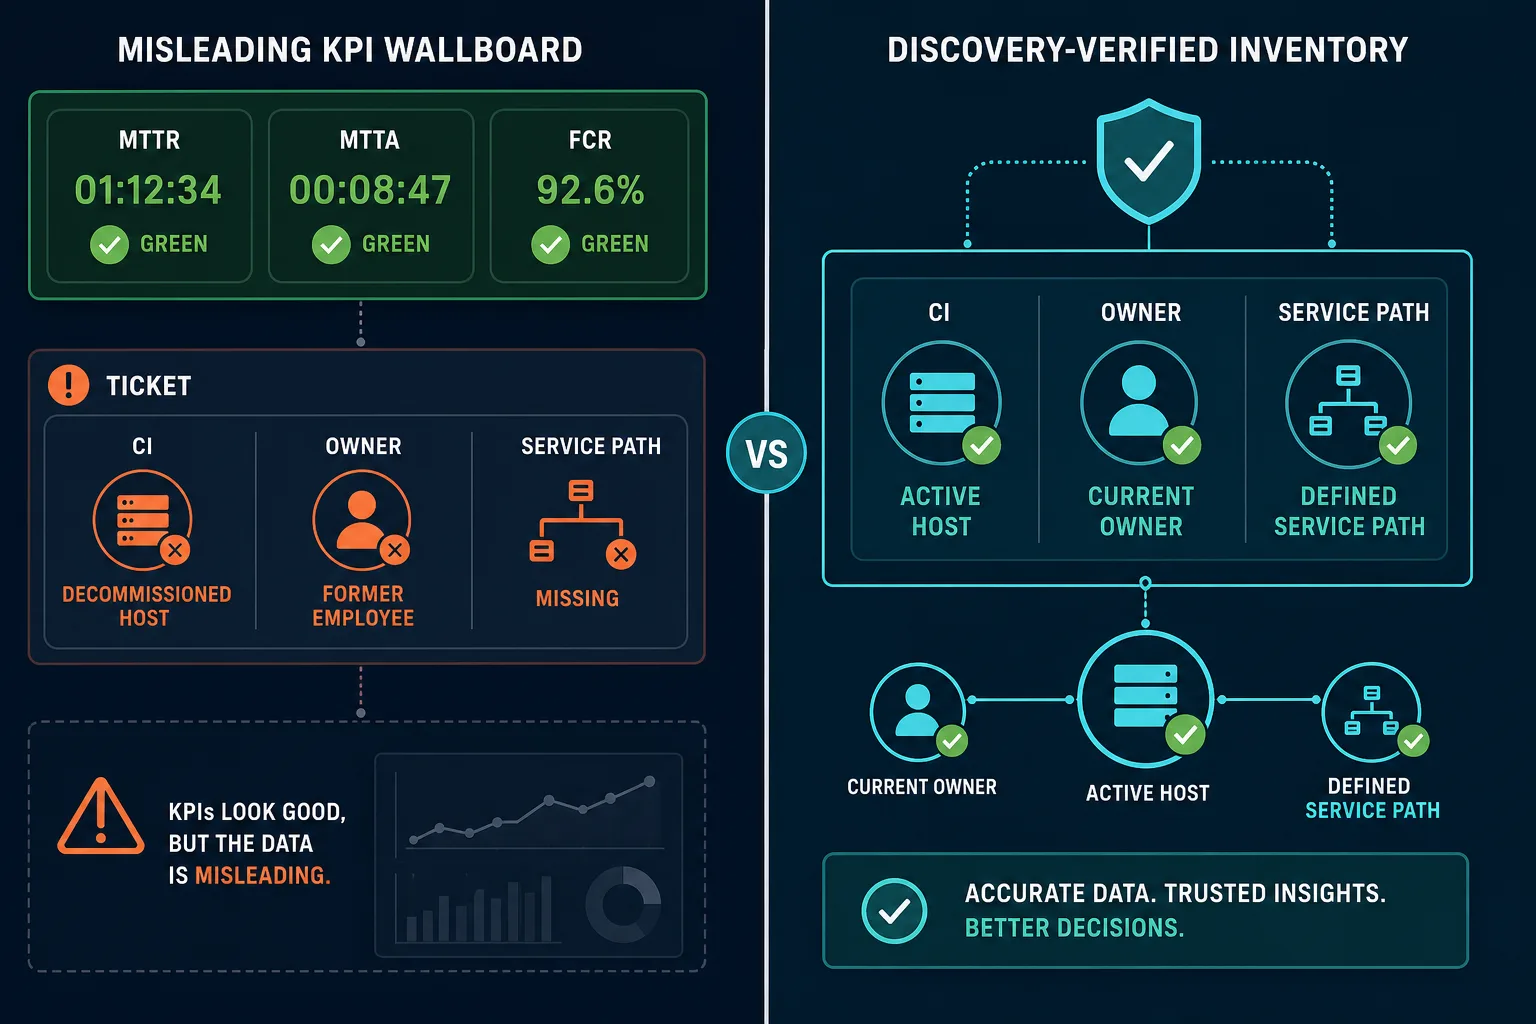
The wallboard showed mean time to restore inside the target. First response landed in four minutes. The reopen rate looked fine. The customer still waited because the ticket named a decommissioned host, the owner field pointed at someone who left last quarter, and nobody knew which payment path actually depended on the failing node.
That is the everyday failure mode of incident management KPI programs. Teams invest in formulas, SLAs, and dashboards. The numbers stay green while restoration still burns hours on inventory search. IT Ops Directors, Incident Managers, and CMDB owners running ServiceNow, Jira Service Management, or similar ITSM platforms at mid-to-large enterprises will recognize the pattern.
What incident management KPIs are supposed to measure
ITIL and common operations practice treat incident management as restore-first work. PeopleCert’s ITIL portfolio frames the practice around returning services to agreed operation. KPI libraries then translate that intent into clocks and rates.
Atlassian’s guide to common incident metrics walks through MTTR, MTTA, MTBF, and related measures. Atlassian’s KPI selection guidance stresses choosing metrics that match how the team actually works. Those definitions matter. They still assume the ticket, the CI, and the owner are trustworthy enough that the clock means something.
The core clocks operators actually track
| KPI | What it usually measures | What breaks when estate data is wrong |
|---|---|---|
| MTTA | Time from alert or ticket open to acknowledgment | Alert attaches to the wrong system or silent host |
| MTTR | Time from start of incident to restore or resolve | Clock starts after people finish hunting inventory |
| MTBF / related stability | Time between failures | Recurrence hides because wrong CI closed the last ticket |
| FCR / first-touch resolve | Share of incidents closed without reassignment | First touch works a ghost CI and still “resolves” |
| Reopen rate | Share that return after close | Close marks symptom gone while dependency remains broken |
| SLA attainment | Share meeting response or restore targets | Targets met on paper after wrong severity or wrong service |
First contact resolution (FCR) is the share of incidents an initial responder closes without escalation or reassignment — resolved-on-first-touch tickets divided by total tickets in the period. None of those formulas is wrong on a whiteboard. Each one inherits the quality of the configuration items (CIs), owners, and service paths under the ticket.
What is an incident management KPI?
An incident management KPI is a measured indicator of how well teams detect, acknowledge, restore, and close service disruptions. Common examples include MTTA, MTTR, reopen rate, first-contact resolution, and SLA attainment. The KPI only reflects reality when tickets bind to current CIs, owners, and service dependencies.
Why green KPI boards still hide long outages
Commodity articles stop at definitions and target ranges. Operators need the failure modes that make the board lie.
The clock starts after the scavenger hunt
Many shops start MTTR when a human marks “in progress,” not when the customer felt the break. Before that click, someone still pings three monitoring tools, searches a stale CMDB, and asks chat who owns the host. The incident management KPI looks strong because the official clock never counted the search.
Wrong CI, correct theater
The ticket links a CI that was renamed, moved, or retired. Work notes look thorough. The restore path still aims at the wrong machine. MTTR closes when the wrong box is “fixed” or when someone finally finds the live one outside the process.
Owner fields rot faster than on-call rotations
Escalation matrices and RACI sheets look complete. The CMDB owner field still points at a departed engineer. MTTA looks fine because someone acknowledged the page. Restore stalls while people call the wrong mobile number.
Service path missing from severity math
Severity often follows the loudest channel, not the business path. Without a discovery-backed map from CI to defined service, major incidents get treated like single-host noise and minor tickets get executive air cover by accident.
Tool sprawl multiplies false confidence
Alerts, tickets, and chat each hold a partial truth. Each tool can export a clean KPI. None of them alone proves the failing component, the dependent services, or the current owner. Related Virima work on ITOM tool sprawl and hours per incident covers the scatter. This article owns the incident management KPI layer that reports on that scatter as if it were control.
DORA’s software delivery metrics treat change fail rate and recovery measures as core delivery health. Google’s announcement of the 2024 DORA report keeps that research centered on how organizations ship and recover. Incident scorecards that ignore estate truth still report recovery that customers never felt.
How to read incident management KPIs without fooling yourself
Treat every headline metric as a claim that must survive a data audit.
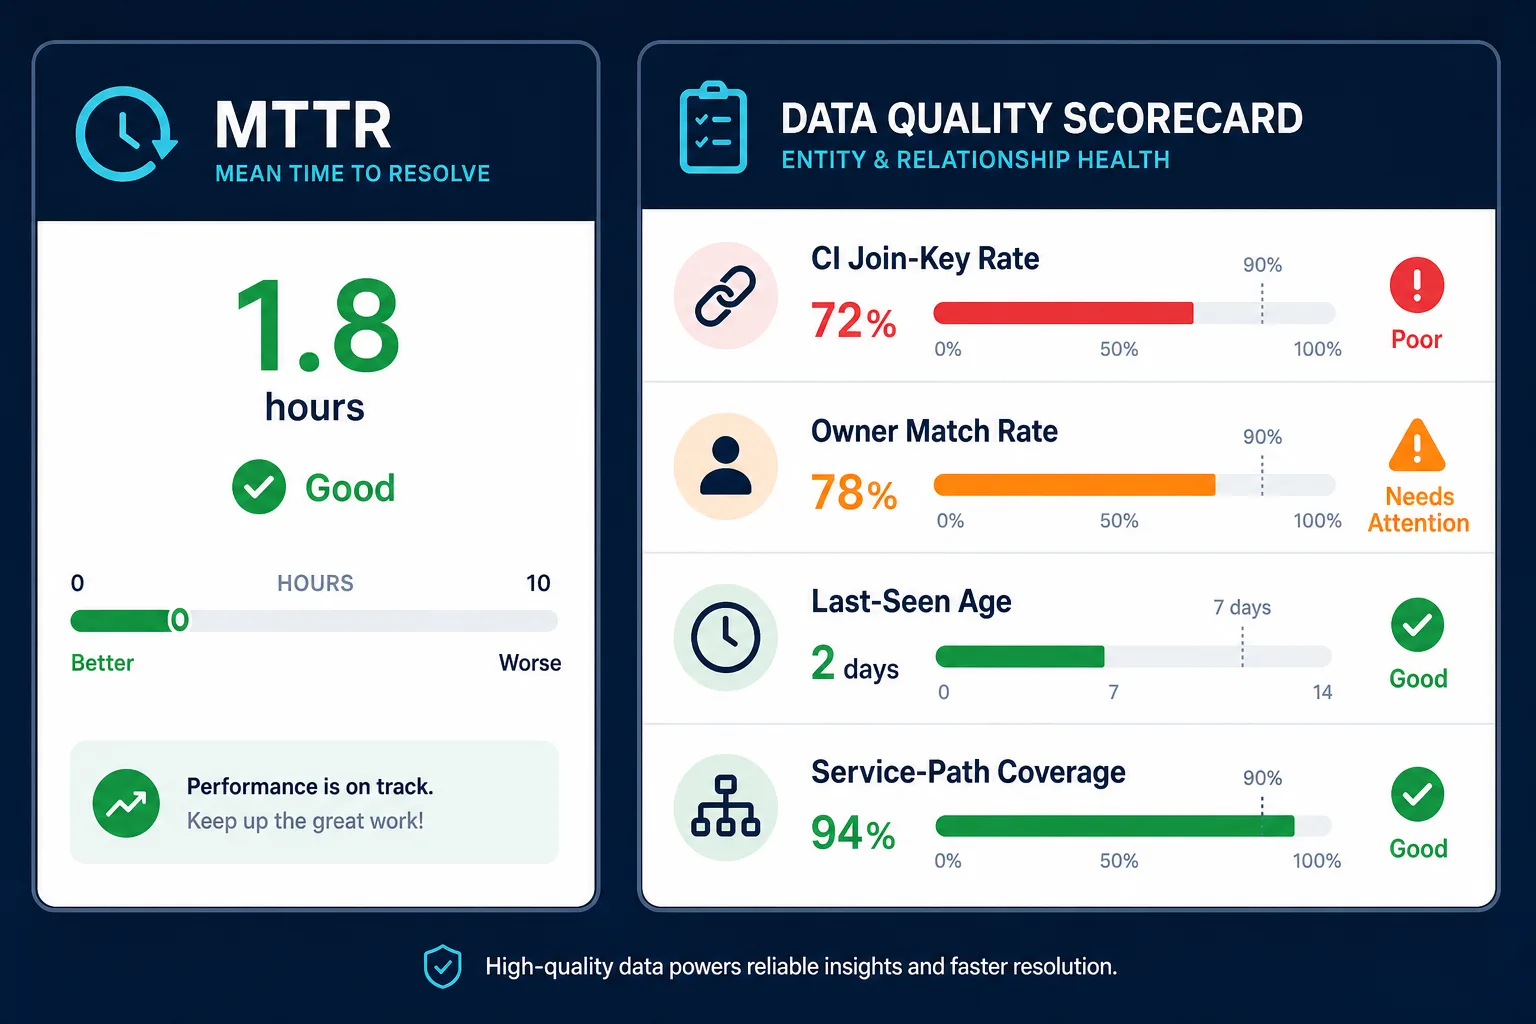
Pair every clock with an evidence check
- CI join key present and discovery-verifiable (serial, hostname, cloud resource ID).
- Last-seen age recent enough for the risk class of the service.
- Owner and backup owner that match HR and on-call.
- Service context when service definitions exist: which path the customer actually uses.
- Collision or change window note when a recent change sits on the same tier.
If those five fail, discount the KPI for that incident. Do not average it into the monthly green bar without a flag.
Separate restore theater from restore truth
A ticket can meet SLA while the customer path remains broken. Measure customer-path restore separately when maps exist. Keep ticket MTTR, but stop treating it as the only story.
Watch reopen and recurrence with the same CI key
Reopen rate only teaches when the same live CI and service path reappear. Ghost CI closes inflate success and hide repeat failures.
For the broader pattern of metrics that look healthy on bad CMDB data, see why IT metrics lie when the CMDB underneath them is wrong. For restore tactics that assume better inventory, see reducing MTTR strategies and CMDB automation and MTTR. This piece stays on the incident management KPI scorecard itself.
Why do incident management KPIs look good while outages still drag?
KPIs often start clocks after acknowledgment, bind tickets to stale CIs, and close on symptom silence rather than customer-path restore. Green MTTA and MTTR can coexist with long inventory hunts, wrong owners, and missing service dependencies. The dashboard measures process compliance more than estate truth.
What both ops and governance should require under the KPI
CISA Binding Operational Directive 23-01 (2023) pushed federal civilian agencies toward complete asset visibility on a defined cadence. Commercial incident programs that publish restore KPIs without comparable visibility inherit the same class of blind spot. Leadership that only asks for lower MTTR without asking what the ticket knew will keep buying dashboards instead of truth.
Minimum fields before you trust a monthly scorecard
- Share of P1/P2 tickets with a discovery-verified CI key.
- Median last-seen age of CIs on major incidents.
- Owner match rate against current on-call.
- Share of major incidents with service path attached when definitions exist.
- MTTR split: time-to-correct-CI identified versus time-to-restore after correct CI.
- Reopen rate keyed to the same live CI, not free-text titles only.
What Virima supplies under incident management KPIs
Virima is not an ITSM KPI product, not a paging tool, and not a full service desk suite. The lane is Trusted Runtime Truth under the incident record: what exists, how it connects, what changed, and who owns it.
High-frequency scheduled discovery with agent, agentless, and API methods refreshes presence and attributes in the CMDB. Those cycles keep the CI on the ticket from rotting between shifts. Event-driven streaming discovery remains roadmap territory rather than the current product surface.
When service definitions exist, ViVID™ service maps bind defined services to discovery-sourced edges so severity and restore talk move from memory to a path the bridge can inspect. Maps do not invent service composition. They require definitions first, then automate the dependency view on the service mapping surface.
Virima integrates with ServiceNow, Jira, Ivanti, and many more through the Virima integrations hub. Incident managers keep working in the ITSM tools they already use while discovery-sourced fields and maps feed the ticket. Use-case framing for restore work sits on incident response and MTTR. For alert-to-service correlation detail, see correlating alerts to the CI and business service.
That inventory layer is what lets an incident management KPI program stop celebrating clocks that never counted the hunt. Without it, scorecards remain theater with better fonts.
If MTTR still looks green while bridges burn the first hour finding the live CI and owner, see how discovery-sourced CMDB truth lands under the incident records you already run.
A practical checklist for the next KPI review
- Keep the standard clocks. Do not invent vanity metrics that hide restore pain.
- Publish a data-quality companion score next to MTTR and MTTA.
- Split MTTR into find-correct-CI time and restore-after-correct-CI time for major incidents.
- Reject tickets without join keys on high severity classes, or flag them out of the hero chart.
- Reconcile owners weekly against HR and on-call before the monthly ops review.
- Attach map or dependency evidence when service definitions exist for customer-facing paths.
- Review reopen clusters by CI key, not by free-text title similarity alone.
Make incident management KPIs measure restore, not paperwork
Incident management KPI programs fail when leadership treats green MTTA and MTTR as proof of control. The formulas are useful. The estate under the ticket determines whether those formulas describe customer restore or internal theater.
Keep the clocks. Raise the bar on CI keys, owners, last-seen freshness, and service context. Bind every material incident to discovery-verified inventory before you celebrate the monthly chart. That is how organizations stop winning the scorecard debate and losing the 3 a.m. bridge.
If your wallboard is green and post-incident reviews still start with who owns this host, start with the inventory and ownership layer under the ticket. Schedule a demo to see how Virima keeps incident KPIs honest after the first acknowledge.
Frequently Asked Questions
What are the most common incident management KPIs?
Common incident management KPIs include MTTA, MTTR, MTBF or related stability measures, first-contact or first-touch resolution, reopen rate, and SLA attainment for response and restore. Teams should pair each clock with CI, owner, and service-path quality checks so the number reflects customer restore.
What is a good MTTR for IT incidents?
There is no universal good MTTR. Targets depend on service criticality, architecture, and how the clock is defined. A lower MTTR that starts after a long inventory hunt can hide worse customer impact than a higher MTTR measured from true break detection with a correct CI.
How does CMDB quality affect incident management KPIs?
Stale CIs, missing relationships, and wrong owners inflate false success. Teams may acknowledge quickly, work the wrong system, and close on symptom silence. Discovery-verified CMDB data shortens find time and makes MTTR, reopen rate, and SLA charts more honest.
Should we stop tracking MTTA and MTTR?
No. Keep standard clocks, then add companion measures for CI join-key coverage, owner match, last-seen age, and service-path attachment. Split find-correct-CI time from restore-after-correct-CI time on major incidents so leadership sees where time actually goes.
Does Virima replace incident management or ITSM KPI tools?
No. Virima supplies discovery-sourced CMDB and service mapping that feed incident records in ITSM platforms. Incident process ownership, paging, and KPI dashboards stay with the tools teams already run. Virima improves the truth those KPIs sit on.
Does Virima integrate with ServiceNow, Jira, or other ITSM platforms for incident management?
Yes. Virima connects to ServiceNow, Jira Service Management, Ivanti, and other ITSM platforms through native integrations, feeding discovery-sourced CI, owner, and service-path data into existing incident records rather than replacing the incident tool itself.