Why IT Metrics Lie When the CMDB Underneath Them Is Wrong

Last quarter a regional bank’s mean time to resolve looked 18 percent better after a credential rotation broke discovery on two branch subnets. The tickets that used to land on those hosts stopped appearing because the configuration items (CIs) went dark, not because restore work got faster. Nobody rewrote the MTTR formula. The CMDB stopped feeding the denominator the same population.
Staff gaming gets the blame when IT metrics look healthier than the CMDB underneath them deserves. Closing tickets early and shrinking SLA clocks are real problems. A more common cause sits one layer down: stale CIs, orphaned assets, and duplicate records that make the calculation honest about a fictional estate. Leadership then steers from a dashboard that was wrong before the chart rendered.
An IT metric does not measure the environment. It measures whatever the CMDB says the environment is. When those diverge, every decision that trusts the number inherits the gap.
What watermelon metrics is, and what it misses
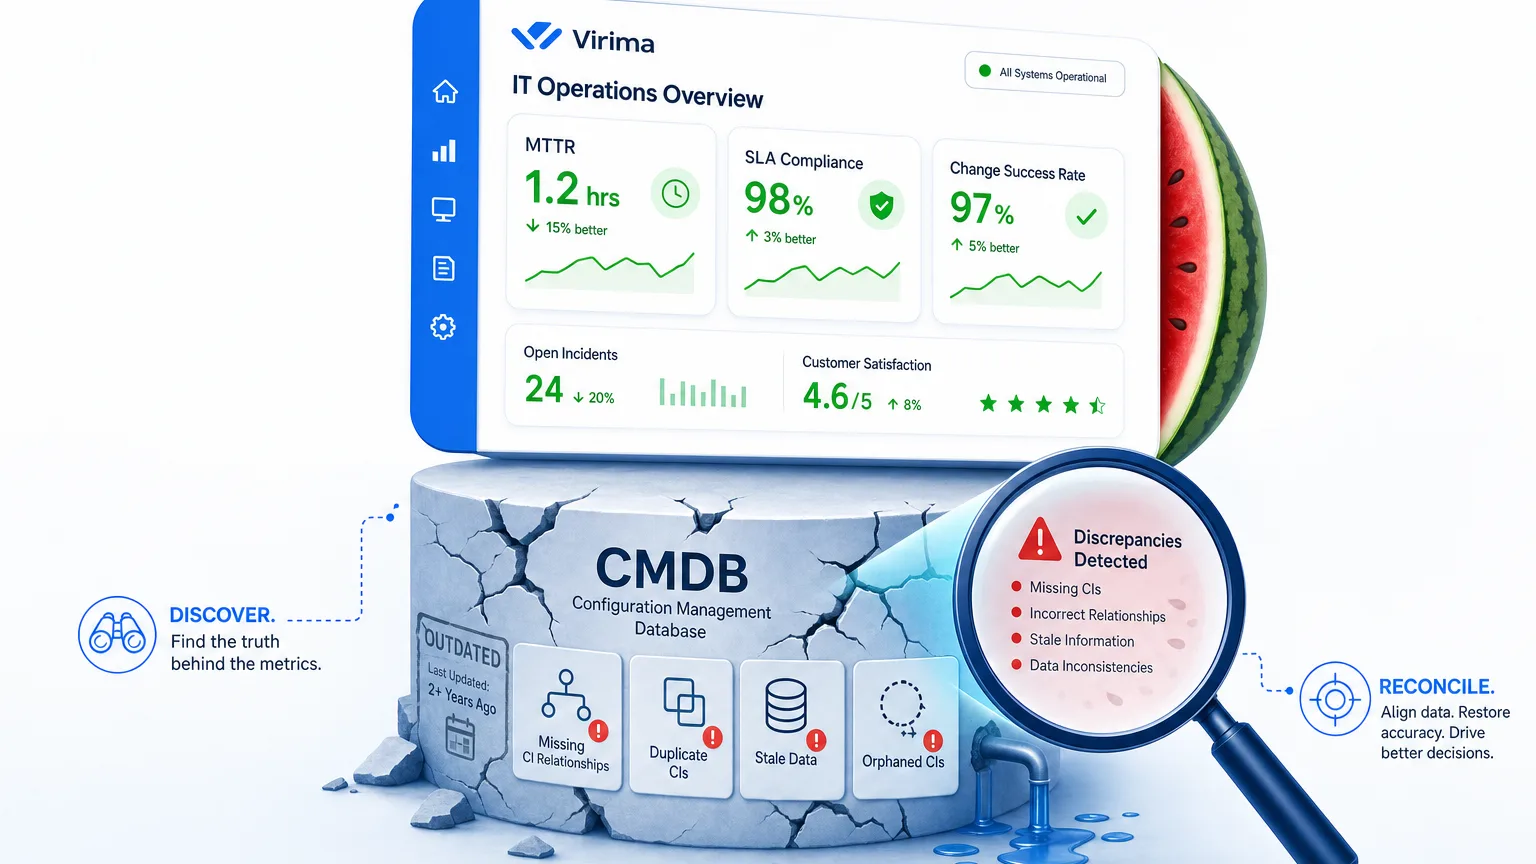
Dashboards that report green while users still feel red already have a name in ITSM circles: watermelon metrics. The rind looks healthy. The inside does not. HappySignals describes the same pattern from the service-desk side: SLA dashboards running green while the people the service desk supports stay unimpressed.
The usual story is people gaming the numbers. Agents close tickets at the first reply. Teams redefine clock starts so breaches never fire. That story is true often enough to stay in the training deck. It is also incomplete. Competing explanations for the watermelon effect stop there, at SLA design — the record set the metric counts against is the other half most miss.
A second cause needs no manipulator. The metric still runs the same formula against the wrong record set. Incident volume, change outcomes, and SLA samples only include CIs the CMDB still treats as live, owned, and in scope. When that foundation rots, the chart can improve while the estate does not.
Where the rot actually starts
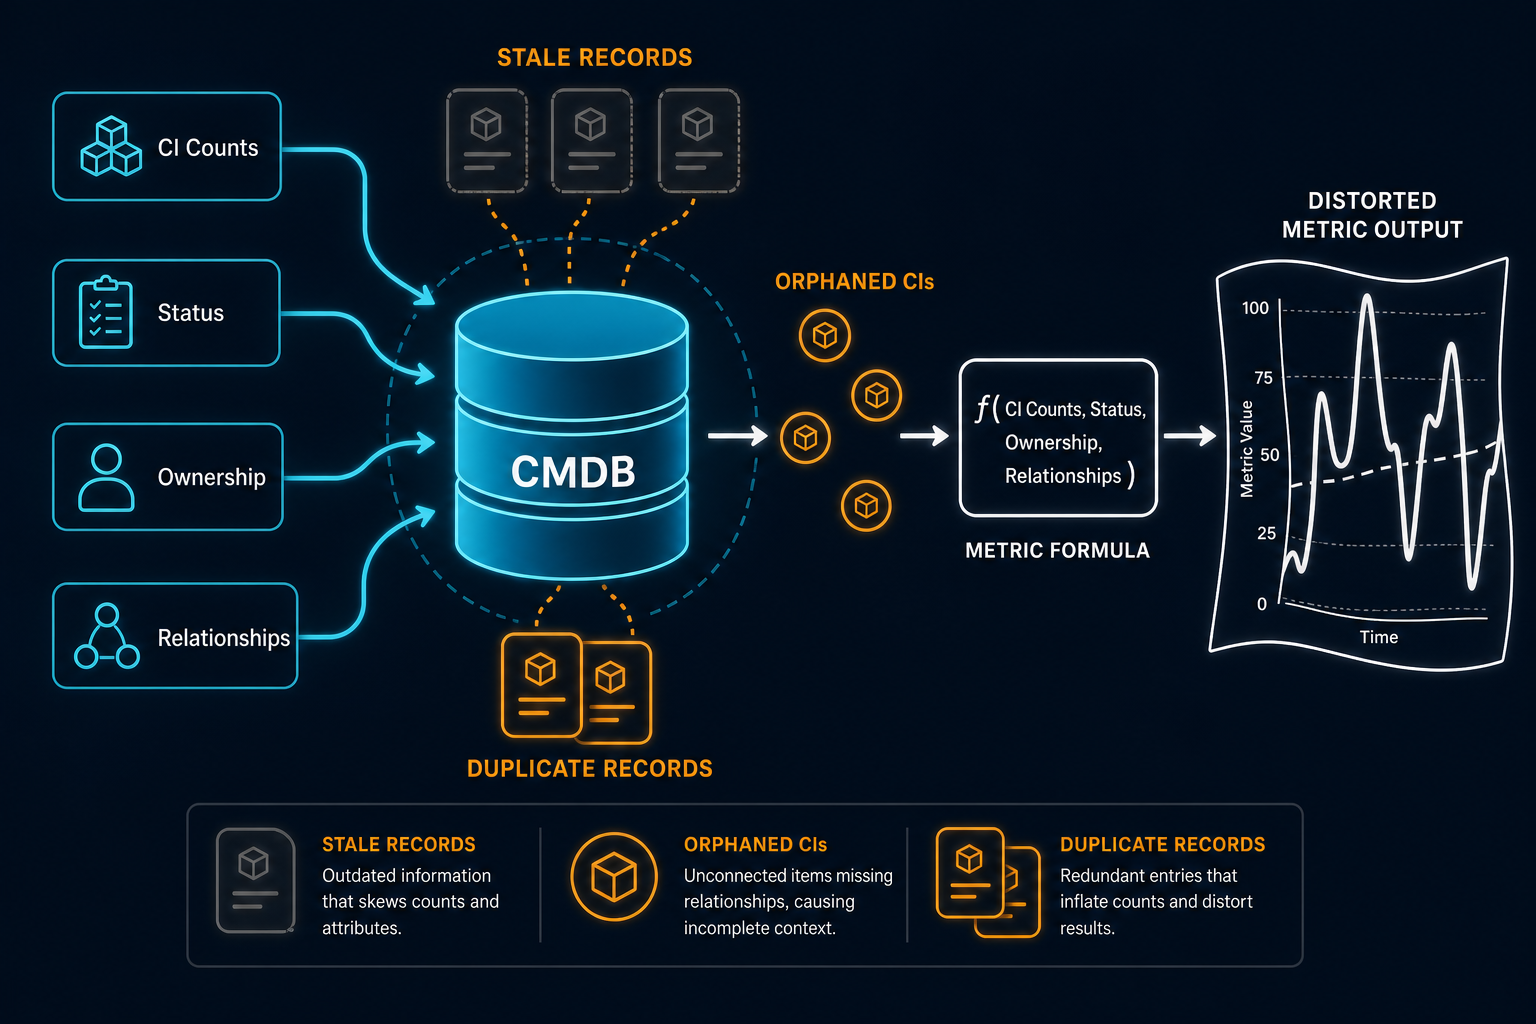
A CMDB holds which CIs exist, their status, relationships, and ownership. Almost every operational IT metric is counted against that population or those joins. Discovery feeds, imports, and manual updates keep the list honest only when they stay current.
The metric formula rarely fails in isolation. The count behind it is wrong, so the formula returns a technically correct answer to the wrong question. Three failure modes drive most of the distortion.
Stale records
A decommissioned host still marked “in production” keeps absorbing incidents and change tickets long after the rack is empty. A live host marked retired drops out of the sample the week it starts failing.
Orphaned CIs
Assets with no owner, no support group, and no service link never generate the SLA or change failure events leadership expects. Silence reads as health.
Duplicate records across systems
The same server appears twice with different serials or names. Tickets split across rows, MTTR averages flatten, and IT visibility and BI reports show two half-truths instead of one estate.
Three specific metrics this breaks
MTTR
Mean time to resolve needs a complete incident population tied to real CIs. When a missing or unmapped CI never receives the tickets it should, those long restores leave the sample. The average shortens without a single engineer working faster. That is a different mechanism from the intro’s discovery outage: here the CI never existed in the join, so the incident never entered the MTTR set at all.
Change failure rate
DORA’s software delivery metrics treat change fail rate as the share of changes that cause degraded service and need remediation. Without accurate dependency mapping, a failed change often lands as an unrelated incident on a downstream CI the change record never listed. The change stays “successful.” The failure rate improves on paper while blast radius stays invisible — exactly the blind spot ViVID™ service maps are built to close, by showing which CIs actually sit downstream of a change before that change ships.
SLA compliance
A clean violation is not raised for an orphaned or unowned asset against a named support group. Nothing tracks the clock for that row. Compliance rises because the unhealthy CI is removed from the scored set, not because restore discipline improved.
The M&A blind spot
Two companies merge. Two CMDBs stay separate for months while identity, networks, and tool contracts catch up. According to post-merger integration timeline research from Gotara, full technical integration takes 12 to 18 months for mid-sized deals, and longer for complex cross-border combinations (post-merger integration timeline research).
That is plenty of time for a temporary metrics bounce to look like a permanent improvement. Metrics on the surviving primary CMDB often improve almost immediately.
The mechanism is exclusion, not excellence. An unreconciled second environment sits outside incident volume, change failure rate, and SLA tracking for the primary tool chain. Branch offices, plants, or acquired SaaS estates never enter the sample.
The improvement is temporary. It reverses during audit sampling, a later reconciliation project, or the first major outage that spans both estates. That reversal usually lands right when leadership assumes integration is “done.”
Why do IT metrics improve right after a merger closes?
After a merger, two CMDBs often stay unreconciled for 12 to 18 months. During that window, incident, change, and SLA metrics on the surviving primary tool chain can improve immediately — not from better operations, but because the unreconciled environment sits outside the sample entirely.
If your metrics improved right after a deal closed, that’s not integration — it’s exclusion. See how Virima’s CMDB brings both estates into one reconciled record before the next board pack instead of after the next outage.
What executive dashboards miss
Leadership views inherit the same CI foundation as the operational metrics underneath. Cleaner layout and sharper sparklines do not repair missing joins.
Two scores depend entirely on current CMDB data to mean anything: CI health score and impact exposure. CI health collapses when status, ownership, and last-seen facts drift. Impact exposure collapses when relationship maps are thin or wrong. A confident executive tile can still rest on both failures at once.
Dashboard design quality and underlying data quality are separate problems. Fixing the first never proves the second.
Why do IT metrics improve when the CMDB is wrong?
Metrics count only the CIs the CMDB still treats as live, owned, and in scope. Stale, orphaned, or duplicate records shrink or split that population, so averages and compliance rates can look better while the real estate stays the same or gets worse.
How to check if your own metrics are lying
Ask these this week. A deeper walkthrough of checking CMDB accuracy covers the same ground in more depth. Treat them as diagnostics, not accusations.
- Does the CMDB CI count roughly match a recent independent discovery scan of the same scope?
- Can resolved incidents from last quarter trace to a specific, currently active CI?
- Do change failure records show a dependency chain, or do they dead-end as an unrelated incident?
- After any acquisition or reorg in the last 12 months, is there one reconciled CMDB or two running in parallel?
- Would an auditor sampling CIs for IT audit success find owners, status, and last-seen facts that match the live estate?
If two or more answers fail, the dashboard is reporting CMDB fiction more than operations performance.
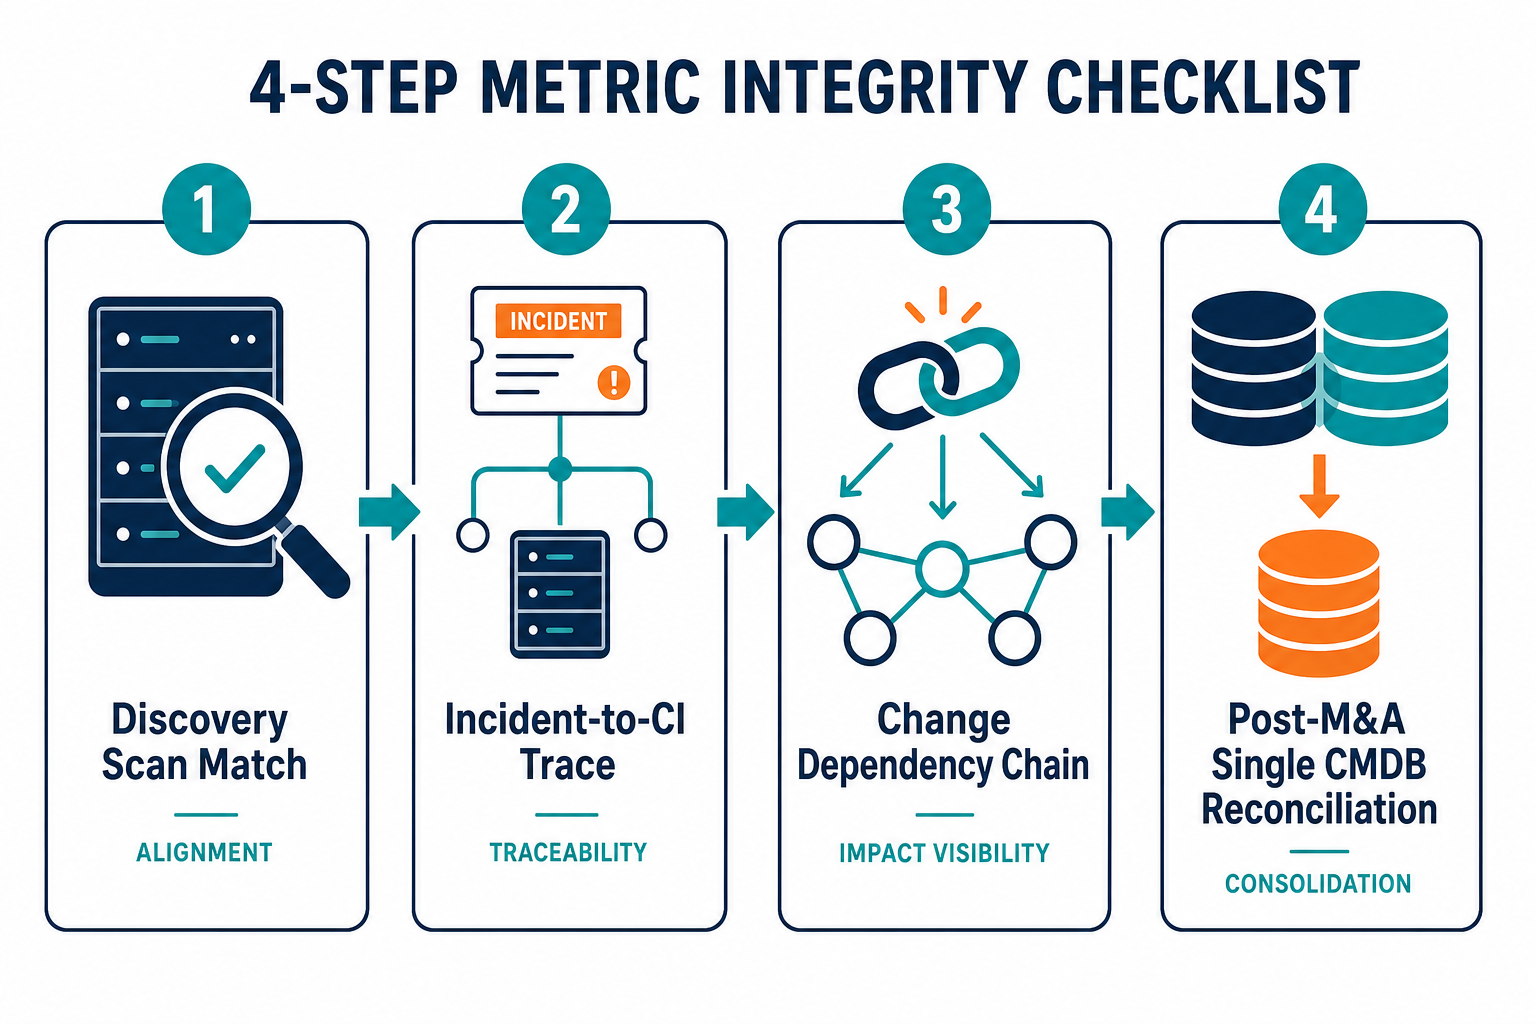
How can leaders test whether IT metrics reflect the real estate?
Compare CMDB CI counts to an independent discovery scan, trace recent incidents to active CIs, inspect whether change failures show dependency chains, and confirm post-merger environments sit in one reconciled CMDB. Gaps in those checks mean the metric sample is incomplete.
What actually fixes this
The structural fix is high-frequency, discovery-driven CMDB reconciliation, not a dashboard redesign and not a once-a-year manual sweep. Scheduled discovery cycles catch stale, duplicate, and orphaned records before they distort MTTR, change failure rate, and SLA samples. Manual audits still matter for process, yet they cannot keep pace with hybrid estates that change every week.
A better-looking chart on the same bad CI set is still a lie, only a prettier one. When partial inventories still drive board packs, start with Trusted Runtime Truth and pressure-test whether serial, owner, relationship, and last-seen facts still come from discovery after the last cleanup project ends.
Virima supplies the discovery and CMDB layer that keeps those CI facts current and feeds ITSM platforms teams already run. It reaches ServiceNow, Jira, Ivanti, and many more through one hub at all integrations. Pair that estate truth with ITAM reporting so KPI dashboards read the same population operations actually supports. Virima does not replace your ITSM metric definitions. It keeps the CI record those definitions count against honest.
What fixes IT metrics that look better than the estate?
High-frequency discovery-driven CMDB reconciliation so stale, orphaned, and duplicate CIs leave the sample before MTTR, change failure rate, and SLA formulas run. Dashboard redesign alone leaves the same bad population underneath the chart.
Stop steering from a number the CMDB invented
Treat every green tile as a claim about CI completeness, not only about team speed. Run the four checks above on a fixed cadence. Reconcile M&A and reorg estates before you celebrate the post-deal metric bounce. Refresh existence and relationships with discovery on a schedule so the formula finally answers the question leadership thinks it asked.
Turn the checks above into a repeatable audit before your next board pack. Ready to see it run against your own estate? Request a demo to see how publisher, serial, relationship, and last-seen truth stay current enough for the first board pack after the next change freeze.
Frequently Asked Questions
Are watermelon metrics always caused by staff gaming the numbers?
No. Gaming is one cause. A second cause is CMDB data quality: stale, orphaned, or duplicate CIs that change the population the metric counts without anyone touching the formula.
What role does a CI health score play when metrics are misleading?
It does not rewrite MTTR or SLA math by itself. It exposes whether status, ownership, and currency underneath those metrics deserve trust before leaders act on the chart.
Why do IT metrics often improve right after an acquisition?
An unreconciled second environment often sits outside the primary CMDB sample, so incident, change, and SLA counts shrink without integration work being finished.
How does Virima’s discovery frequency compare to manual CMDB audits for keeping metrics accurate?
High-frequency, discovery-driven reconciliation from Virima catches stale, duplicate, and orphaned records before they distort the CI population behind MTTR, change failure rate, and SLA compliance. Manual annual audits can’t keep pace with hybrid estates that change every week.
Does Virima’s CI health score fix metrics that already look wrong?
Not by itself. Comparing CMDB counts to a discovery scan, tracing incidents to active CIs, and inspecting change failure dependency chains against Virima’s discovery-driven CMDB exposes whether the record set underneath deserves trust — that diagnostic has to happen before redesigning the dashboard.