ITOM Tool Sprawl Is Costing Hybrid Teams Hours Per Incident

At 11:32 UTC on November 18, 2025, Cloudflare’s monitoring systems started surfacing errors- not one error, but five. The core CDN and security layer showed 5xx responses. Workers KV appeared degraded. Turnstile looked like a separate failure. The Dashboard and Access authentication each showed distinct symptoms of their own.
The team spent 93 minutes investigating what initially looked like a Workers KV degradation before tracing everything back to its actual root cause. A database permissions change caused Cloudflare’s Bot Management system to generate an oversized configuration file, which crashed the core proxy. A coincidental, unrelated outage of Cloudflare’s independently hosted status page reinforced an early hypothesis that a DDoS attack was underway. Cloudflare’s own engineering postmortem documents the full sequence.
Cloudflare’s account doesn’t blame monitoring tool sprawl. The honest read is more instructive: one root cause, surfacing through multiple systems, took 93 minutes to diagnose because nothing tied the symptoms to a single shared picture. That’s ITOM tool sprawl in its purest form: not too few tools, but no shared record connecting what they each see.
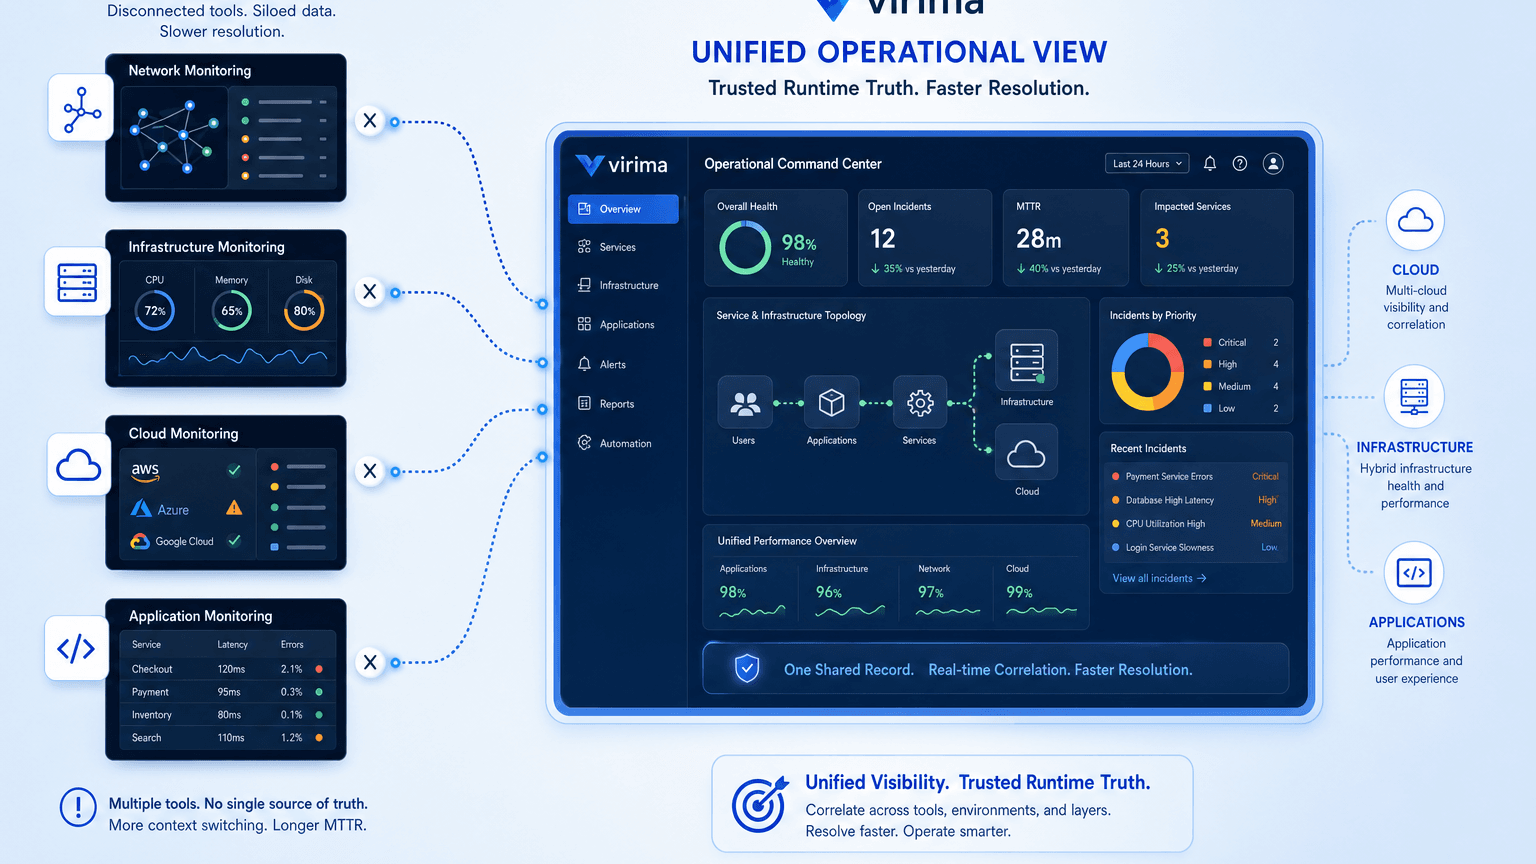
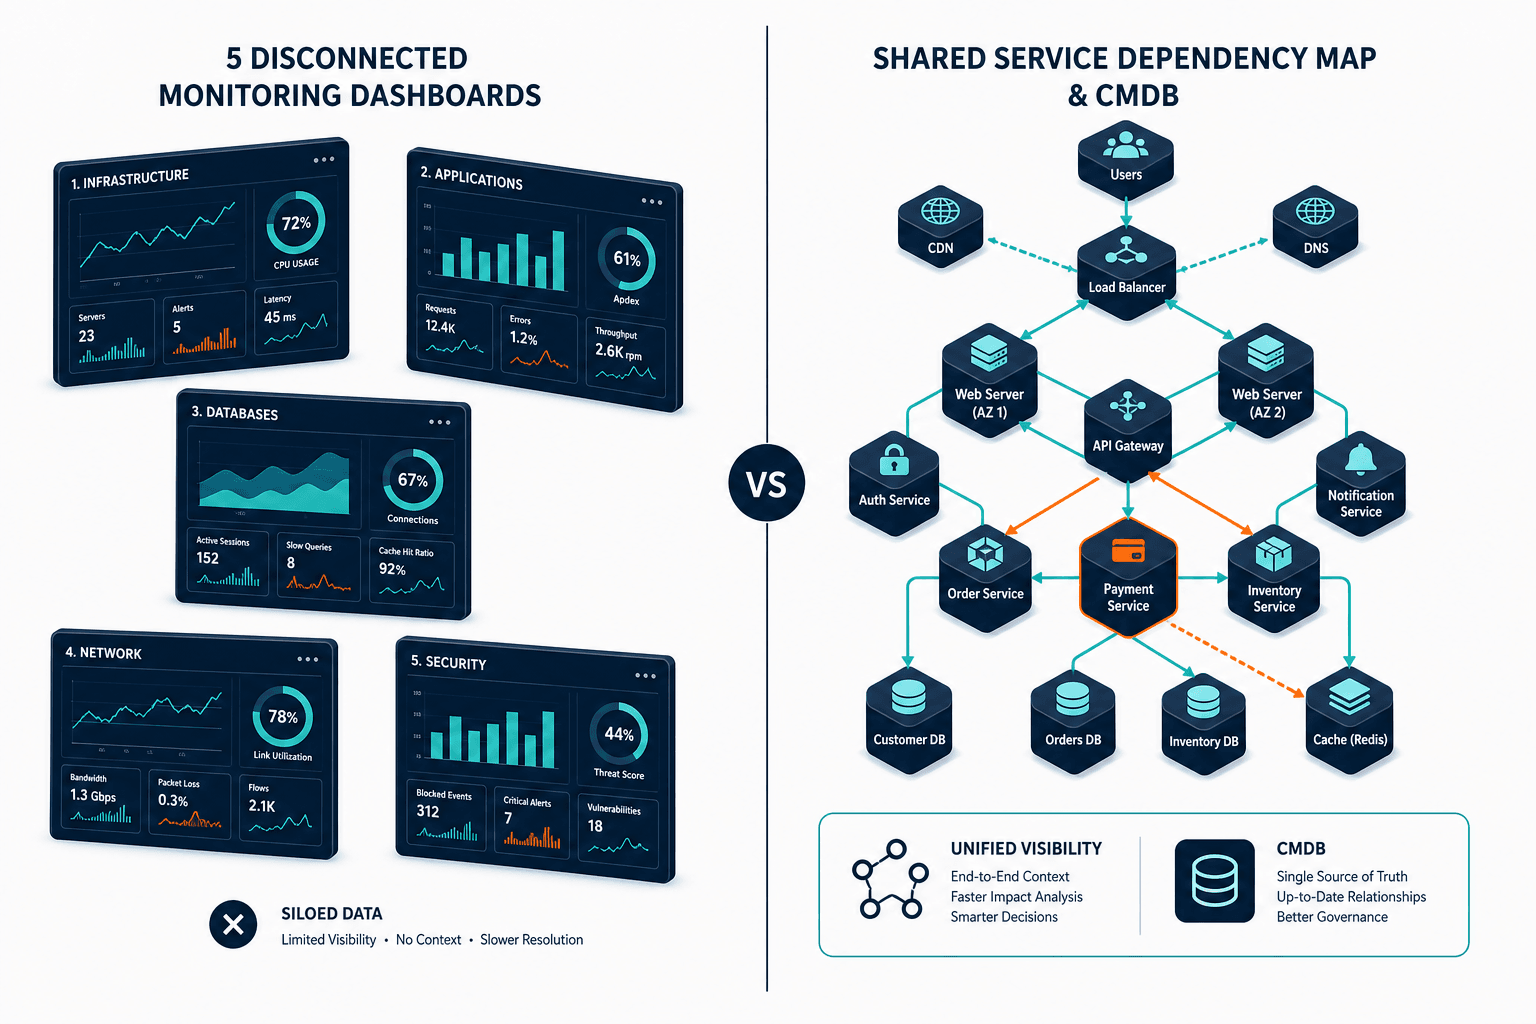
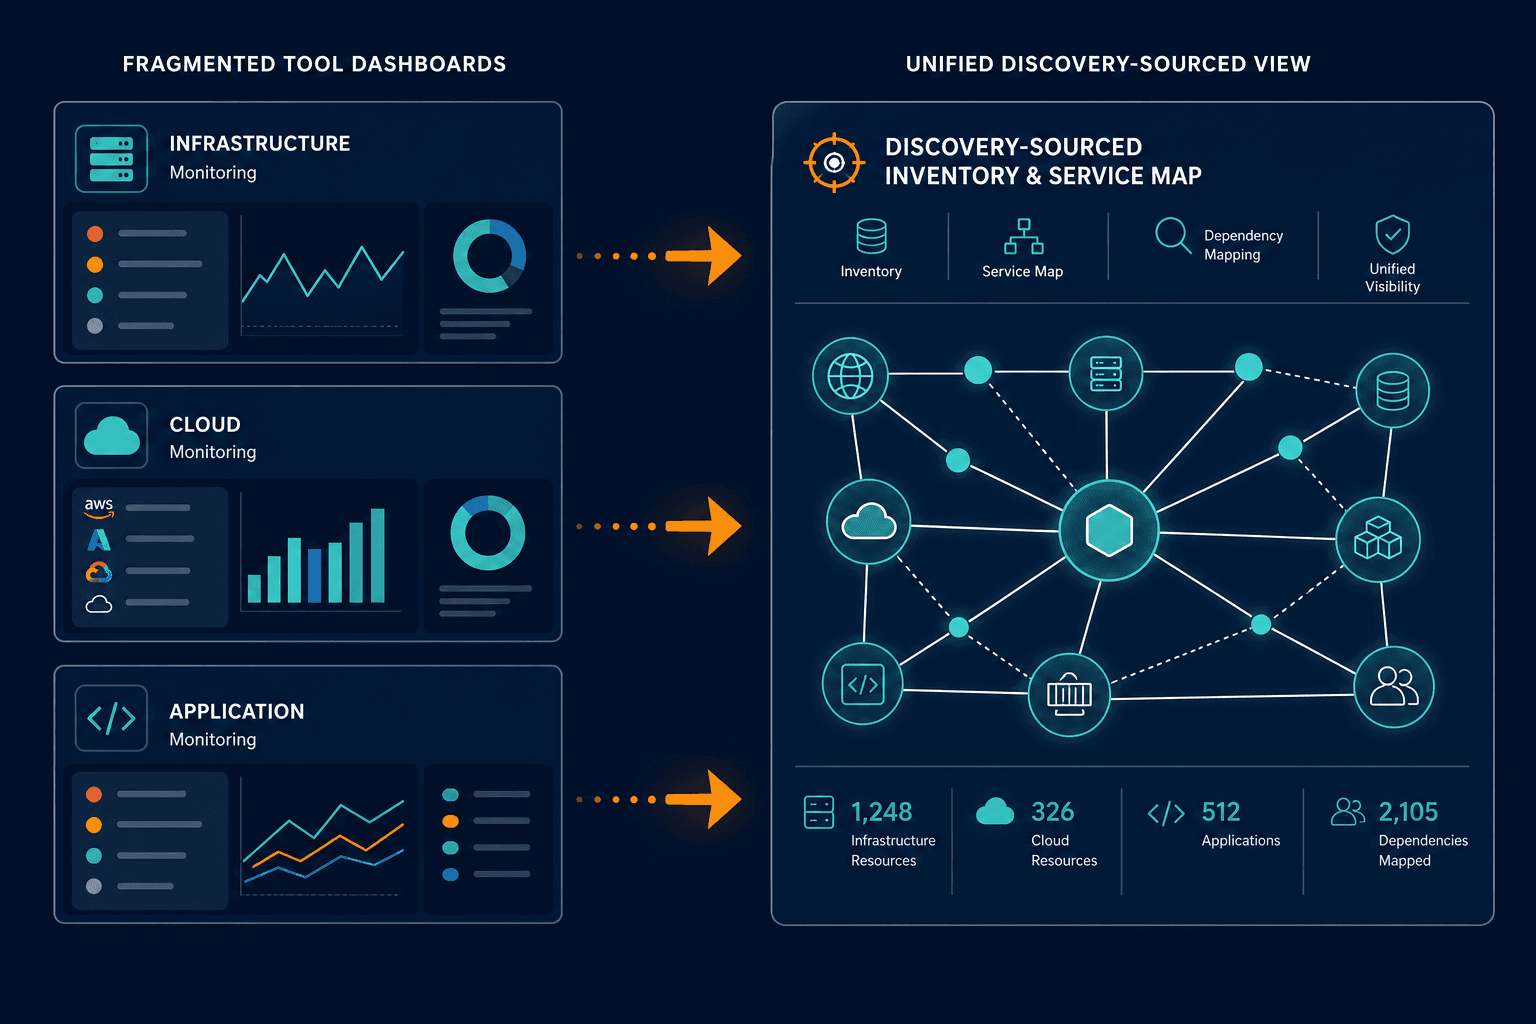
That same mechanism runs at smaller scale in most hybrid IT estates today. One root cause. Five dashboards. Manual correlation. The infrastructure team checks one console, and the cloud team checks another. The application team checks a third. Each tool is accurate about its own slice. None shows the full path from symptom to cause.
Adding a sixth tool does not help, and removing one does not either.
What “ITOM” covers, and why the definition is fuzzy
Neither Gartner nor ITIL has ever settled on a single, clean definition of ITOM. Stating that plainly is a credibility signal, not a weakness. Papering over the ambiguity leads to inflated expectations on both sides.
How ITIL and Gartner define ITOM
ITIL v3/2011’s Service Operation book defines IT operations management as “the function responsible for the ongoing management and maintenance of an organization’s IT infrastructure to ensure delivery of the agreed level of IT services to the business.” Gartner’s Glossary frames it as “all the tools needed to manage the provisioning, capacity, performance, and availability of computing, networking, and application resources, as well as the overall quality, efficiency, and experience of their delivery.” Both definitions land on the same practical scope: keep the infrastructure running so the services on top can run too.
ITSM analyst Stephen Mann’s ITOM Explained primer quotes both accurately. Virima’s own What is ITOM primer covers the broader term in more depth for readers who want the full background.
In practice, that scope covers servers, networks, cloud resources, storage, and every service layer built on top. It’s also the scope where Virima’s ITOM capabilities operate: discovery, dependency mapping, and operational visibility tied to a shared record of what actually exists.
Why the fuzzy definition enables tool sprawl
The definitional fuzziness matters because it explains how tool sprawl happens. When no one agrees on what ITOM covers, each team draws its own boundary. Infrastructure monitoring goes to one platform. Cloud monitoring goes to another. Application performance gets its own tool. Each decision was reasonable in isolation. None was made with a shared picture in mind.
The fix lives in a concept Virima calls Trusted Runtime Truth: a live, governed, discovery-sourced view of what exists, how it’s connected, and what changes mean for the services running on top. That shared context is what five accurate-but-siloed tools are missing.
Why does ITOM tool sprawl happen in hybrid IT estates?
Tool sprawl happens when infrastructure, cloud, and application monitoring are added at different times by different teams with no shared inventory underneath. Each tool is accurate about its own slice. Without a common record to reference, none of them can agree on what’s connected or what’s at risk.
| Situation | What Happens |
|---|---|
| Infrastructure, cloud, and application monitoring each run separately | Each tool is accurate about its own slice and blind to the others |
| A change or failure touches more than one layer | No single view shows the full path from symptom to cause |
| Teams add a new tool to close a specific blind spot | The blind spot closes, but the correlation problem doesn’t |
Why hybrid estates still don’t have one health view in 2026
The problem is not new, but attributing it to any single cause or fix has become harder.
SolarWinds surveyed 750 IT professionals for its 2026 State of Monitoring and Observability Report. Seventy-seven percent reported limited hybrid estate visibility across on-premises and cloud environments. Seventy-five percent cited cross-team coordination gaps as a meaningful obstacle. Fifty-five percent said they were running too many monitoring or observability tools, with no clean way to reconcile what each one showed.
Those numbers describe a coordination problem, not a procurement problem. Cutting one tool or adding another doesn’t close that gap without something tying the outputs together.
Three patterns explain how most estates arrive at this position:
1. Infrastructure, cloud, and application monitoring each get added at different times, by different teams, for different reasons. Nobody owns reconciling them after the fact, so nobody does. Each team trusts its own dashboard and treats the others as someone else’s responsibility.
2. A tool gets added to fix a specific blind spot. The blind spot closes, but the correlation problem does not, so there is now one more dashboard to check when something goes wrong.
3. AI-ops tooling gets adopted with monitoring tool consolidation as the goal. Per Gartner’s own 2026 Hype Cycle for AI in IT Operations, reported by The Register in July 2026, consolidation is a near-term promise, not a near-term reality. Gartner predicts more specialized tools will appear before fewer do.
The result across all three patterns is the same: accurate data in five places, with no reliable way to see it as one picture.
The real cost of ITOM tool sprawl
The cost for ops teams
The cost shows up as time lost per incident. Every cross-system failure starts with the same manual step: re-establish what’s actually connected to what, across tools that don’t share that information. That work doesn’t appear in any incident ticket as a separate line item, but it can add well over 30 extra minutes to mean time to resolution on any incident that touches more than one system — a direct consequence of the reconciliation step SolarWinds’ 55% figure points to, not a separately sourced benchmark.
The cost for IT leadership
Flexera’s 2025 State of ITAM Report documented a directional trend worth framing carefully. Complete tech-stack visibility fell to 43%, down from 47% year over year. One year of decline doesn’t prove a permanent trajectory. It does suggest that the gap between the tools teams run and the visibility those tools actually produce has widened rather than narrowed. For IT leadership making infrastructure investment decisions, that gap translates directly into incomplete evidence.
The cost for audit and compliance
The cost is an inability to produce a consistent record when it matters. A compliance audit asking for a point-in-time picture of what existed, who owned it, and when it changed shouldn’t require manually reconciling five dashboards. Fragmented reporting and auditing across disconnected tools produce five technically accurate but mutually inconsistent answers, none of which satisfies an auditor expecting one.
All three costs share a root cause: the monitoring and observability data exists, but no shared inventory ties it together.
What is the operational cost of ITOM tool sprawl in a hybrid environment?
The primary cost is time: extra minutes per incident spent manually correlating what each tool shows before diagnosis can begin. Secondary costs include incomplete audit records, inconsistent ownership data, and limited visibility for infrastructure investment decisions. All three trace back to the same missing layer: a shared inventory every tool maps back to.
What closes the gap between tools
The fix isn’t fewer tools. Virima’s own documentation states it plainly: Virima doesn’t require replacing current monitoring or ITSM platforms. The more accurate and more defensible claim is narrower: discovery-sourced CMDB and service mapping give the tools already in place a shared record to point back to. Unlike ServiceNow Discovery or Device42, that shared record comes without the platform bloat or migration cost of a full platform swap, which matters most for IT Operations Managers and Configuration Managers who need this working alongside a hybrid estate they can’t rebuild from scratch.
Three mechanisms make that work:
1. Discovery builds one current inventory
High-frequency scheduled discovery scans the environment and writes what it finds into a structured record: what exists, where it runs, and what it’s connected to. That record is the same one every downstream tool can reference. It doesn’t replace what those tools do; it gives them something to agree on when their outputs diverge. Virima’s IT discovery capabilities use agent-based, agentless, and API-based methods across on-premises, VMware, and cloud environments.
2. The CMDB holds the shared relationship data
Discovery alone produces an inventory list. A CMDB structures that inventory into configuration items with attributes, owners, and relationships. When an infrastructure monitoring alert fires, the CMDB provides context the alert alone can’t: which other systems depend on the affected CI, which business services sit above it, and who owns each layer. That context is the difference between knowing something is broken and knowing what else is at risk.
3. The service map is the correlation layer
Service mapping ties CIs to the business services they support. A performance anomaly detected by an application monitoring tool can be traced back through the service map to the infrastructure CI that’s actually degraded. A separate infrastructure monitoring tool may already be watching that same CI without either tool knowing it. The configuration management use case names the core problem this solves: siloed tools and fragmented processes that make cross-system correlation manual by default. Service mapping makes it structural.
Does fixing ITOM tool sprawl require replacing existing monitoring tools?
No. A discovery-sourced CMDB and service map give existing monitoring tools a shared record to point back to. Tool count stays the same while each tool’s output maps to the same current inventory and dependency picture, so cross-system correlation becomes structural rather than manual.
| Fragmented (tools alone) | Correlated (shared CMDB and service map underneath) | |
|---|---|---|
| What each tool sees | Its own slice, accurately | Its own slice, plus the shared inventory it maps to |
| Diagnosing a cross-system issue | Manual correlation, tool by tool | One dependency map ties the affected systems together |
| Tool count | Unchanged | Unchanged |
How this looks across a real hybrid estate
The scenario below is illustrative. It describes the mechanism, not a specific deployment.
A billing dashboard shows a cloud spend anomaly. The figure is real, but the dashboard can’t explain what changed to cause it. A configuration monitoring tool shows a change event from two days earlier, without linking to the billing data. A shared CMDB with discovery-sourced CI relationships connects the two: a misconfigured virtual machine autoscale rule, mapped to the affected cloud service, mapped in turn to the business service that owns that workload. The billing team and the infrastructure team are looking at the same event in minutes rather than days.
The same structural shift applies at 2 AM when an on-call engineer is covering someone else’s stack. The incident response and MTTR use case describes that starting point directly: a service map lets the engineer identify affected dependencies and escalate with a clear blast radius picture, without needing prior tribal knowledge of which five consoles to check first.
What closing the gap looks like in practice
Shared context doesn’t replace what monitoring and ITSM platforms already do — it sits underneath them. During an incident, there’s one dependency map to check rather than five dashboards to reconcile, with the relevant CIs already linked to the business services they support, so blast radius is visible before the investigation fan-out starts. Over time, the shared inventory stays current through high-frequency scheduled discovery rather than eroding between manual audit cycles, so when a change is made, the next discovery cycle captures what actually changed rather than only what was intended.
Virima integrates with the ITSM and monitoring platforms IT teams already run — ServiceNow, Ivanti, Jira Service Management, HaloITSM, Hornbill, Xurrent, and others. None of those platforms get displaced. The CMDB and service map become the shared record they all reference, rather than one more tool contributing its own separate version of the inventory. For a detailed look at how the two disciplines interact, the ITOM and ITSM post covers where the boundaries sit and what each discipline owns.
The ViVID™ service mapping layer is where this becomes visible: a dependency map that ties configuration items to services, services to owners, and changes to the blast radius they carry.
Moving from fragmented monitoring to a shared operational view
| Old approach | New approach |
|---|---|
| Each tool’s dashboard is its own island | Every tool’s output maps back to the same discovery-sourced inventory |
| Cross-system incidents get diagnosed by manual correlation | A shared dependency map ties the affected systems together from the start |
| Tribal knowledge determines which console to check first | A structural starting point any engineer on the team can use |
ITOM governance with automated discovery describes the underlying logic: structured discovery feeding a CMDB, feeding a service map, providing the operational context that makes every other tool more useful without displacing any of it.
Five practical steps to move from fragmented monitoring toward a shared operational health view:
- Pick one business-critical service that currently spans more than one monitoring tool.
- Confirm its current dependencies against discovery data, not against tribal knowledge of the stack.
- Document ownership once, tied to the shared record rather than stored in someone’s head.
- Bring that single mapped service into the next incident review as a working pilot.
- Expand once the team has used the shared view during a real incident, not before.
That last step matters, and a shared operational view is only as useful as the first incident it has to survive.
Turn shared context into your next incident outcome
ITOM tool sprawl costs hybrid teams hours when five accurate tools still disagree on inventory, ownership, and blast radius. Fewer consoles alone do not fix that. A discovery-sourced inventory, CMDB relationships, and a service map give every monitoring and ITSM tool the same current picture, so correlation stops living in tribal knowledge.
Virima is built for that layer: high-frequency scheduled discovery across on-premises, VMware, and cloud, a governed CMDB, and ViVID™ service mapping that sits under the stack you already run. Start with one business-critical service, prove the shared view on a real incident, then expand. If you want that picture against your own estate, schedule a free trial or demo and walk the dependency path with the team that owns the next change window.
See how discovery-sourced inventory and service maps turn ITOM tool sprawl into one operational health view without replacing the monitoring tools you already trust. Schedule a demo with our team to learn more.
Frequently Asked Questions
What is ITOM tool sprawl?
ITOM tool sprawl happens when infrastructure, cloud, and application monitoring run through separate platforms with no shared context underneath. Each tool sees its own slice accurately, but none shows how a problem in one system reaches the services running on top. The result is accurate data in multiple places and no reliable way to correlate it.
How is ITOM different from ITSM?
The ITOM vs ITSM distinction comes down to scope: ITOM keeps the infrastructure itself running — servers, networks, cloud resources, and the services they support. ITSM manages how IT delivers and improves services to the business, often using ITIL practices. The two disciplines overlap and depend on the same underlying inventory data, which is why a shared CMDB benefits both.
Does adopting Virima require replacing our existing monitoring tools?
No. Virima’s discovery-sourced CMDB and service map give existing tools a shared record to point back to. Tool count stays the same while each tool’s output maps to the same current inventory and dependency picture, so five dashboards can agree on what is actually connected without anyone replacing what they already run.
What is the fastest way to reduce blind spots in a hybrid IT estate?
Start with one business-critical service. Confirm its current dependencies against discovery data instead of against separate dashboards, document ownership once, and use that single mapped service as the template for the next incident review. Expand once the team has tested the shared view under real conditions.
How does Virima’s CMDB correlate data across ServiceNow, Jira Service Management, and other ITSM platforms?
A discovery-sourced CMDB and service map sit underneath whatever ITSM and monitoring tools a team runs. Each tool’s alerts and tickets link back to the same dependency data, keeping the health picture consistent no matter which dashboard is open. No existing platform gets displaced — each one gets a shared inventory to reference.