Visio/LeanIX vs. Discovery-Built Maps | Virima

When a change breaks a customer-facing service, the bridge call opens with one question. Which business services does this change touch? The answer usually comes from a diagram, and that diagram often carries a last-edited date from months ago.
Service Delivery and IT Ops managers own the outcome of that moment. You run the change calendar, the major incident process, and the service level report. You do not own the accuracy of the drawings those processes depend on.
This evaluation compares two ways to maintain dependency documentation. One relies on manual Visio and LeanIX records. The other builds maps from discovery data. Six criteria let you score both against your own estate.
What manual Visio and LeanIX documentation does well
Hand-built documentation earns its place. A Visio diagram — Microsoft’s diagramming tool — captures design intent that no scanner can infer. An architect draws the failover path because that is how the system should behave.
LeanIX serves a different purpose. It records applications, owners, lifecycle stages, and business capabilities. Enterprise architecture teams use it to decide what to retire, replace, or fund.
Both tools answer the question of what the team planned. Trouble starts when teams use them to answer what is running right now.

Where manual documentation breaks for service delivery
A diagram records one person’s view on one date. Infrastructure changes faster than any editing process can follow. Every migration, patch cycle, and capacity change widens the gap between the drawing and the estate.
Uptime Institute reported that IT and networking issues made up 23% of impactful outages in 2024. It linked the rise to growing IT and network complexity, which leads to change management and misconfiguration problems. Those are the failures that stale dependency records make harder to prevent.
Four failure patterns appear most often in service delivery work.
- Diagrams have no refresh trigger, so nothing forces an update when a server is rebuilt or a database moves. The change ticket rarely lists the diagram as a deliverable. A closer look at this pattern is in Virima’s breakdown of why CMDB data goes stale again within weeks of cleanup.
- Coverage follows effort, so teams document the services leadership watches. Smaller internal services, batch jobs, and shared middleware stay undrawn, and those often surprise you during an outage.
- Ownership drifts when the engineer who built a diagram changes teams. The file stays on a shared drive with no named maintainer.
- Records cannot be joined to reality when they carry only hostnames. Hostnames get reused and renamed, while a serial number or cloud instance ID identifies the actual machine.
The results appear in your metrics. Change impact assessments miss dependent services. Incident triage starts with a hunt for the right diagram. Post-incident reviews list out-of-date documentation as a contributing factor, again.
How discovery-built dependency maps work
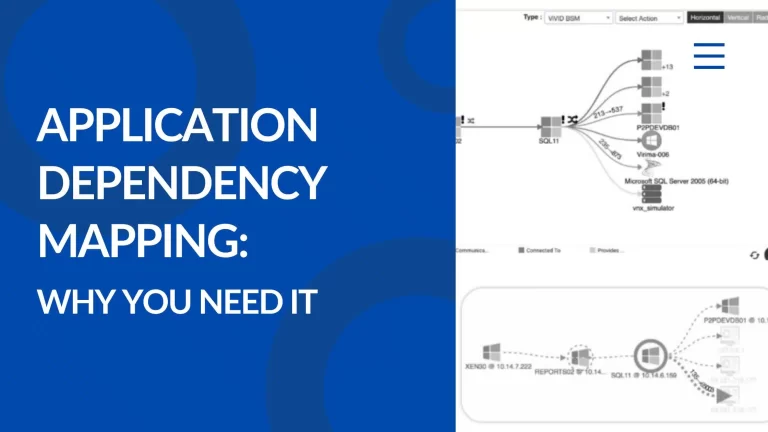
A discovery-built map starts from the estate instead of from a drawing. Discovery scans servers, network devices, virtual machines, and cloud resources. It records what each one runs and how it relates to the others. That stream of host and relationship data feeds Virima’s CMDB, which stores every configuration item discovery finds without manual entry.
Virima’s ViVID™ service maps work in two steps. First, your team defines each business service by listing the applications and websites that compose it. You can enter the definition manually, import a spreadsheet, or bring it in from an enterprise architecture tool such as LeanIX.
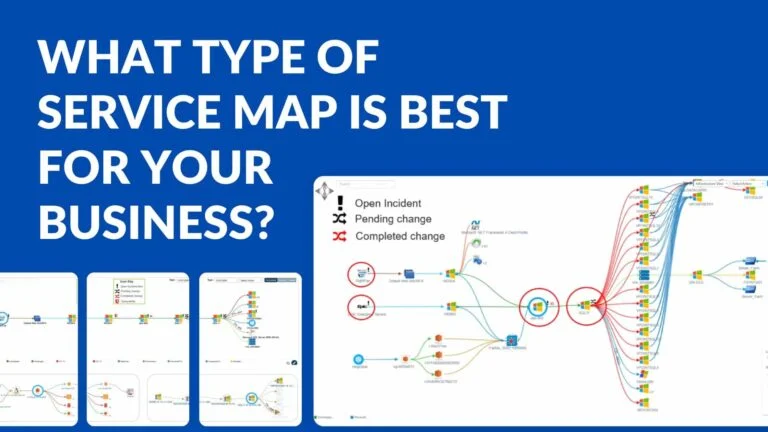
Second, Virima builds the dependency map for that service from discovery data. The map traces applications down to servers, databases, middleware, and network components. Your team owns the service definition because only your team knows what counts as the payroll service or the order portal.
Map construction and refresh belong to the platform. Maps update on each scheduled discovery cycle. A rebuilt server or a moved database appears in the map without anyone editing a file.
For a closer look at the capability, read the service mapping feature overview.

Six criteria to score both approaches
Score each criterion from one to five for your own environment. The table shows how the two approaches to service dependency mapping typically differ.
| Criterion | Manual Visio / LeanIX documentation | Discovery-built dependency maps |
|---|---|---|
| Freshness | Current as of the last manual edit | Refreshed on each scheduled discovery cycle |
| Coverage | Limited to services someone chose to draw | Covers the estate discovery can reach, once a service is defined |
| Design intent | Strong, because it records how systems should behave | Records what runs and how it relates, without the design rationale |
| Maintenance effort | Ongoing edits by named owners | Your team maintains service definitions, and the platform refreshes the map |
| Impact analysis | Manual lookup across files | Impact paths traced from a failing CI to the business service |
| Audit evidence | Depends on version history and file discipline | CI history and an audit trail of record changes |
Manual documentation wins on intent. Discovery wins on freshness, coverage, and effort. Most service delivery questions during a change or an incident need the second set.
Freshness
Check the age of your three most important diagrams. Then compare each one with the live estate. The gap between the two dates is your freshness score. ServiceNow’s own CMDB documentation tracks stale configuration items in windows ranging from 7 to 90 days, which shows how widely “current” gets defined even inside a single platform.
Coverage
List your ten most critical services and count how many have a current diagram. Then list the services behind your last five incidents. Those two lists rarely match. Flexera’s 2025 State of ITAM report found complete visibility across the technology stack fell to 43%, down from 47% the year before, as cloud and SaaS sprawl outpaces manual tracking. A related read: CMDB data quality metrics and why completeness is the wrong metric to chase alone.
Maintenance effort
Estimate the hours your teams spend each quarter redrawing diagrams before audits or major changes. That time is the recurring cost of the manual approach.
Impact analysis and CMDB dependency mapping
Pick a recent change and note how long the impact assessment took. If someone searched shared drives or messaged engineers to find dependencies, the process relies on tribal knowledge. Change impact analysis false negatives explains how an incomplete record can tell a reviewer a change is safe when it is not.
How do discovery-built dependency maps differ from Visio diagrams?
Visio diagrams record what an architect drew on a specific date. Discovery-built maps record the servers, applications, and network devices found in the estate, and they refresh on each scheduled discovery cycle. Diagrams capture design intent, while discovery maps capture the relationships that exist in the running environment today.
Where LeanIX fits alongside discovery
Evaluating discovery maps does not require dropping LeanIX. The two tools hold different facts.
LeanIX records business capabilities, application ownership, and lifecycle plans. Those facts rarely appear in scan data. Discovery records hosts, relationships, and configuration details that rarely appear in an architecture repository. LeanIX is a top-down enterprise-architecture inventory; a discovery-built CMDB is a bottom-up record of what is actually running. Neither substitutes for the other.
Does LeanIX replace a CMDB?
No. LeanIX tracks application ownership, lifecycle stages, and business capabilities from a top-down architecture view. A CMDB built from discovery records the servers, relationships, and configuration details a network scan actually finds, from the bottom up. Service definitions can flow from LeanIX into a discovery tool, which then builds the infrastructure dependency map beneath each service.
Virima can import service definitions from tools like LeanIX, so your architecture records can seed the service list. Discovery then builds the infrastructure dependency map beneath each service. Architecture teams keep their repository, and service delivery gets maps that reflect the running estate.
Your ITSM platform can receive that context too. Virima connects with ServiceNow, Jira Service Management, Ivanti, Cherwell, HaloITSM, Xurrent, Hornbill, and TeamDynamix through the Virima integrations hub. Change and incident records then carry current dependency context instead of a pasted screenshot.
What changes in daily service delivery
Adopting discovery-built maps affects four routines you run every week.
- Change advisory reviewers see the downstream services of a CI before they approve the change. Impact assessment becomes a map view instead of an email thread. Virima’s piece on AI change approval automation and CMDB relationship data covers this shift in more depth.
- Major incident responders trace the path from the failing component to the affected business service. Triage starts from the map, so early minutes go to diagnosis. The same Uptime Institute report cited above found that one in five impactful outages in 2024 cost more than $1 million. That raises the stakes on how fast that first map lookup happens.
- Service level reports tie infrastructure events to named business services. You can show which services an outage affected.
- Audit preparation draws on a maintained map with record history. Auditors who ask for evidence of system connections receive it without a drawing sprint.
Limits to plan for
Discovery-built maps carry real constraints that you should plan for.
Discovery runs in scheduled cycles. A change made minutes ago will not appear until the next cycle completes. Set the cycle frequency to match how often your estate changes.
Service definitions need an owner. The platform builds a map only for services your team has defined. Assign a named person to each service and review the list when applications launch or retire.
Discovery depends on access. Credentials, network reach, and agent deployment decide what a scan can see. Gaps in access become gaps in the map, so track coverage as a metric.
Design intent still needs a home. Keep architecture records for the reasons behind a system’s design. Scan data will not hold that history.
A practical evaluation plan
Run a short comparison on one service before you commit to a wider change.
- Pick one business service that caused an incident in the last year.
- Pull the current Visio diagram or LeanIX record for that service.
- Define the service in a discovery tool and generate its dependency map.
- Compare the two and list components present in one but missing from the other.
- Score the six criteria above for both approaches.
The list of mismatches is the most useful output. It shows what an outage would have exposed. Share it with your change advisory board to make the cost of stale documentation concrete.
To see how discovery-sourced records support change and incident decisions, explore Trusted Runtime Truth and review the approach behind it.
Conclusion: match the source to the question
Manual Visio and LeanIX documentation answer questions about design and ownership. Discovery-built dependency maps answer questions about what is running and what depends on it. Service delivery work leans heavily on the second set.
Score your most critical service on the six criteria, then compare its diagram with the live estate. Large gaps mean your change and incident processes rely on a record that has already drifted.
Frequently Asked Questions
How often should dependency diagrams be updated?
Update a diagram whenever a change alters a service dependency, which for most estates means after every significant release or migration. Few teams sustain that discipline by hand. Many compare each diagram with the live estate every quarter and treat the mismatches as a backlog.
What is the difference between a CMDB and a service dependency map?
A CMDB stores configuration items and the relationships between them. A service dependency map organizes those items around a named business service. It shows which servers, databases, and network components support that service.
Can LeanIX stay in place if I adopt discovery-based service mapping?
Yes. LeanIX holds capabilities, ownership, and lifecycle plans, while discovery holds running infrastructure and its relationships. Service definitions can flow from LeanIX into a discovery tool, which then builds the infrastructure map for each service.
Does Virima discover which applications make up a business service?
No. Your team defines each service by entering it manually, importing a spreadsheet, or bringing it from an integration such as LeanIX. After that, Virima builds the dependency map for the service from discovery data.
How does Virima keep a service dependency map current?
Virima refreshes the map on each scheduled discovery cycle. When a server is rebuilt or a database moves, the next cycle records the change. Your team only maintains the service definitions.