Service Mapping for Manufacturing: Mapping ERP and Supply Chain Dependencies

When Jaguar Land Rover disclosed a cyberattack in September 2025, the company did not report a machine failure or a line jam. It reported that most operations had to shut down simultaneously, because the enterprise systems that scheduled production, ordered parts from suppliers, and processed retail sales were coupled tightly enough that isolating one from the rest was not an option in the moment.
That is the fear many manufacturing IT operations and change leaders carry into every major incident call. Production is down. Suppliers are calling. Leadership wants a clean boundary. The map on the wall is a plant-floor sketch or last year’s architecture slide, and neither answers which ERP module, identity path, or supplier portal still has to stay dark.
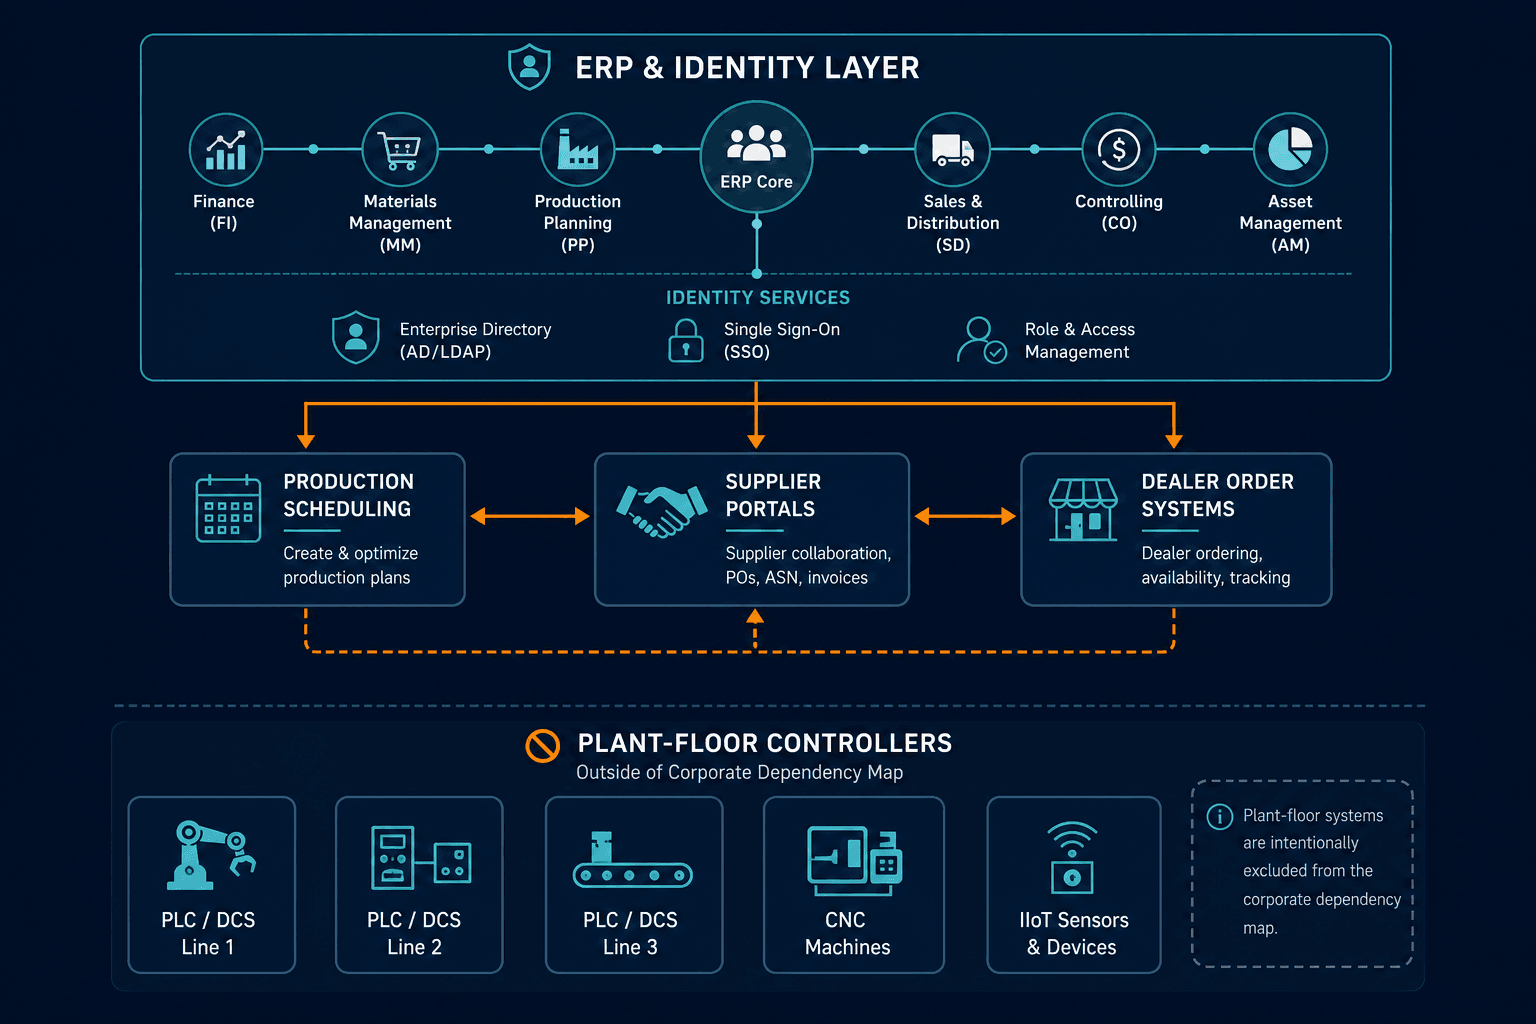
“Mapping dependencies” in manufacturing often gets pictured as plant-floor topology or a one-time enterprise diagram. The outages that take plants and suppliers offline together usually start one layer up: ERP, identity, supply-chain platforms, and the middleware that ties them to plant schedules and dealer orders. This piece is about mapping that chain for blast-radius and change-impact decisions, not about monitoring plant-floor controllers.
What Most Manufacturing Maps Cover Today
Most manufacturers already map something. A CMDB for manufacturing may hold enterprise and corporate configuration items and how they relate. ITOM coverage on the enterprise layer watches whether those systems stay up. IT and OT asset inventories and license and hardware tracking answer what exists across the IT/OT boundary and what you are entitled to run.
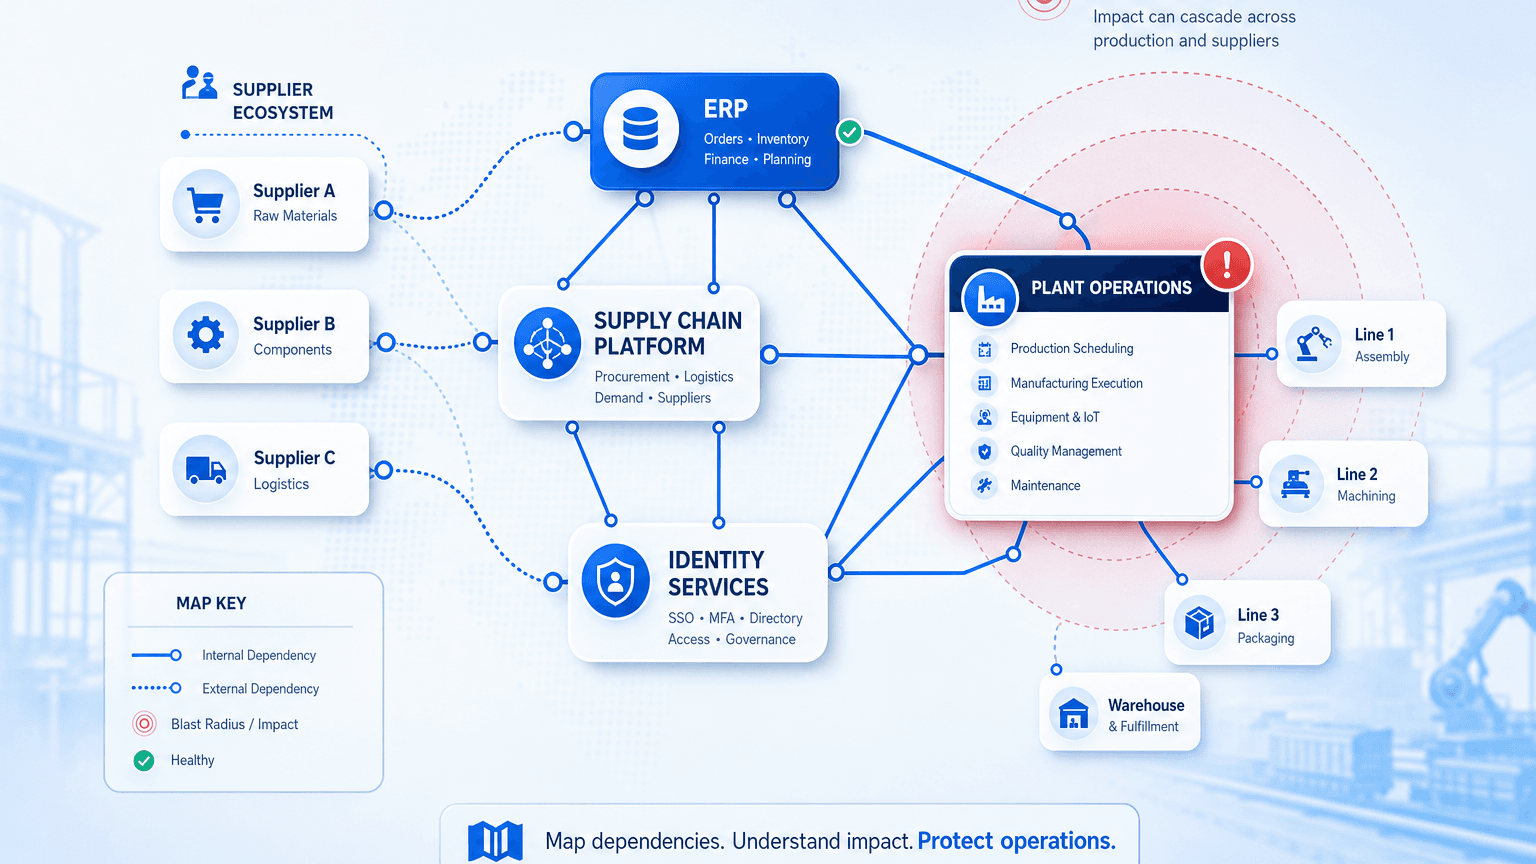
Service mapping for manufacturing, as used here, means a live view of which ERP modules, supply-chain and logistics platforms, identity services, and integration middleware feed which plant-operations and supplier-facing processes. It is dependency and blast-radius work on the corporate application layer. It is not OT protocol discovery, PLC or SCADA monitoring, or a substitute for plant-floor safety systems. Those stay outside Virima’s product scope and belong to OT security and operations tooling.
The same distinction matters against generic “dependency mapping” content. A generic map that treats manufacturing like any other vertical rarely names production scheduling, supplier ordering, or dealer systems as the business services that matter when an ERP-adjacent host fails.
What Cascades: When an ERP-Adjacent System Goes Down
Public reporting on the Jaguar Land Rover incident ties initial access to a vulnerability associated with SAP NetWeaver. The operational result was not a single app outage. Production scheduling, supplier ordering, and retail operations were interconnected enough that most operations shut down together. Three UK plants (Solihull, Halewood, and Wolverhampton) faced a multi-week halt, with phased restoration stretching into November 2025. Fiscal Q3 results reported in January 2026 still cited the disruption, with wholesale volumes down 43% and retail down 25% against the year-ago quarter, per trade and business press coverage including Automotive Manufacturing Solutions and Cybersecurity Dive’s Q3 sales reporting.
The pattern is broader than one automaker. Dragos’s industrial ransomware analysis for Q2 2026, covered by Help Net Security, reported 1,140 industrial ransomware incidents in the quarter. Manufacturing accounted for 747 of them (65%). Researchers pointed to ERP systems, virtualization infrastructure, identity services, and remote access gateways as high-value targets because compromise there can cascade into production shutdowns and supply-chain impact. Mackay Sugar was cited as a case where mills stopped without evidence that attackers reached the control systems themselves.
None of these are stories about a robot or sensor failing first. They are stories about the ERP, identity, and supply-chain layer becoming untrustworthy, and about that layer being tightly coupled to plant and supplier processes without a visible operational boundary.
Why can a single ERP-related compromise stop manufacturing operations without attackers reaching the plant floor?
Production schedules, supplier orders, and dealer transactions often share the same ERP modules, identity paths, and integration middleware. When those corporate systems are untrusted, operators cannot prove which plant and supplier processes still run safely, so the conservative response is a broad shutdown even if programmable logic controllers (PLCs) and supervisory control and data acquisition (SCADA) systems were never reached.
Why This Layer Is Under-Mapped
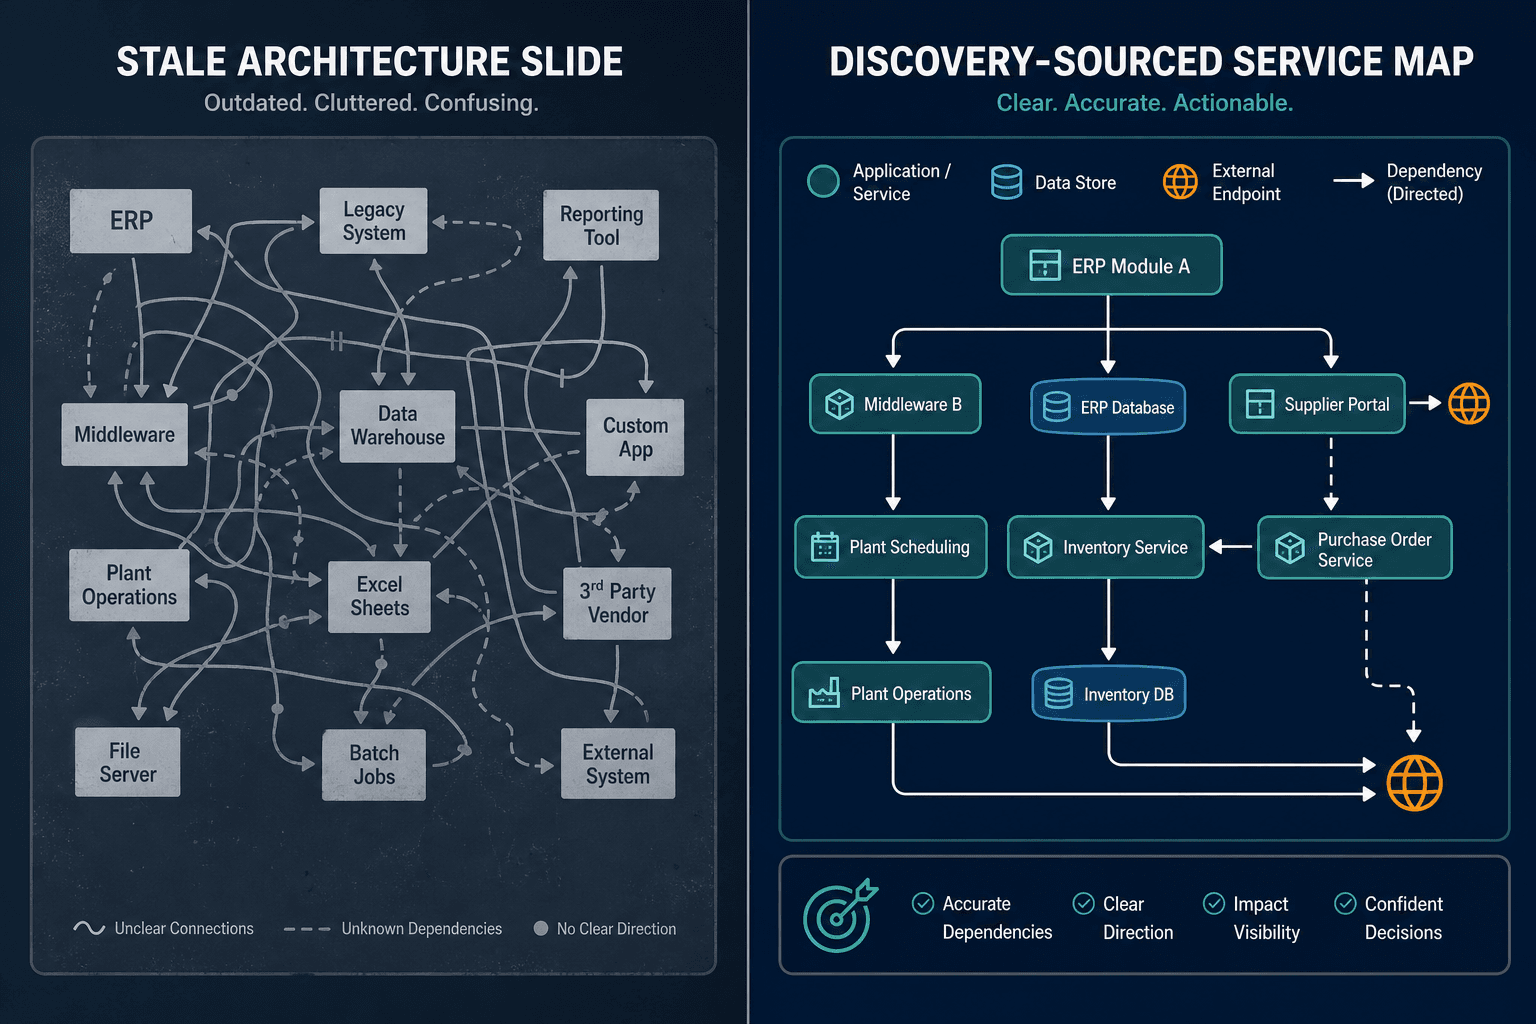
Most manufacturing IT teams already hold some inventory. Hardware shows up in an asset list. OT devices increasingly appear in specialized OT inventories. A configuration management database (CMDB) may list servers and applications. What is often missing is a discovery-sourced map that ties specific ERP modules, logistics platforms, and middleware hops to the named plant and supplier processes those systems support.
Static architecture diagrams and spreadsheets age the moment someone adds an interface, moves a middleware hop, or changes an identity trust path. When the incident starts, the diagram people pull is already wrong for the environment in front of them. Change managers then face the same question with no defensible answer: if we isolate this host or revoke this path, which schedules, shipments, and dealer channels go dark.
OT asset discovery and CI modeling still matter. They answer different questions. They do not, by themselves, show blast radius from an ERP integration server into supplier portals and production scheduling services.
For IT operations directors accountable for change risk, the gap is personal. An incomplete map turns every major ERP or identity event into a binary choice: keep running blind, or stop broadly and explain the downtime later.
Why Recovery Drags for Months, Not Days
JLR’s public timeline shows why recovery length tracks dependency blindness as much as malware cleanup. A minimum five-week production halt, restoration into November 2025, and financial impact still visible in January 2026 Q3 reporting is a multi-month story. Analysts described a total estimated cost near £1.9bn (about $2.5bn), with more than 5,000 supplier, logistics, and service-provider organizations affected and on the order of 120,000 UK jobs tied to the supply chain, per reporting summarized by the BBC and related coverage.
Faster detection helps. It does not replace knowing, before the war room, which plant and supplier processes each corporate system feeds. Without that map, isolation stays coarse. Coarse isolation extends downtime, extends supplier stoppages, and keeps wholesale and retail channels offline longer than the malware dwell time alone would require.
How does service mapping for manufacturing shorten incident recovery?
Service mapping for manufacturing ties enterprise resource planning (ERP), identity, and supply-chain platforms to the plant and supplier processes they support. Responders can isolate a compromised corporate system along known dependency paths instead of shutting unrelated schedules and portals by default, which reduces the width of the outage and the length of phased restart.
The Stakes: What a Cascading Blind Spot Costs
The cost is not only an IT ticket backlog. COOs and CFOs see idle plants, missed shipments, and contractual fallout. Supply chain and procurement leaders see tier-1 and tier-2 partners stopped because the ordering systems they share went dark. Security leaders see ransomware and identity events that never need ICS access to halt production.
Broader supply-chain cyber research commonly cited for 2026 planning cycles reports high rates of production downtime and revenue loss among manufacturers hit through supply-chain attacks, with a minority saying they regularly monitor all vendors. Even when the exact percentages vary by study, the operational shape is stable: corporate application failure travels outward into plants and partners faster than most runbooks assume.
Board questions follow the same path. Who owns the map of ERP-to-plant-to-supplier dependencies? When was it last refreshed from discovery rather than a slide deck? Which change records prove what moved before the outage? IT operations and change managers who cannot answer those questions absorb the accountability even when the first exploit sat in a vendor component.
See how manufacturers establish Trusted Runtime Truth across ERP, supply-chain, and corporate application dependencies before an incident forces a plant-wide stop.
Mapping the ERP-to-Plant-to-Supplier Path Closes the Gap
The practical fix is dependency and service mapping scoped to manufacturing’s cascade points:
- ERP modules used for production scheduling, materials, and order management
- Supply-chain and logistics platforms and supplier portals
- Identity and remote-access paths that gate those platforms
- Integration middleware between corporate apps and plant-facing or supplier-facing applications
- The business services those paths support (scheduling, ordering, dealer/retail order processing)
ViVID service mapping and Virima’s CMDB are built for that corporate and enterprise layer. Teams define which applications and sites make up each business service (manually, by import, or via architecture integrations). Discovery-sourced relationships then build and refresh the dependency map across servers, databases, middleware, and application tiers on high-frequency discovery cycles. Impact path tracing shows how a failing CI reaches a named business service. Change impact analysis surfaces downstream CI and service risk before a change is approved. CI history gives IT, supply chain, and plant leadership an audit trail of what changed and what it touched.
Frame the product honestly. Virima maps enterprise and corporate application dependencies and the business processes they support. It does not monitor PLCs, SCADA, industrial controllers, or safety-instrumented systems. Pair it with OT security tooling where plant-floor telemetry is required. Feed ITSM platforms through Virima’s integrations (including ServiceNow, Jira Service Management, Ivanti, HaloITSM, Xurrent, Hornbill, and TeamDynamix) so change and incident tickets sit on the same dependency picture.
This is the same service-mapping job other vertical pieces in the series apply to regulated corporate systems or outage diagnosis. Manufacturing’s version simply weights supplier and plant-process impact as first-class outcomes of corporate CI failure.
What should manufacturing IT map beyond the plant floor and a basic CMDB list?
Map the path from ERP modules, supply-chain platforms, identity services, and integration middleware to named plant and supplier processes such as production scheduling, supplier ordering, and dealer order handling. A CI list without those process links cannot support blast-radius decisions when a corporate system is compromised.
Where to Start: Scope Service Mapping Against Supply-Chain and Plant Impact
Use a short scope checklist rather than an open inventory project:
- ERP and middleware. List modules and integration hops that move data between corporate systems and plant-facing or supplier-facing applications.
- Identity and network paths. Document auth and segment paths that feed production-scheduling and supplier-ordering platforms.
- Change coverage. Confirm ITSM change control covers the enterprise and corporate application systems plant operations and suppliers depend on, not only plant-floor devices.
- Runbook tests. Exercise incident runbooks against the recorded dependency chain, including supplier and dealer channels, instead of assumed IT/OT segmentation alone.
- Refresh discipline. Prefer discovery-sourced relationship updates on a defined cadence over architecture slides that nobody owns after the audit.
Start with the business services whose downtime stops revenue or contractual shipments. Expand the map outward from those services rather than trying to diagram the entire estate on day one.
Close the Blind Spot Before the Next Cascade
Manufacturing outages that idle plants and suppliers often start in ERP, identity, and supply-chain systems above the floor. They spread as far as they do when nobody has mapped which plant and supplier processes those systems feed before the incident forces the question live. Service mapping for manufacturing closes that gap by making the ERP-to-plant-to-supplier dependency path visible for blast radius, change impact, and recovery scoping, while OT security tools remain responsible for the control layer itself.
Request a demo to see how Virima maps dependencies between your ERP, supply chain, and corporate applications and the plant and supplier processes they support.
Frequently Asked Questions
Why did a single exploited system shut down most of Jaguar Land Rover’s operations at once?
Public accounts describe production scheduling, supplier ordering, and retail operations as tightly interconnected through enterprise systems. When those systems could not be trusted, isolating one without stopping the others was not practical, so most operations shut down together across multiple UK plants.
What is the difference between OT plant-floor mapping and ERP supply-chain dependency mapping?
OT mapping focuses on industrial control networks, controllers, and plant-floor protocols. ERP and supply-chain dependency mapping focuses on corporate applications, identity, middleware, and the plant and supplier business processes those systems support. Both matter. They answer different blast-radius questions and usually need different tools.
How does service mapping reduce blast radius during a manufacturing IT incident?
A current service map shows which business services depend on a compromised host, identity path, or middleware tier. Responders can isolate along that path and keep unrelated schedules and portals running when the map supports it, instead of defaulting to a full operational stop.
Why do manufacturing IT outages cascade to suppliers and dealers?
Supplier portals, logistics platforms, and dealer order systems often share ERP data, identity, and integration paths with internal scheduling. When those corporate systems stop or are taken offline for containment, external partners lose the digital path that keeps shipments and orders moving.
How does Virima support service mapping for manufacturing without claiming OT monitoring?
Virima discovers and maps enterprise and corporate IT configuration items and, once business services are defined, builds dependency maps used for impact and change analysis. It is designed for that corporate layer and ITSM integration. It does not replace OT security platforms that monitor industrial control systems on the plant floor.