IT Visibility and Business Intelligence: How They Work Together

Managing IT systems and making data-driven decisions are two challenges most organizations face. IT visibility and business intelligence address both. Without IT visibility, teams lack a clear view of how key assets perform. This causes reactive responses to problems, more downtime, and wasted resources. Without business intelligence, organizations sit on large volumes of data but struggle to extract useful insight. The result is poor decision-making, missed opportunities, and IT strategies that fail to align with business goals.
Overcoming these challenges requires the right tools. Virima delivers IT visibility. Strong BI tools transform raw data into meaningful decisions. This article explores how the two disciplines relate — and how combining them strengthens organizational decision-making.
What Is IT Visibility?
IT visibility means monitoring and collecting data from every component of an organization’s IT infrastructure. It covers four areas: network, application, infrastructure, and data visibility.
Strong IT visibility gives teams a current picture of IT operations. They can spot bottlenecks early, fix issues before they affect users, and feed consistent data into BI tools. Without it, BI platforms work from a fragmented, outdated view of the environment.
Each of the four areas contributes differently:
Network visibility monitors traffic, identifies anomalies, and detects security threats. IT teams can respond before users are affected.
Application visibility tracks performance metrics and surfaces bottlenecks. Applications run more reliably when performance data is available and tracked over time.
Infrastructure visibility shows the health and utilization of hardware and software. This data is essential for stable operations and confident planning.
Data visibility ensures data is accessible, accurate, and governed. It lays the foundation for effective business intelligence.
Together, these four areas give IT teams a full picture of their environment. That picture is what makes IT visibility central to any organization that relies on data.
| What is IT visibility in enterprise IT? IT visibility is the practice of monitoring every component of an IT environment, networks, applications, servers, endpoints, and data flows, and collecting accurate data from each. It gives IT teams a current picture of what assets exist, how they connect, and whether they are performing as expected, forming the foundation for reliable business intelligence. |
The Essence of Business Intelligence (BI)
Business intelligence (BI) collects, analyzes, and visualizes data from multiple data sources. It supports decisions across every level of an organization. BI tools — like Microsoft Power BI, Tableau, and Looker — pull from data sources, apply analytics, and present results through dashboards and reports.
BI has three core components:
Data Collection and Integration
This step gathers data from various data sources across the organization. That data goes through cleansing, transformation, and integration. Every downstream analysis depends on the quality of this step.
Data Analysis and Reporting
This step extracts insight from integrated data. It uses data mining, statistical analysis, and online analytical processing (OLAP). Those insights become reports and summaries that decision-makers can act on quickly.
Data Visualization and Dashboards
Dashboards convert complex datasets into clear, interactive formats. Stakeholders can monitor KPIs, track historical data trends, and identify patterns without digging through raw exports. Well-designed dashboards reduce the time between data and decision.
BI gives organizations the ability to make data-driven decisions and find new opportunities for growth. For IT teams, BI converts infrastructure data into insight that leadership can act on.
| What data do BI tools need from IT systems? BI tools need accurate, structured data from reliable sources: asset inventory records, historical performance logs, incident data, and dependency maps. IT discovery and CMDB tools provide this data in formats that BI platforms can query, filter, and visualize to support decisions across the organization. |
The Relationship Between IT Visibility and Business Intelligence
IT visibility and business intelligence strengthen each other. IT visibility determines the quality of data that BI analyzes. BI provides the context that makes IT visibility data actionable.
IT visibility improves BI data quality. Monitoring networks, applications, infrastructure, and data flows catches problems at the source. A network anomaly that corrupts a log, for example, gets flagged before it spreads to BI platforms.
IT visibility identifies patterns and trends. Monitoring IT operations surfaces insights into customer behavior, service efficiency, and operational performance. These patterns drive strategic planning and operational improvements.
Business intelligence adds context to IT visibility data. Analyzing and visualizing infrastructure data gives IT teams a fuller view of performance. It helps prioritize resources, plan investments, and find automation opportunities.
| How does IT visibility improve business intelligence output? IT visibility improves BI output by keeping the data source accurate and current. Consistent monitoring catches errors before they reach BI platforms. Historical data captured over time lets BI tools surface capacity trends, failure patterns, and performance changes that inform better decisions. |
Why Organizations Integrate IT Visibility and Business Intelligence
IT visibility gives teams a clear view of operations. Business intelligence transforms that data into decisions. When integrated, the two give organizations a verified, analytical picture of their infrastructure.
BI platforms receive verified, current data from IT visibility tools. That foundation lets analysts work from multiple angles. The resulting insights move the organization forward.
The key benefits are:
Enhanced Decision-Making
Decision-makers get a verified view of organizational data. They can identify trends, patterns, and anomalies. This leads to better strategic planning and more confident operational decisions.
Improved Efficiency
Employees access accurate information more quickly. They spend less time gathering data and more time acting on it. Processes that relied on manual reconciliation become faster and more reliable.
Increased Agility
Organizations adapt faster to market shifts and changing customer needs. Current, analyzed data shortens response times. Decisions move from committee review to direct action.
Cost Reduction
BI analysis of historical data surfaces underutilized assets, redundant software licenses, and operational inefficiencies. Organizations make targeted cuts instead of broad ones. Savings go directly to the bottom line.
Enhanced Collaboration
A shared data source breaks down silos between departments. Teams share insights, align goals around common metrics, and work more effectively across functions. This builds a data-driven culture and supports innovation.
Organizations need effective IT visibility tools to drive efficiency and ROI. Virima provides high-frequency discovery insights. This lets businesses optimize operations, find cost-saving opportunities, and make informed decisions.
| What is the relationship between IT visibility and business intelligence? IT visibility generates the data BI tools analyze: asset states, dependency maps, network performance, and historical change records. Without accurate IT visibility, BI output reflects incomplete or stale data. The two form a pipeline: visibility at the data source, BI at the decision layer. |
Why Choose Virima for IT Visibility and Business Intelligence?
Virima is a comprehensive IT asset and service management platform. It goes beyond tracking assets. It helps organizations understand how assets interact and how that interaction affects operations.
Virima’s features contribute to business intelligence in several ways:
Automated Discovery and Inventory
Virima’s ITAM and ITSM tools automatically detect, identify, and maintain a current inventory of hardware and software assets.
Discovery
Virima’s discovery scans networks and connected devices to identify all assets. This includes servers, workstations, network devices, applications, and virtual environments. It uses IP scanning, agent-based scanning, and API integrations.
Identification
Once discovered, assets are categorized by make, model, OS, software version, serial numbers, license keys, and hardware specs. This creates a structured, queryable data source for BI platforms.
Inventory Management
Asset data is stored in a centralized CMDB. The CMDB updates on a defined schedule. It always reflects the current state of the IT environment.
Accurate inventory helps organizations find underutilized resources and avoid unnecessary spend. It also flags outdated or unsupported software that poses security risks or reduces productivity.
Dependency Mapping
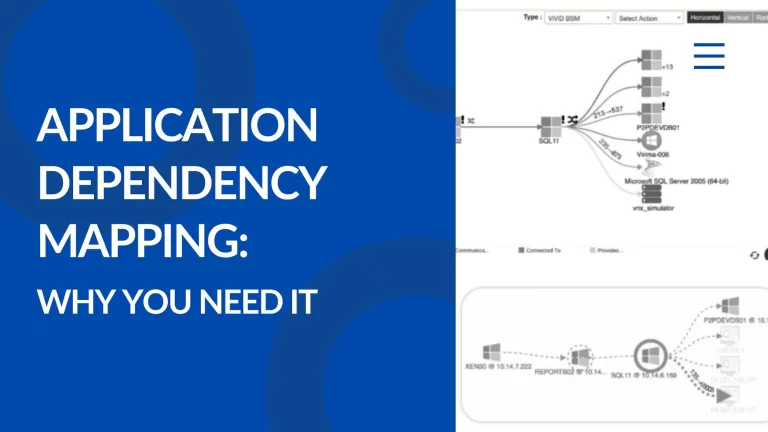
ViVID Service Mapping provides a visual view of IT infrastructure, application dependencies, and business services. Teams provide the service definitions. Virima builds the dependency maps automatically from that input.
By integrating with ITSM processes, ViVID gives business intelligence tools the relational context they need to analyze change impact, blast radius, and service performance across the environment. The result is a complete picture of how IT assets and services support business operations: information that leads to better planning, optimized IT operations, and improved business outcomes.
IT Service Management (ITSM)
Virima ITSM captures data on service performance, incident resolution, and user feedback. BI tools use this data to identify service gaps and align IT with business objectives. The result is lower operational costs and better user experience.
Dashboards and Reporting
Virima’s dashboards let teams track KPIs and view multiple data sets in one place. Customized views surface the metrics relevant to each role. This improves both decision speed and decision quality.
Virima’s features provide structured, reliable data for BI analysis. Using this data helps businesses optimize IT infrastructure, reduce costs, and align operations with strategic goals.
Explore how Virima delivers trusted runtime truth BI teams can build on: virima.com/trusted-runtime-truth/.
| How does Virima support business intelligence initiatives? Virima provides the IT visibility layer BI tools need: automated asset discovery, a structured CMDB as a central data source, ViVID dependency mapping for relational context, and ITSM performance data. IT and BI teams use Virima to track KPIs, analyze historical trends, and make evidence-based infrastructure decisions. |
Conclusion
Combining IT visibility with business intelligence gives your organization a reliable data source for every decision. Virima provides the visibility layer — so your BI tools work from verified, current infrastructure data.
Give your BI tools a reliable data source: Request a Demo at virima.com
Frequently Asked Questions
What is the relationship between IT visibility and business intelligence?
IT visibility generates the data BI tools analyze: asset states, dependency maps, network performance, and historical change records. Without accurate IT visibility, BI reflects incomplete data. The two work as a pipeline — visibility at the data source, BI at the decision layer.
What historical data do BI tools pull from IT systems?
BI tools analyze asset inventory snapshots, incident logs, change records, and performance metrics over time. This data helps teams spot trends, model capacity, and catch recurring failure patterns before they become outages.
Can BI tools work without a CMDB?
BI tools can connect to many sources, but fragmented data leads to unreliable analysis. A CMDB gives BI a single, authoritative record of IT assets and their relationships — making analysis more accurate and consistent.
How does Virima improve BI data quality?
Virima’s discovery engine scans on a defined schedule and updates asset records when changes occur. BI platforms that pull from Virima always work from a current, structured data source rather than stale or manually maintained records.
What BI tools work alongside IT visibility platforms?
Common BI tools include Microsoft Power BI, Tableau, and Looker. Virima integrates with ServiceNow, Jira, Ivanti, Halo, Xurrent, and Hornbill — making it straightforward to route visibility data into existing BI and ITSM workflows.