Change Management KPIs: The Metrics That Actually Reduce Failed Changes

Every change advisory board has a dashboard. Few have a diagnosis. The board still reviews emergency share, success rate, and backlog age every week. Red tiles stack. Process owners tighten forms and extend freeze windows. The same numbers barely move.
This article covers ITIL-style change enablement metrics (risk, approval, implementation, and recovery), not organizational change management scores such as training completion or adoption sentiment. OCM measures matter in people programs. They do not answer whether last night’s patch window left payroll offline.
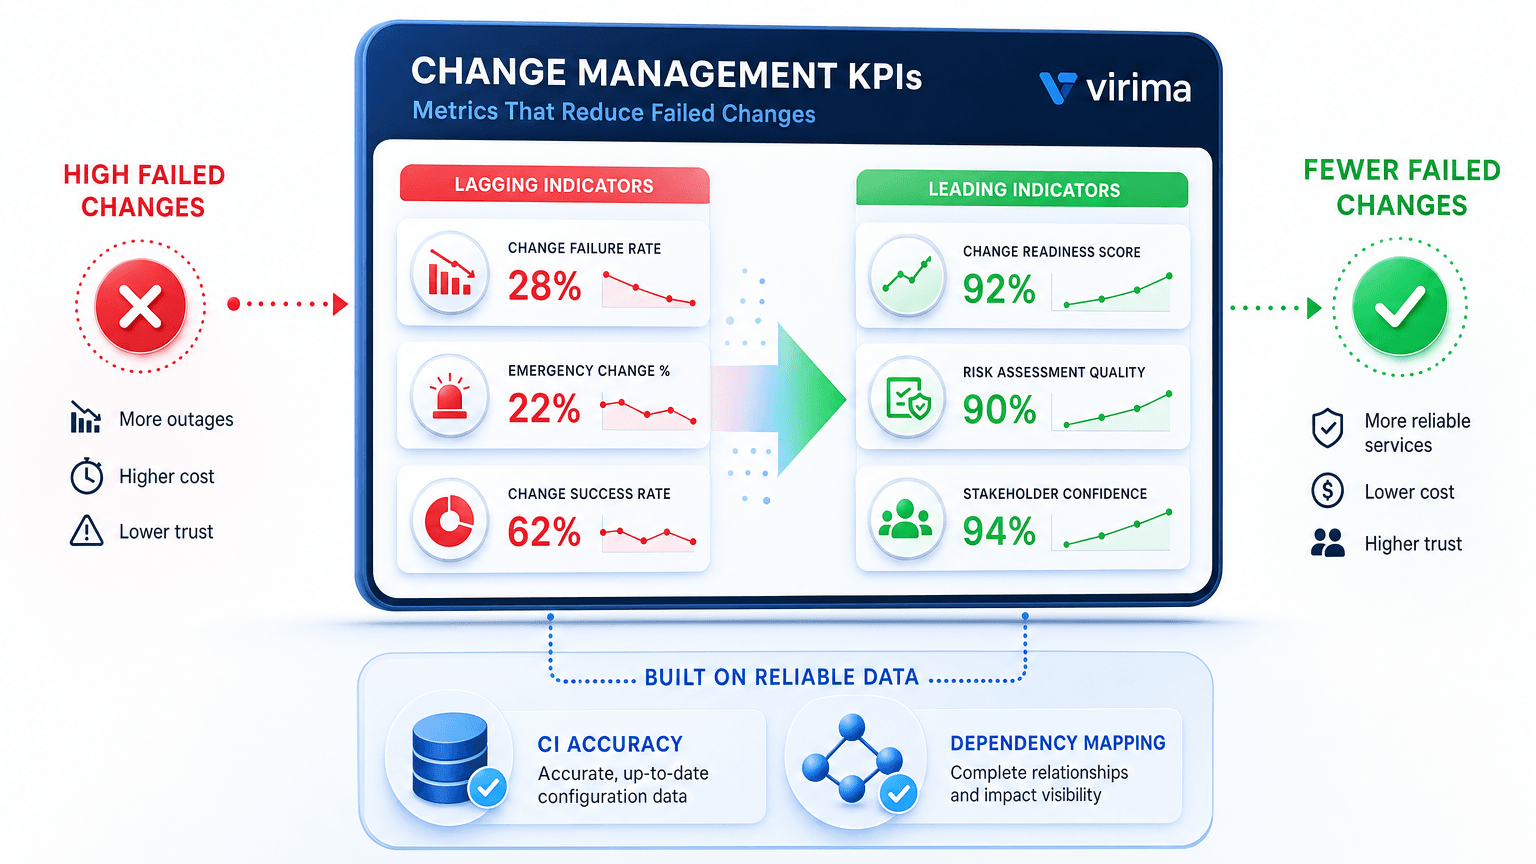
Some change management KPIs respond to process discipline. Others stay capped until configuration and dependency data behind risk assessment is current enough to trust. Treat lagging outcomes and leading data-quality indicators as one system.
What “change management KPI” means in ITSM (and what it doesn’t)
A change management KPI is a repeatable measure of change enablement — request volume, approval outcome, incident linkage, and recovery after a bad change — used to decide where to intervene. A metric is any tracked number; a KPI is the short set the CAB and ops leadership actually act on.
PeopleCert’s ITIL framing treats change enablement as the practice that maximizes successful service and product changes while managing risk. The set below reflects widely used ITIL change management KPIs, not a mandate list from a single ITIL table. Directional notes are commonly targeted ranges, not universal standards.
Organizational change management (OCM) tracks human adoption of a business transformation. Keep OCM on the transformation board. Keep IT change enablement KPIs on the CAB and IT operations board.
How do I know I need ITSM change management KPIs rather than OCM metrics?
If the board reviews outages, emergency changes, CAB approvals, and rollback after production work, you need ITSM change enablement KPIs. If it reviews training completion, sentiment, and role adoption for a business transformation, you need organizational change management metrics. Same search phrase; different operating system.
The core change management KPIs IT teams track
Use this set as a working framework. Pair each KPI with an owner, a system of record, and a review cadence in the checklist later.
| KPI | What it measures | Formula (typical) | Directional note |
|---|---|---|---|
| Change success rate | Implemented changes that meet intent without unplanned disruption or rollback | Successful changes ÷ implemented changes | Many teams aim high and still miss when risk data is thin |
| Change failure rate | Changes that cause an incident, outage, or forced rollback | Failed changes ÷ implemented changes | DORA’s benchmark for elite software delivery teams is under 5%; enterprise change enablement has no equivalent published ceiling, so set the target from your own incident-linked baseline, then pair with leading CMDB and map coverage indicators |
| Emergency change % | Share of changes run outside standard or normal path | Emergency changes ÷ all changes | High share often signals weak planning or risk assessment |
| Unauthorized change rate | Changes with no approval or outside defined process | Unauthorized changes ÷ all changes (or absolute count) | Primary GRC and audit signal |
| Change lead time / cycle time | Elapsed time from request (or approval) to implementation | Median or mean time across the period | Separate from backlog volume |
| Change backlog | Open or unapproved requests waiting action | Count (and age buckets) | Capacity and intake health |
| Change-to-incident ratio | Incidents or tickets tied to a recent change | Change-linked incidents ÷ implemented changes | Sensitive to CI and dependency accuracy |
| MTTR after failed change | Time to restore service after a change-caused incident | Mean (or median) restore time for change-linked incidents | No universal target; track trend by service tier |
| Rollback / backout rate | Implemented changes later reversed | Rollbacks ÷ implemented changes | Often under-counted if backout is informal |
Define failure once (incident, SLO breach, forced backout, or failed post-implementation check) so success and failure rates stay comparable. IT Process Wiki’s change management KPI notes treat these as core practice measures, not a substitute for local rules.
Emergency change percentage rises when freeze design is wrong, standard models are too slow, or risk assessment stalls on incomplete CI ownership and dependencies. Unauthorized change rate is the control metric for audit and ops when untracked work still moves production. Lead time is funnel speed; backlog is unfinished volume and age. Change-to-incident ratio bridges configuration accuracy and enablement when “successful” tickets still spawn incidents. MTTR after failed change needs current owners and a real service path. Rollback rate must count formal and de facto reverse actions, or failure rate looks healthier than the estate felt.
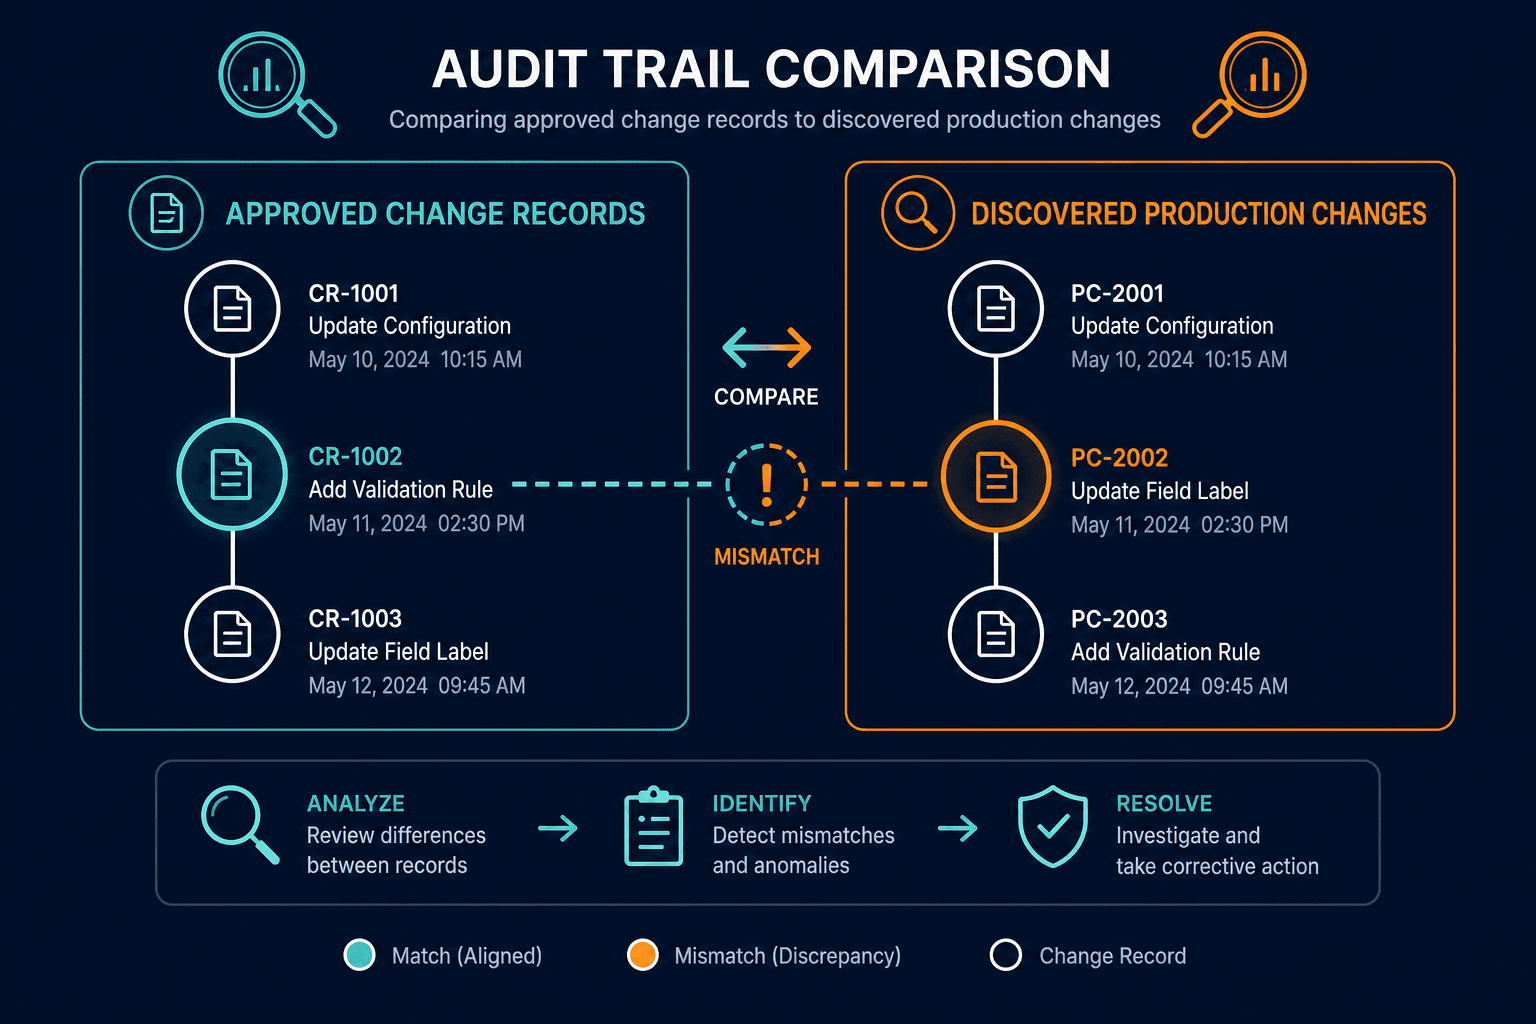
Unauthorized change and audit-trail integrity carry the same weight on the compliance wall as on the ops wall. Auditors sample whether production movement matches approved change records, and when discovery shows drift that never entered the change system, the control story weakens even if CAB minutes look complete. CISA Binding Operational Directive 23-01 pushes federal civilian agencies toward continuous asset visibility on a demanding cadence — not private-sector law, but a signal of where inventory expectations are heading. Change management metrics programs that ignore inventory currency inherit the same blind spot GRC already fights elsewhere.
Why these KPIs stay flat even when CABs get stricter
Stricter CAB process improves documentation quality. It does not invent missing relationships. Risk scores still inherit whatever the CMDB holds for the target CI, its parents, and dependent business services. When that store is incomplete or stale, emergency share and failure rate stay high after more meetings.
Virima’s change-management use case notes that over 80% of IT-related outages stem from planned changes made without a clear understanding of service dependencies, risk impacts, or post-change validation. That is a visibility problem showing up as a KPI problem. Dashboards report the symptom. Dependency gaps drive the rate.
DORA’s metrics guidance treats change fail rate as a delivery signal for software teams. Enterprise change enablement faces the same shape at infrastructure scale: outcome metrics improve when the packet can name what will break. Without mapped dependencies, the CAB votes on narrative risk, not estate risk.
Separate two buckets. Process-movable KPIs include backlog hygiene, review turnaround, template completeness, and honest unauthorized-change detection. Data-capped KPIs include failure rate, change-to-incident ratio, emergency share from thin risk packets, and MTTR when owners and service path are wrong. Stricter gates without fresher CI data mainly slow the queue. For a closer look at why CAB approvals often outlive the estate they were scored against, see CAB Change Management Still Approves Risk the Estate No Longer Matches.
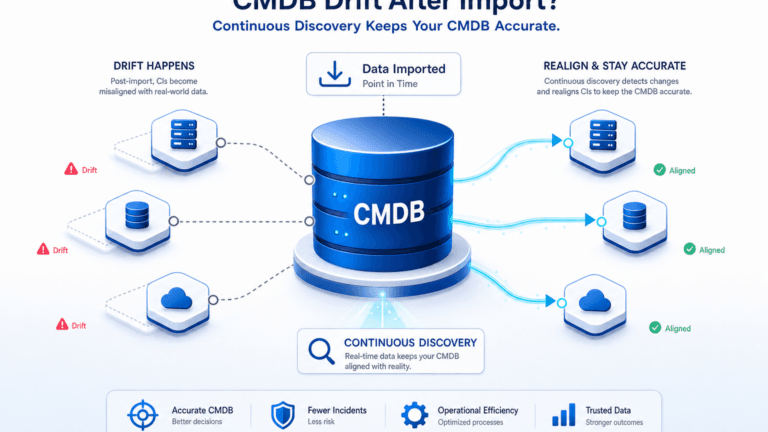
Discovery-sourced CMDB records and ViVID™ service maps sit under the second bucket. Service composition still needs a defined input (manual, import, or architecture feed). Once definitions exist, map building can stay aligned to high-frequency discovery cycles across agent, agentless, and API sources. That layer feeds risk assessment. It does not replace CAB judgment or the ITSM workflow tool.
What should a CAB do when failure rate stays high after stricter gates?
Open the paired leading indicators first: CI resolution rate on tickets, dependency map coverage on critical services, and owner currency. If those are red, schedule discovery and service-definition work before adding another approval field. If those are green, inspect standard-change design and implementation test depth.
Turning change KPIs into a leading-indicator dashboard
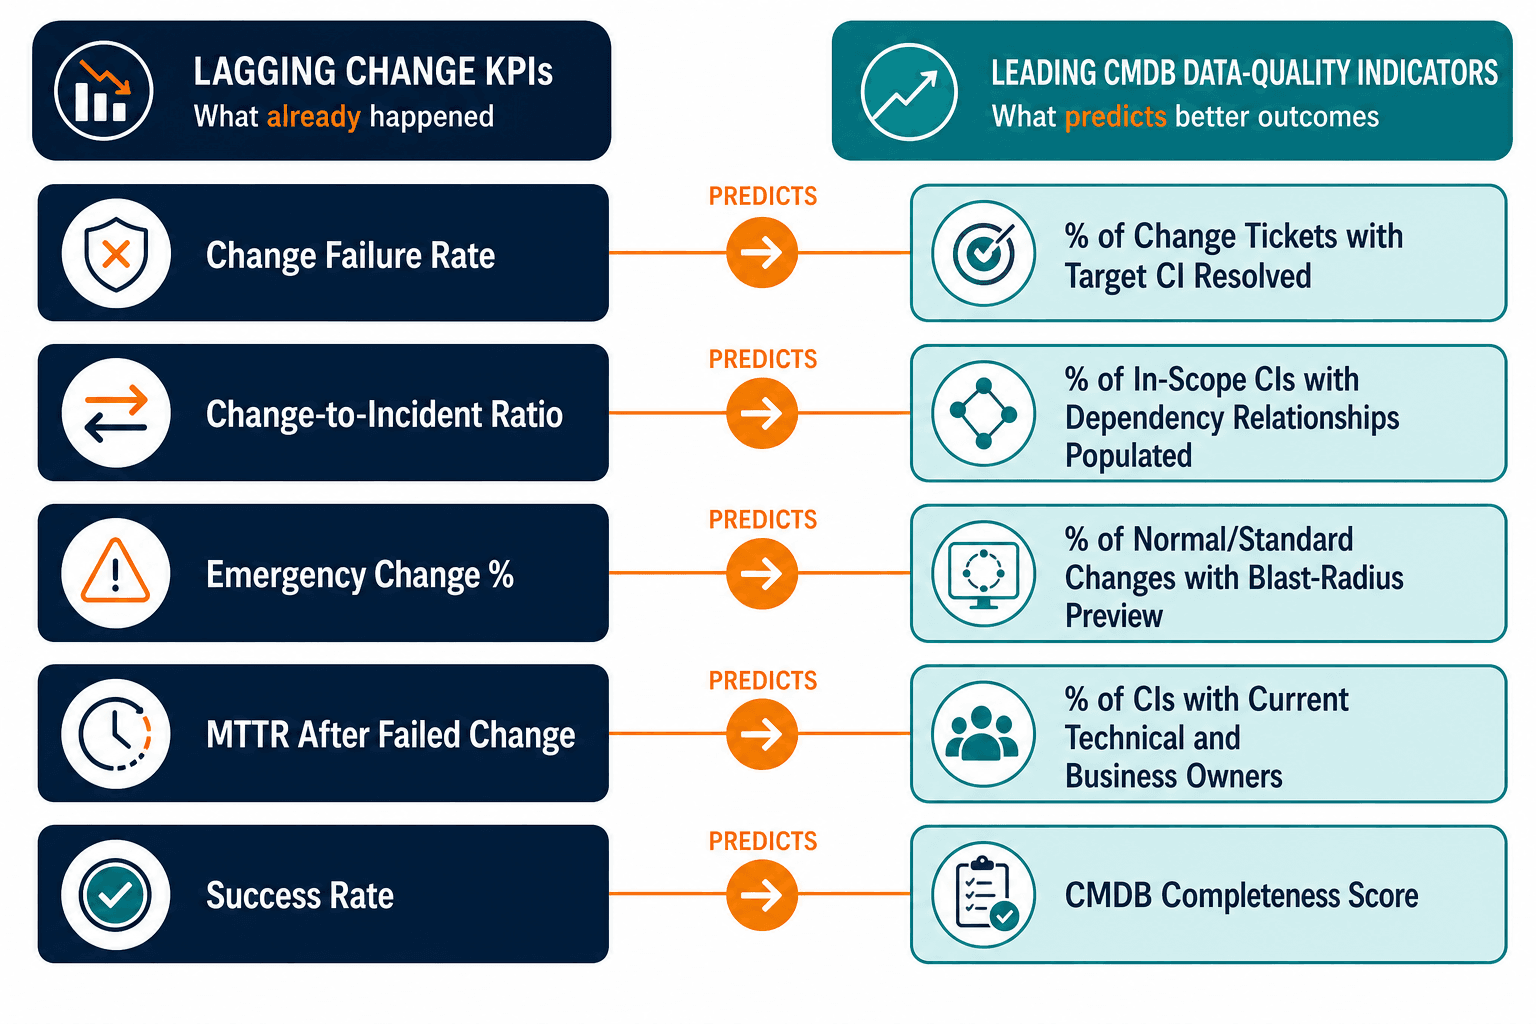
Lagging KPIs show last month’s pain. Leading indicators show whether next month’s CAB can decide with better packets. Build the dashboard as pairs, not as two unrelated tabs.
| Lagging KPI | Leading indicator (data quality) | What “good” looks like in practice |
|---|---|---|
| Change failure rate | % of change tickets with target CI resolved and last-discovered within policy | Target CI is not free text; discovery age meets the agreed SLA |
| Change-to-incident ratio | % of in-scope CIs with dependency relationships populated | Critical services show app-to-infra edges, not orphan nodes |
| Emergency change % | % of normal/standard changes with blast-radius preview at approval | Approvers can name downstream services before the vote |
| MTTR after failed change | % of CIs with current technical and business owners | Bridge can page the right owner without tribal lookup |
| Success rate | CMDB completeness score on change-critical classes | Servers, network edges, and key middleware classes meet threshold |
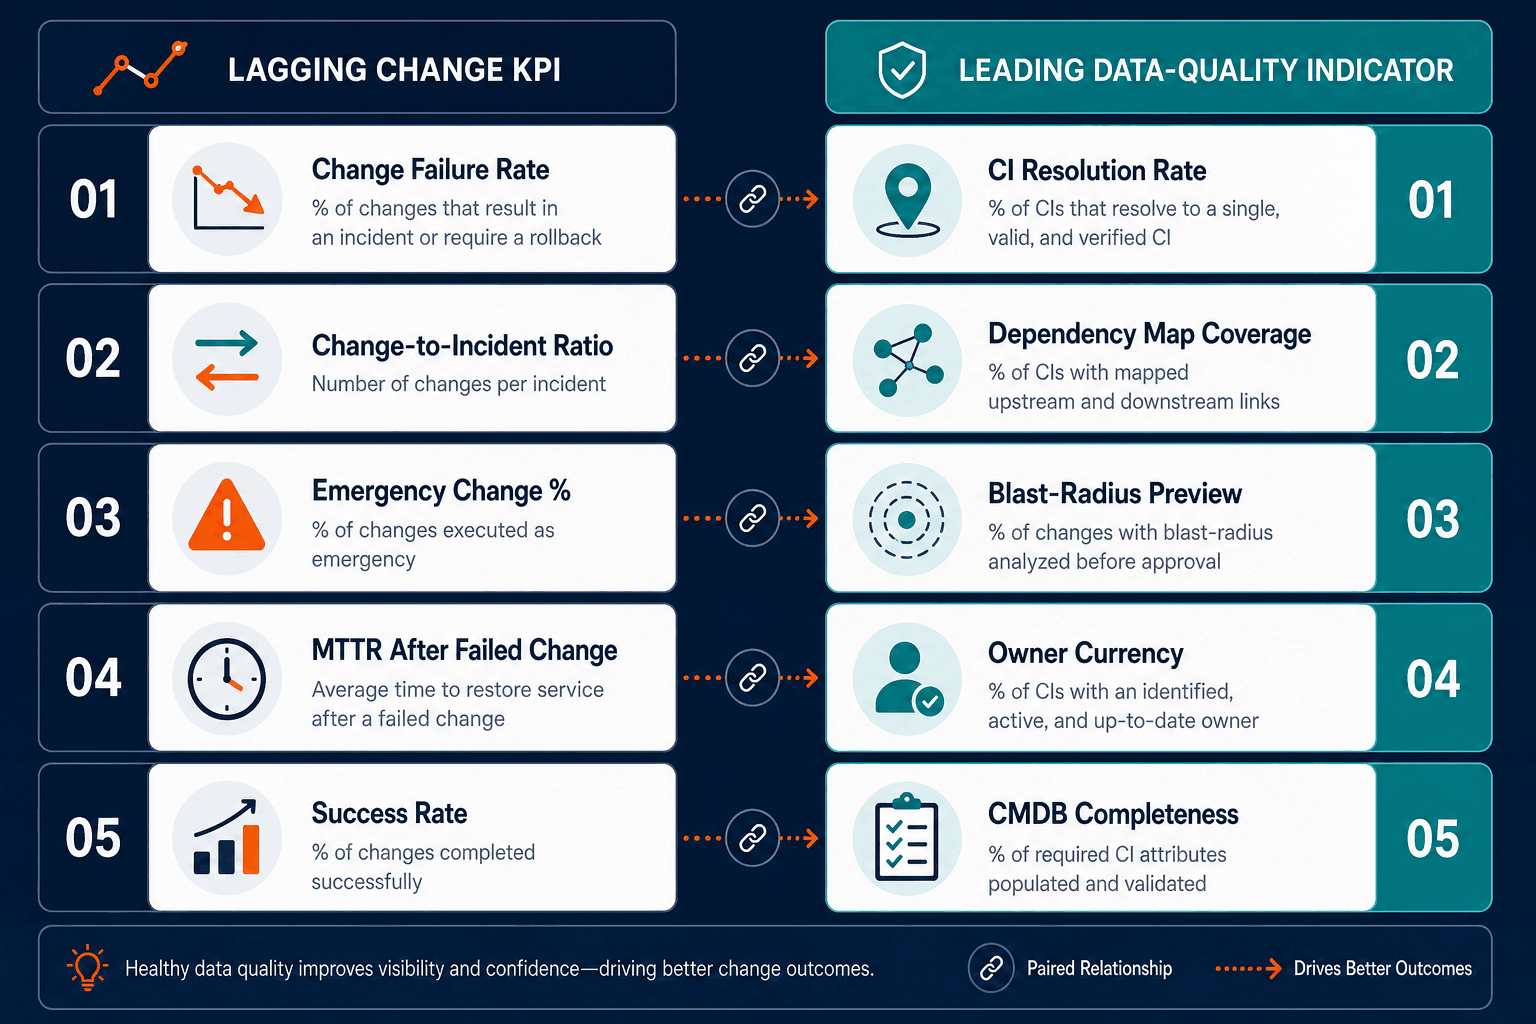
CMDB completeness and freshness are two different checks. Completeness is whether required attributes and relationship types exist for change-path CI classes. Freshness is whether high-frequency discovery cycles refreshed those classes inside the risk window. Green completeness on stale last-seen timestamps still misleads the CAB. That gap is why completeness alone is the wrong CMDB metric without a freshness check attached.
Mapped dependencies and blast radius matter just as much. Orphan CIs pass forms and fail production. Track map coverage on high-volume, high-cost services. At approval time, ask whether the approver could see likely downstream impact from the CI and service map. If the answer is usually no, process training alone will not move failure rate.
Owner currency closes the loop. MTTR collapses when the CI still lists a departed engineer. Owners need the same reconciliation discipline as hostname and IP. The same clock problem shows up on the incident side: see Incident Management KPI Dashboards Still Look Green When the Clock Starts on the Wrong CI for how a stale owner or CI record skews MTTR before the first ticket is even triaged.
Review lagging and leading tiles in the same meeting. When failure rate rises and leading indicators are red, fix discovery scope, credentials, relationship rules, or service definition inputs before adding another CAB field. When leading indicators are green and lagging KPIs stay red, inspect standard-change design, test coverage, and runbooks.
Virima’s role is discovery, CMDB, and ViVID™ maps that feed the ITSM change record — not a second change tool. ServiceNow, Jira, and Ivanti stay plain-text partner names in operating docs. For the operational context that keeps those inputs trustworthy across hybrid estates, start with Trusted Runtime Truth.
Do leading CMDB indicators replace change success and failure KPIs?
Leading indicators forecast whether risk packets can improve. Lagging KPIs still report production outcomes. Run both in one review. Leading-only dashboards hide outages. Lagging-only dashboards hide the data debt that caused them.
Building your change management KPI dashboard (checklist)
Use this as a build list, not a slide title.
- Name an owner per KPI (CAB chair, change manager, problem manager, or GRC analyst).
- Define success and failure once, including incident, SLO, and rollback rules. Version the definition when it changes.
- Pick the system of record. ITSM for ticket outcomes; CMDB/discovery for CI freshness, relationships, and owners.
- Set reporting cadence. Weekly ops for backlog, lead time, and emergency change percentage; monthly CAB for failure rate, change-to-incident, rollback; quarterly GRC for unauthorized change.
- Pair every lagging KPI with one leading indicator from the table above. Review both in the same slot.
- Segment by risk. Cut critical business services separately. A healthy average can hide a burning tier-0 service.
- Instrument rollback and unauthorized paths before celebrating success rate.
- Time-box data fixes when leading indicators are red. Assign discovery or map work with dates, not another policy PDF.
- Retire vanity tiles that never change a decision.
- Revisit definitions after major estate shifts such as cloud growth or data center exits.
For process design beyond measurement, use your ITSM change best-practice library. Keep this page on what you measure and what the CMDB must hold for those measures to move.
Put blast-radius data under the KPIs that refuse to move
These change management metrics prove their value when they drive the next fix, not when they decorate a slide. Success rate, failure rate, emergency share, unauthorized change, lead time, backlog, change-to-incident ratio, MTTR after failed change, and rollback rate form a complete outcome set. The set still stalls when approval packets lack current CIs, owners, and service dependencies.
Separate process-movable metrics from data-capped metrics. Feed the second group with discovery-sourced CMDB currency and ViVID™ maps built from defined services. Then the CAB can govern risk with estate evidence. For a practical walkthrough of moving change success rate up while cutting the firefighting that keeps failure rate flat, see Cut Firefighting While Raising Change Success Rates.
See how discovery-sourced CMDB and ViVID™ service maps give change teams blast-radius context before a change ships — walk through the change management use case to see your KPI pairs against real discovery coverage.
Frequently Asked Questions
What is a good change success rate?
Many ITSM vendors cite a common benchmark above 95% for standard changes, but there is no single ITIL-mandated number. Teams still miss that range when risk packets lack current CI and dependency data. Define success locally, segment by service criticality, and trend the rate beside CMDB freshness and map-coverage indicators.
What is the difference between change management KPIs and change management metrics?
Metrics are any tracked numbers in the change practice. KPIs are the short list leaders use to steer decisions, such as failure rate, emergency share, and unauthorized change rate. Keep the CAB agenda on that KPI set paired with leading data-quality indicators.
How does Virima’s discovery-sourced CMDB improve change-to-incident ratio?
Change-to-incident ratio breaks down when the change record names a CI that no longer reflects what’s actually running. Virima’s discovery keeps CI attributes and dependency relationships current, so risk assessment and post-change incident linkage are checked against the same estate, not a stale record and a live one.
What causes a high change failure rate?
Common causes include incomplete test coverage, weak standard-change design, and implementation error. A frequent structural cause is risk assessment on incomplete or stale CMDB and dependency data. Check CI resolution, relationship coverage, and owner currency before adding more CAB gates alone.
Does Virima’s CMDB feed change risk data into ServiceNow or Jira Service Management, or replace the change workflow?
Virima’s discovery-sourced CMDB and ViVID™ service maps feed CI and dependency data into your existing change record in ServiceNow, Jira Service Management, or Ivanti — they don’t replace the CAB workflow. The change ticket still lives in your ITSM tool; Virima supplies the blast-radius context the risk assessment is missing.