Table of Contents
What Is Network vs. Application Monitoring (and Why You Need Both)
Why Unified Network and Application Monitoring Matters
Common Monitoring Challenges in Enterprise IT
How Can I Improve Server and Application Performance Monitoring?
Define the Right Metrics and Baselines
Use Integrated or Interoperable Monitoring Tools
Prioritize Intelligent Alerting
Add Dependency and Service Context
Integrate Monitoring with ITSM and Automation
Choosing the Right Monitoring Tools and Vendors
How to Improve Server and Application Performance Monitoring
Define the Right Metrics and Baselines
Use Integrated or Interoperable Monitoring Tools
Prioritize Intelligent, Context-Aware Alerting
Add Dependency and Service Context
Integrate Monitoring with ITSM and Automation
Best Practices for Unified Monitoring with Virima
Maintain a Single Source of Truth
Correlate Alerts with Service Impact
Design and Validate Dependency-Aware Workflows
Support Compliance and Audit Readiness
Continuously Adapt to Change
Monitoring in Action: Why Context Changes Everything
The Future of Network and Application Monitoring
Service-centric Visibility
Automated and Context-aware Correlation
Integrated Operational Workflows
Achieving 360° Visibility Across Your IT Environment
At 9:07 a.m., your dashboard turns yellow. Latency starts to rise. Soon, remote offices complain. Transactions slow down, and the helpdesk fills fast. You feel the pressure right away.
Next, each team checks its own tools. The network looks fine. Servers show normal health.
The app team rolls back a release to stay safe. Meanwhile, you still lose time and trust.
This is common in large enterprises. Most slowdowns have more than one cause. A small app issue may start in the network or a hidden service. When tools work alone, you miss the full story.
Because of this, finding the real cause takes longer. Teams blame each other instead of fixing issues. Alerts keep coming, but answers stay unclear. As a result, problems last longer than they should.
In fact, 63% of organizations receive over 1,000 infrastructure alerts per day, and 22 % see more than 10,000 alerts daily, contributing heavily to alert fatigue and slower responses.
This guide helps you change that. You will learn how to improve application and server monitoring and understand how network visibility supports it.
You will also see why network visibility matters. Most importantly, you will learn how context turns alerts into clear answers.
What Is Network vs. Application Monitoring (and Why You Need Both)
Network monitoring helps you watch the parts that connect everything and form the foundation of network and application monitoring.
Specifically, these parts include switches, routers, and firewalls. You track signs like latency, packet loss, and bandwidth use. For example, tools from Cisco, SolarWinds, and Paessler are widely used as data center network monitoring tools in enterprise environments.
In contrast, application and server monitoring check how your software and hosts perform. You measure response time, error rates, and throughput. You should also track CPU use, memory use, and disk activity. Incident response research shows that teams with well-defined procedures can detect issues up to three times faster than teams without them, making detection as important as resolution. This helps you find issues inside your systems.
These layers work closely together. So, one problem often shows up somewhere else. For example, a busy database can slow your app. Also, network congestion can cause API calls to fail.
To answer, “What caused this slowdown?” you must connect signals across layers. Then you should link each signal to the device or service behind it. As a result, you fix problems faster, reduce downtime, and avoid costly trial-and-error troubleshooting.
Why Unified Network and Application Monitoring Matters
When your monitoring tools work alone, your insights stay limited, which weakens network and application monitoring efforts.
Network teams use one screen, often powered by data center network monitoring tools, while app teams use a different one. So, you miss how systems depend on each other.
A unified monitoring approach gives you clear benefits. It brings all signals into one view. This helps you quickly identify problems and understand their real impact.
Faster root-cause analysis: Correlating metrics across network, server, and application layers reduces mean time to resolve (MTTR). Improved user experience: End-to-end visibility helps identify bottlenecks before they affect customers. Reduced operational friction: Shared context reduces finger-pointing between teams. Stronger SLA and compliance posture: Continuous, correlated monitoring across the stack supports uptime commitments and auditing requirements.
However, correlation alone is not enough. You also need a clear context. You must know what you monitor and why it matters. This helps you link issues to real business impact.
Common Monitoring Challenges in Enterprise IT
Even with modern monitoring tools, enterprises face persistent challenges:
- Tool sprawl: Multiple platforms for network, cloud, and application and server monitoring lead to fragmented visibility. 2. Alert fatigue: High volumes of uncorrelated alerts obscure true incidents. Studies show that up to 40 % of alerts are false positives, causing teams to ignore even critical notifications over time. 3. Complex dependencies: Modern applications have many interdependencies, making impact analysis difficult. 4. Compliance and security concerns: Monitoring data must be retained securely and be auditable. 5. Lack of context: Raw metrics don’t inherently show how infrastructure relates to business services.
These challenges show why better metrics alone cannot deliver effective network and application monitoring. You also need a clear context. You must understand how parts work together. This helps you fix issues faster and with confidence.
Research indicates that after just two hours of continuous noisy alerts, teams’ alert response effectiveness can drop by around 30%, as attention wanes.
How Can I Improve Server and Application Performance Monitoring?
Improvement needs a clear and structured approach. Therefore, you should link performance data to infrastructure details. As a result, this context helps you understand what is happening and why.
- Define the Right Metrics and Baselines
Start by picking key performance metrics for servers and apps to strengthen application and server monitoring across your environment.
Track CPU, memory, throughput, latency, and error rates. Then set baselines, so you spot real change early and identify potential issues before they escalate.
Next, make sure you monitor the right things. Use tools that show what assets you actually have. For example, automated discovery can find servers and app hosts for you.
Also, configuration data can confirm they belong in your monitoring list. This way, you do not miss systems because your inventory is incomplete.
- Use Integrated or Interoperable Monitoring Tools
You may choose one full observability platform or combine best-in-class data center network monitoring tools with application insights.
Or you may use several best-in-class tools. Either way, you should connect data from the network, servers, and apps to enable true network and application monitoring. Then you can spot patterns across layers and act faster.
APIs and middleware links help you do this. They pull more data into your monitoring view. So, you get richer signals and better cross-layer checks.
Also, keep a shared inventory and configuration record. This record should map metrics to known assets. It should also show how those assets connect to each other. As a result, your correlated alerts become clearer and more useful.
- Prioritize Intelligent Alerting
Set automated alerts based on service impact, not just numbers. Focus on what affects users the most. This helps you avoid alerts that do not matter.
Modern, AI-powered analytics can reduce noise for you. These tools learn what normal looks like over time. Then they flag changes that truly matter.
Strong alerts also give clear context. You should know what triggered the alert. You should also know where it happened and why. For example, high latency on a critical server matters more than a simple limit breach.
- Add Dependency and Service Context
Performance data becomes more useful when you link it to business services. You should know which systems support each service. This helps you act faster and with more confidence.
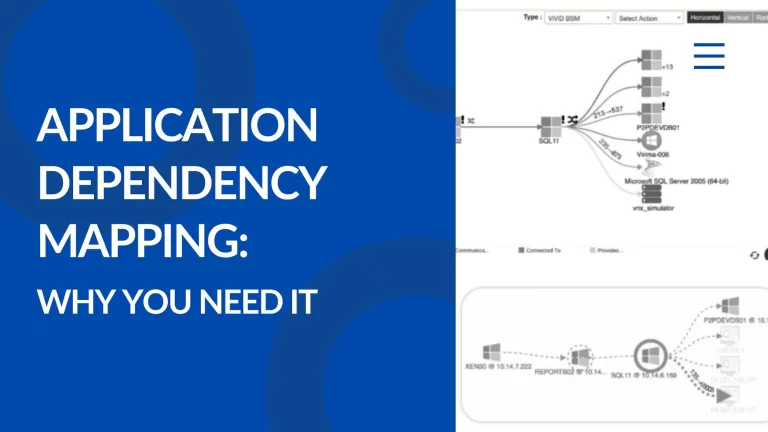
Automated service and dependency mapping shows how parts work together. It creates simple views of servers, apps, and network segments. These views help you see where issues may spread. They also help you answer questions like:
Which services will be impacted if this host fails?
Which network paths are critical for this application?
What upstream dependencies might be causing this symptom?
To map dependencies well, you need more than metrics. You must connect system settings and communication paths. You also need to understand how components relate to each other. This creates service models you can trust.
- Integrate Monitoring with ITSM and Automation
Connect your monitoring tools with your ITSM platform. This lets alerts turn into clear workflows on their own. For example, alerts can create incidents or change requests.
Each workflow should include helpful context. It should show which services are affected. It should also list the right owners. As a result, you respond faster and with fewer mistakes.
Automatic alert handoff to ITSM speeds up incident response across teams. It also improves audits and compliance. Each action now has a clear trail. You can trace every step from detection to resolution.
Choosing the Right Monitoring Tools and Vendors
When you review tools for network and application monitoring, keep a few points in mind. These points help you choose tools that truly support your goals. They also help you avoid gaps later.
Scalability: Can the tool handle your estate’s scale and heterogeneity? Full-stack visibility: Does it facilitate correlating network, server, and app metrics? Interoperability: Can it integrate with your ITSM and asset management layers? Security & compliance: Does it support the controls and reporting required by your industry?
Many trusted vendors focus on different areas, alongside widely adopted open source monitoring options.
For example, Cisco, SolarWinds, Paessler, and Kentik provide leading data center network monitoring tools for enterprise-scale visibility.
For a side-by-side look at dedicated platforms in this space, our guide to network management software covers the top options — from SNMP-based polling tools to CMDB-integrated discovery platforms.
Meanwhile, Dynatrace, New Relic, and AppDynamics provide deep insights for application and server monitoring.
However, tools alone are not enough. Without a shared view of your systems, alerts can feel confusing. You may see warnings but not know what they mean. A clear source of truth helps you turn alerts into action.
This is why strong IT teams go a step further. They add tools that connect signals to services. These tools close the gap between alerts and real impact.
How to Improve Server and Application Performance Monitoring
Performance monitoring works best when you add context. You should connect technical signals to real systems and services. You should also link them to business impact.
This approach turns raw numbers into clear insights. As a result, you and your team can act with speed. You also fix issues with more confidence.
- Define the Right Metrics and Baselines
Start by defining clear KPIs for servers and apps. Track CPU use, latency, error rates, and throughput. Then pair these metrics with a clear view of your systems.
This helps you know exactly what you monitor and why, while also supporting long-term capacity planning decisions.
Virima’s Automated Discovery Engine keeps scanning your environment, including every on-prem and cloud service in use. It finds physical servers, virtual machines, cloud resources, and app parts. Then it sends this inventory into the Automated CMDB tools.
So, your monitoring tools stay aligned with real assets. You do not rely on outdated lists. Because of this, your baselines match reality, not guesswork.
- Use Integrated or Interoperable Monitoring Tools
Most enterprises do not use only one monitoring platform. Instead, you use different tools for network, server, and app performance. This gives you better detail in each area.
However, success depends on shared context. Your tools must share the same view of your systems. Then you can connect alerts across layers and act faster.
Virima’s bi-directional integrations connect events from your monitoring tools into one shared model. When a tool raises an alert, Virima links it to the right CI in the CMDB benefits. It also links that CI to the services that rely on it.
So, you stop seeing alerts as isolated messages. Instead, you get one unified view across teams. As a result, no team troubleshoots alone.
- Prioritize Intelligent, Context-Aware Alerting
Alert fatigue is a common problem in IT teams. When alerts rely only on limits, they create too much noise. This noise distracts you from what truly matters.
Virima places real-time alerts on ViVID™ service maps. So, you can see which alerts affect critical business services. This makes the impact clear right away.
You no longer rank alerts only by technical severity. Instead, you judge them by business impact. As a result, your team focuses on what matters most.
- Add Dependency and Service Context
You may see a latency spike and feel unsure. Is it a network issue or an app issue? Without knowing how systems connect, you cannot answer that.
Virima’s Service Mapping & Dependency Visualization builds real dependency maps for you. These maps show how servers, apps, network devices, and storage work together. They also show how they support each business service.
The maps stay up to date as your environment changes. Discovery and CMDB components automate the capture of those changes. So, you always see the latest connections.
With this context, you can trace problems faster. You can move from symptom to root cause in minutes. Then you fix the right thing, not just the loudest alert.
- Integrate Monitoring with ITSM and Automation
Monitoring must trigger action, not just visibility.
Virima’s native ITSM workflow engine turns alerts into clear records. It can create incident, problem, or change tickets. Each ticket includes the right CI and service context.
So, you do not start from scratch each time. You see what is affected and who owns it. Then you can act faster and with fewer handoffs.
When you fix the issue, you follow the same service model. This model helps guide the right steps. As a result, you close the loop from detection to resolution.
Best Practices for Unified Monitoring with Virima
Unified monitoring is not just about putting everything on one dashboard for infrastructure monitoring.
Instead, it links alerts to what is really happening in your environment. As a result, this helps you act on facts, not guesses.
The strongest teams add context to every workflow. They connect signals to assets, services, and owners. As a result, you move from alerts to action much faster.
- Maintain a Single Source of Truth
With Virima’s Automated CMDB, you record every asset and how it connects to others, including those observed by data center network monitoring tools. The CMDB ( CMDB definition )keeps checking this data against real discovery results. So, your inventory stays current.
This cuts down confusion during incidents. You do not waste time on outdated records. Instead, you trust what you see and act faster.
- Correlate Alerts with Service Impact
Instead of sorting through separate alerts, your team uses ViVID™ overlays. You see events through real-time monitoring right on service and dependency maps. So, you understand what is connected.
Alerts also link to business impact right away. You can see which services are at risk. Then you can focus on what matters most.
- Design and Validate Dependency-Aware Workflows
Service maps should sit at the center of your workflows. Use them in incident, change, and remediation work. Do not treat them like a nice extra.
Also, add dependency details to your playbooks and runbooks. This helps you see what may break when one part fails. As a result, you can plan for failures before they happen.
- Support Compliance and Audit Readiness
You keep monitoring data next to the configuration history. You also store it with change records and incident timelines. So, everything stays linked.
This makes evidence easy to collect. It also makes compliance reports simpler to build. As a result, you spend less time chasing proof.
- Continuously Adapt to Change
Your infrastructure changes all the time. Virima’s Automated Discovery finds new resources as they appear. It also detects configuration changes in near real time.
So, your CMDB software and service maps stay current. As a result, your monitoring matches the environment you actually run today.
Monitoring in Action: Why Context Changes Everything
Imagine a global retailer experiencing intermittent performance slowdowns during peak hours:
Network monitoring devices, powered by data center network monitoring tools, show normal traffic.
Application and server monitoring reports rising response times across checkout services.
Server health looks intermittently stressed
Without a shared view, IT teams face blind spots and start to debate. They argue if the issue is in the network, the app, or the servers. Without context, you get no clear answer.
With Virima:
IT Discovery Engine detects all active components related to the checkout workflow, including cloud-based resources. including cloud instances, databases, load balancers, and dependent microservices.
The Automated CMDB ensures this inventory is accurate and up to date.
Service Mapping renders a near-real-time topology showing how these components support the checkout service.
ViVID™ Overlays visualize alerts from network, server, and app monitoring tools directly on that service map.
Suddenly, you can see the real cause. A database instance sometimes maxes out disk I/O. This slows checkout and hurts response time.
Because alerts include service context, you see the impact right away. You do not chase random symptoms. Instead, you target the database issue and fix checkout faster.
This shows the difference clearly. Isolated metrics give you numbers only. Service-aware insight shows what those numbers mean.
The Future of Network and Application Monitoring
Today, you run hybrid clouds, containers, and cloud native architectures. You also use spread-out systems. Because of this, old boundaries start to fade.
Traditional siloed monitoring cannot keep up with modern Network and Application Monitoring needs.
Separate dashboards and single metrics fall short. You need a connected view to manage modern systems.
The future of monitoring will be defined by:
Service-centric Visibility
Not charts alone, but live, interactive maps of what supports what.
Automated and Context-aware Correlation
Metrics that are anchored to asset and service relationships instead of being treated in isolation.
Integrated Operational Workflows
Where monitoring, change, incident, and problem domains share a common operational foundation.
Virima is built for this future:
Automated Discovery and CMDB create a dynamic operational model. Service Mapping translates complexity into clarity. ViVID™ Overlays bring monitoring events into context. Integrated ITSM Workflows convert visibility into action with audit trails and governance.
Together, these capabilities help you move beyond firefighting. You shift from reacting to planning ahead. So, you spot impact early and reduce risk.
This also helps you stay confident in complex environments. You spend less time guessing. Instead, you keep services steady and reliable.
Achieving 360° Visibility Across Your IT Environment
Improving outcomes from application and server monitoring is not about collecting more metrics. It is about making those metrics meaningful. You need context so you can act with confidence.
When you add asset inventories, config links, and service maps, alerts make more sense. You can see what is affected and why it matters. So, you fix incidents faster and with fewer wrong turns.
This also supports stronger governance. You keep clear records of what happened and what you changed. As a result, you can prove control during reviews and audits.
Modern IT teams add context on top of monitoring data. This context makes metrics easier to understand. It also helps you act faster.
You can add automated discovery to find what you run and can use shared configuration data from many sources. You can also use live service dependency maps to show what connects to what.
When you layer this context over your monitoring stack, metrics gain meaning. So, alerts point to real causes and real impact. As a result, your team spends less time guessing and more time fixing. Next step: Explore how aligning monitoring signals to infrastructure and service context improves performance monitoring outcomes and operational resilience.
Book a free dem o to see how Virima unifies monitoring signals with service and infrastructure context so your team can troubleshoot faster and reduce downtime.