A Practical Guide to Enterprise AI Monitoring and Observability
Updated July 2026: added production failure scenario, drift definitions, hallucination checks, governance framework anchors, and service-context GEO blocks.
Enterprise AI does not fail like normal software. When a server breaks, you see alerts fast. However, AI can look fine while it quietly gets worse. The service stays online, but answers drift. It may also break your rules. Often, you notice only after customers complain or auditors ask.
In fact, by 2026, more than 80% of enterprises are expected to have used GenAI APIs/models or deployed GenAI-enabled apps in production, which makes “quiet failures” a mainstream operational risk, not an edge case, especially when the AI model evolves faster than traditional release cycles.
So, you need AI monitoring and observability, especially in regulated companies that map controls to frameworks such as the NIST AI Risk Management Framework, EU AI Act logging and record-keeping duties, and ISO/IEC 42001 AI management systems.
If your AI talks to customers, guides work, or affects decisions, you must track it. You need more than uptime numbers. You need to know if the AI is safe and correct right now in the real world, not just in test prompts. If not, you need to find what changed and where it started. Identify the impacted teams and services. Plus, you need an audit trail for proof.
What is enterprise AI monitoring and observability?
Enterprise AI monitoring and observability is the end-to-end operational tracking of AI inputs, model performance, output quality, and system dependencies. Unlike traditional IT monitoring that tracks uptime, AI observability detects quiet quality failures such as data drift, hallucinations, and policy violations across complex pipelines.
In this guide, we show you how to monitor AI without creating a new silo. As a result, you can improve data quality issue oversight while keeping visibility unified.
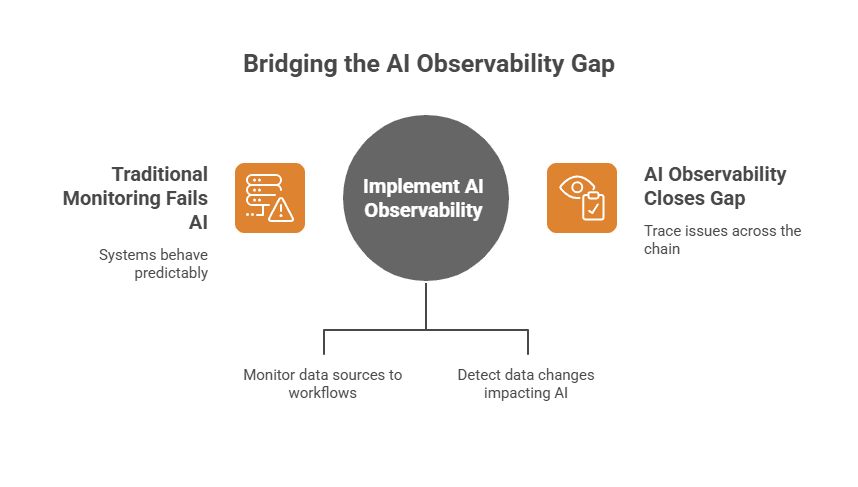
Why traditional monitoring isn’t enough for AI
Most IT monitoring was built for systems that behave the same each time. So, when something breaks, you see clear signs fast.
However, AI breaks in a different way. It can still run and look normal. Yet it may start giving worse results or unsafe answers.
AI can fail “silently.”
A model can keep replying, even as accuracy drops. Also, a generative assistant can sound smooth while being wrong. Meanwhile, a retrieval pipeline can start pulling bad sources.
Yet your dashboards may still look normal. So, you may think everything is fine. However, your customers will feel the problems first. Then your compliance team will ask tough questions.
Here is a common path. A vector store ingests an unannounced schema change from a knowledge source. Retrieval still returns documents on time. Latency charts stay green. The assistant keeps answering in full sentences. Those answers now cite stale change windows and wrong owners. Support volume rises before any red alert fires. Auditors later ask which data shaped the reply. Without lineage and service context, the team cannot show proof fast enough.
AI failures are often “quality” failures, not “availability” failures
Traditional monitoring tracks uptime, speed, volume, and errors. You still need those numbers for AI systems.
However, they are not enough on their own because in incidents, Mean Time to Detect (MTTD) is literally the average time it takes to identify an issue after it occurs, and AI quality regressions often push detection from “tools” to “humans noticing,” often starting with subtle data quality drops.
In AI, the biggest risks include:
- Drift (inputs change, outcomes degrade)
- Bias or inconsistent decisions across segments
- Hallucinations or unsafe content
- Data collection leakage (PII in outputs)
- Policy violations
- Cost spikes (token explosions, retries, runaway calls)
AI is a pipeline, not a service
Production AI is rarely just one model endpoint. Instead, it is a chain of steps across data pipelines and runtime components:
- Data sources → transformations → feature/embedding generation
- Retrieval systems (vector databases, search)
- Orchestration (prompt templates, tool calls)
- Model inference (internal or third-party)
- Guardrails and safety checks
- Downstream workflows and ticketing systems
When something goes wrong, you need to trace the problem across the whole chain, especially upstream data asset shifts that AI for data observability and monitoring is designed to surface. Then you can find where it started and why it spread. That is the gap AI observability helps you close.
What is AI observability in AI monitoring and observability programs?
AI observability gives you end-to-end visibility into your AI system, which strengthens data governance and audit readiness, so decisions remain AI-driven without becoming opaque. It covers inputs, model behavior, outputs, IT operations management, infrastructure, and business results.
So, you can see what is happening. You can also learn why it is happening. Then, you can understand what it impacts.
In an enterprise, AI observability is not just more dashboards. Instead, it gives you the power to:
- Detect issues before customers do
- Reduce mean-time-to-diagnosis (MTTD) and mean-time-to-repair (MTTR)
- Correlate AI behavior to upstream data changes and downstream service impact
- Create audit-ready evidence for compliance and governance – because when things go wrong, the financial impact can be large: IBM reports the global average cost of a data breach reached USD 4.88M (2024).
Monitoring vs. Observability (in practical terms)
| Capability | Monitoring | Observability |
| Primary question | “Is it down?” | “Why did quality change?” |
| Signals | Predefined metrics | Correlated telemetry across systems |
| Best for | Known failures | Novel or multi-causal failures |
| AI effectiveness | Limited | High (drift, bias, safety, lineage) |
You still need monitoring. However, AI also needs observability because AI monitoring and observability must cover both system health and shifting model quality. That is because AI incidents are rarely easy to predict. They often show up in new and unexpected ways.
The five pillars of AI monitoring and observability
A strong program has five key pillars. In fact, the most mature enterprises treat these as must-haves.
1) Data observability (AI for data observability and monitoring)
If your data flow arrives late or is missing, your model can behave differently. This is exactly where AI for data observability and monitoring helps detect issues early. Also, if the data shifts over time, outputs can change. This can happen even when you deploy nothing new.
What to monitor:
- Freshness: Are pipelines arriving on time?
- Schema changes: Did a field change the type of data or meaning?
- Distribution shifts: Are inputs drifting from training baselines?
- Lineage: What upstream system or transformation changed?
- Anomalies: spikes in nulls, outliers, missing segments
In regulated industries, data observability also helps you defend decisions. When someone challenges a model’s choice, you must show what data shaped it. Then you can explain the decision clearly and prove proper control.
Why is data observability critical for enterprise AI models?
Data observability tracks freshness, schema changes, and distribution shifts across data pipelines before inputs reach an AI model. Because upstream data shifts directly cause model drift and hallucination, monitoring data lineage ensures outputs remain accurate, safe, and audit-ready.
2) Model performance and drift
Even when you cannot track “accuracy” all the time, you can still watch warning signs that point to model drift. For example, you can monitor indicators like:
Input (data) drift means live inputs no longer match the baseline the model was built or last validated on. Concept drift means the link between inputs and the right outcome has shifted, so the same features now map to different ground truth. Both can raise risk while uptime stays green.
- Drift scores (input drift, concept drift)
- Confidence trends
- Regression tests against “golden” datasets
- Segment-level trends (region, channel, customer class)
- For LLMs: Relevance/groundedness, hallucination proxies, refusal correctness
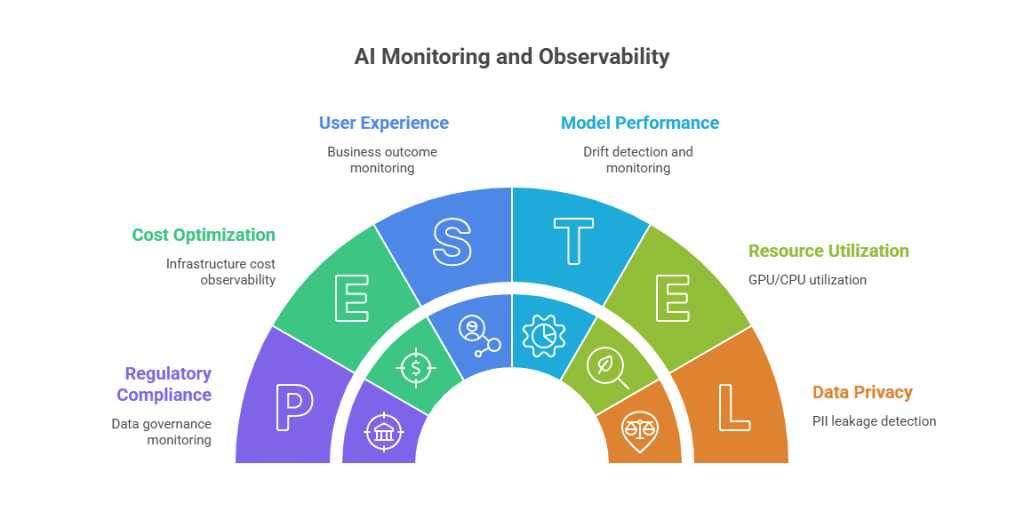
3) Output quality and safety
AI can be fast, stable, and still wrong, especially generative AI systems that sound confident by default.
Monitor:
- Toxicity and unsafe output detection
- Policy violations
- PII leakage in responses
- Hallucination likelihood and grounding checks
- Bias indicators where applicable
This is the foundation of AI governance monitoring in daily operations.
Detecting hallucinations and weak grounding in production
Hallucinations rarely trip classic error rates. The model still returns HTTP 200. The text still reads fluent. Detection needs quality signals, not only availability signals.
Useful production checks include groundedness scores against retrieved passages, refusal correctness on out-of-scope intents, regression packs of golden prompts with known answers, and human spot audits on high-risk intents. Pair those checks with source freshness on the retrieval layer. Many “model” failures start as stale or wrong documents upstream.
4) User experience and business outcomes
Senior IT leaders do not run systems just for “accuracy.” Instead, you run systems to drive real outcomes, such as:
- Self-service resolution rate
- Escalation-to-human rate
- Repeat-contact rate
- User feedback signals and structured feedback loops
- Downstream workflow success/failure
These outcome metrics often show AI problems earlier than technical metrics. So, you can spot issues sooner and act faster.
5) Infrastructure and cost observability
AI introduces a new operational risk: volatility.
Monitor:
- Cost per request / per resolution
- Token usage and prompt size growth
- GPU/CPU utilization by model workload
- Retry storms and timeouts
- Third-party API availability and errors
Cost spikes often point to real system problems. For example, retrieval may be broken. Prompts may loop. Or traffic may route the wrong way.
How do AI systems fail differently than regular software?
A helpful way to align stakeholders is this:
- Software fails loudly; AI fails quietly.
- Software is deterministic; AI can be probabilistic.
- Software failures are binary; AI failures are quality-based.
- Software monitoring tools focus on health; however, AI observability must also include correctness, safety, and governance evidence.
That is why AI teams without observability often learn about issues the hard way. Customers escalate problems first. Or auditors find gaps during reviews. Either way, you pay more to fix it later.
Key enterprise challenges (and what “Good” looks like)
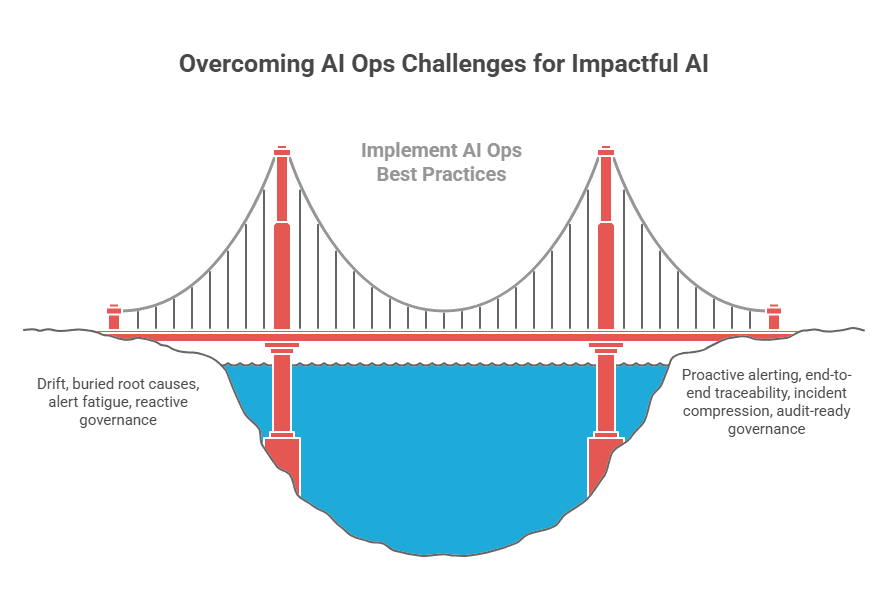
Challenge 1: Drift that doesn’t trigger alerts
Good looks like this: You detect drift early. You also track outcome SLOs that matter to the business. Then you alert on impact first, like “resolution rate is down.” You do not drown teams in noisy telemetry.
Challenge 2: Root cause is buried across the pipeline (hard root cause analysis)
Good looks like this: You trace each request end-to-end. You follow it from the user message to retrieval. Then you track the model step and policy checks. Finally, you confirm what happens in the downstream workflow.
Challenge 3: Alert fatigue gets worse
Good looks like this: You link related signals through correlation. You spot unusual patterns with anomaly detection. Then you compress alerts into one clear incident. So, you get one action to take, not 50 noisy pings.
Challenge 4: Governance is asked for after the fact
Good looks like this: You build governance and change risk controls in from day one. You keep decision traces you can review later, and you track model versions over time. You also store policy logs and proof records for audits.
Can AI observability platforms integrate with existing infrastructure?
Yes, and in an enterprise, integration is not optional. Instead, it’s a requirement when deploying AI into production operations. If a platform can’t integrate, it becomes a silo. As a result, silos create blind spots that stay hidden.
So, you should expect real integration to:
1) APM and tracing integration
AI calls should show up in the same traces as your app requests. For example, this should include things like:
- Retrieval and vector DB latency
- Model call latency + errors
- Token usage + cost attribution
- Guardrail/policy outcomes
- Downstream workflow impact
2) Logging and SIEM integration
Security and compliance teams need safe, controlled access to things like:
- Prompt injection signals
- Suspicious query patterns
- PII exposure indicators
- Output policy violations
- Retained evidence for audit
3) ITSM integration
AI incidents should follow your normal operations process. On the security side, IBM reports that organizations using AI and automation saw time to identify and contain a breach lowered by nearly 100 days on average, a strong argument for end-to-end telemetry + workflow integration.
For example, you should:
- Incident creation + enrichment
- Service mapping and routing
- SLA tracking
- Problem management and corrective actions
4) Service/asset context integration
This is often missing, but it changes everything. It turns raw data into clear action. So, if you want to run AI like any other production system, you need to know:
- Which business service is impacted
- Which upstream assets or data sources changed
- Who owns remediation
- What compliance exposure exists
This is where Virima matters most to you.
How does service context improve AI incident response?
Attaching service context to AI observability alerts connects raw model telemetry to business services, underlying infrastructure, and system owners. This allows IT Ops teams to identify root causes faster, evaluate business risk, and remediate pipeline failures before users are impacted.
Virima and AI observability: Making AI operable inside enterprise IT
Most AI observability tools can show what happened inside the AI pipeline. However, as an enterprise IT leader, you need one more layer:
How does this affect your services and users? How does it change your risk level? Also, does it impact your compliance duties? Finally, what does it change in your daily workflows?
That is the “enterprise context layer.” It often decides if AI model observability really works. Without it, you may end up with another dashboard you do not trust. IBM’s 2024 breach research found ~70% of studied organizations reported operations were significantly or moderately disrupted, which is exactly why service mapping and ownership context matter.
Why Virima belongs in this conversation for enterprise AI applications
Virima is built for enterprise IT visibility, making governance and operations AI-powered without adding chaos. For example, you can see assets, services, owners, and risk in one place.
Because these are the same building blocks you need for AI observability, you can make AI oversight practical and effective. As a result, oversight becomes both actionable and scalable.
1) Turning AI signals into service impact
An alert like “drift increased” is hard to act on. Most IT teams cannot fix it fast.
A Virima-style alert gives you clear context. It looks more like:
- Impacted service: Customer Self-Service Portal
- AI component: LLM Assistant + RAG Retrieval (and evolving agentic IT agents)
- Likely origin: Knowledge base source freshness issue
- Owner: Digital Support Ops / Data Engineering
- Risk note: Customer communications policy + regulated disclosures
That shift moves you from model numbers to real operations. So, you can act faster and fix what matters.
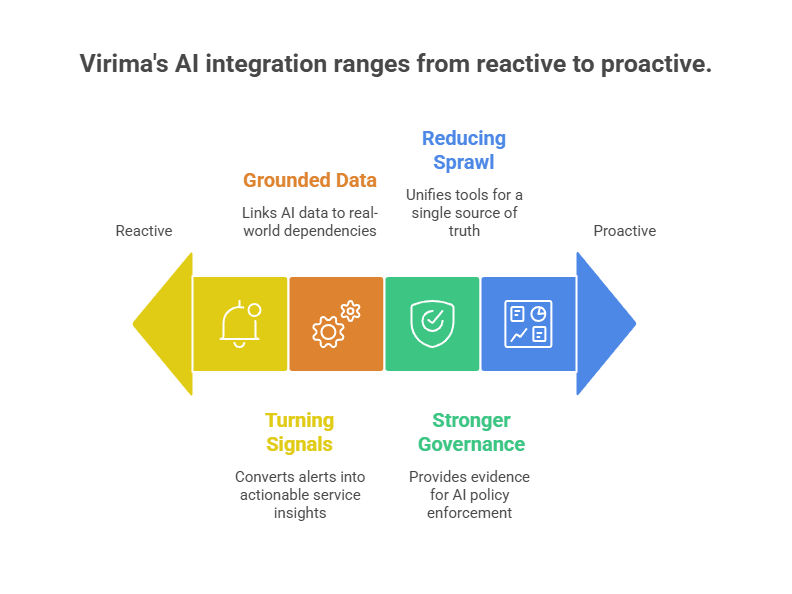
2) AI for data observability and monitoring grounded in real dependency chains
AI data does not live on its own, even when built with open source components across the stack. It comes from your core business systems. For example, it may come from ticketing, CRM, billing, or claims tools. It may also come from medical systems or knowledge bases. So, when a source system changes, your AI can change too. Then outputs can shift, even if you changed nothing else.
An alert like “drift increased” is hard to act on. As a result, most IT teams cannot fix it fast. Instead, a Virima-style alert gives you clear context. It looks more like
- AI component: LLM Assistant + RAG Retrieval (and evolving agentic IT agents)What upstream systems feed this model, and is your CMDB ready for AI agents?
- What changed recently?
- Who owns the source and pipeline?
- What else depends on that data?
That can cut MTTR by a lot. So, you find the cause faster and restore service sooner.
3) Strengthening AI governance monitoring with operational evidence
Governance is not just policy. It is also proof. Virima’s operational discipline helps you build governance with proof. In addition, it helps you connect things like:
- Model version and changes
- Service changes and dependencies
- Ownership and accountability
- Incident records and corrective actions
This is the proof auditors want to see. They do not want “we planned to govern.” Instead, they want “here is what we monitored.” They also want “here is what we detected.” And they want “here is how we fixed it.”
4) Reducing tool sprawl
Your ICP fear is real: you do not want another silo. A silo hides problems until they grow.
Virima helps you fit AI observability into your single source of truth. So, you do not treat AI as a separate, AI-only view. Instead, you connect it to the wider operations picture. Then you can see AI issues in the same place you run everything else.
Bottom line: Virima makes AI observability easier for you to run each day. It also makes it easier for you to govern. And it makes it easier to justify inside your company. This works because Virima ties AI to services, assets, and risk. So, you can see what matters most. Then you can act with clear ownership and clear priority.
SEE THE OPERATIONAL CONTEXT LAYER
When AI quality signals must map to services, owners, and change risk, start with Trusted Runtime Truth. It is the ground layer agentic IT can act on without guessing.
A practical implementation roadmap (for regulated IT ops teams)
Step 1: Start with one high-quality data-impact AI service
Start with the system where failure costs you the most. For example, pick customer support AI. Or choose underwriting triage or fraud scoring. You can also start with clinical classification. Another strong choice is citizen service automation.
Step 2: Define SLOs + governance guardrails for consistent AI development
Examples:
- Hallucination rate below threshold on critical intents
- Resolution rate above target
- No PII leakage
- Response policy compliance above target
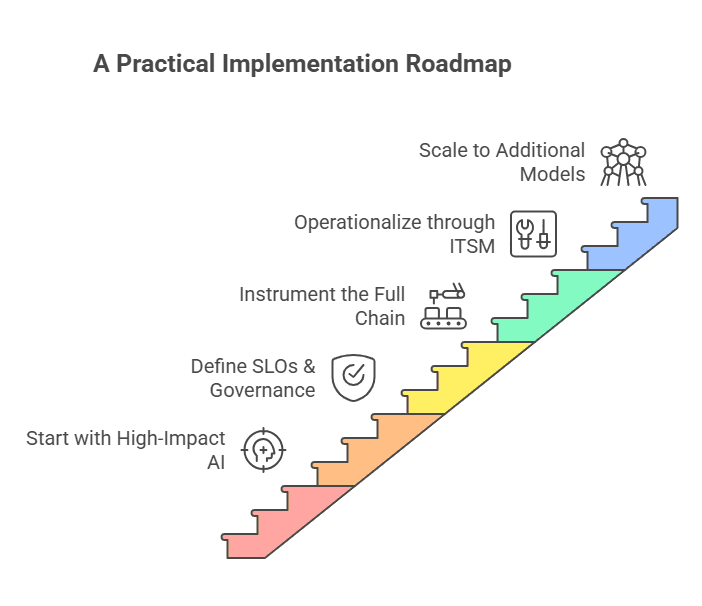
Step 3: Instrument the full chain
Make sure you cover the full chain. Track specific data and retrieval first. Then track the model and guardrails. Also track business outcomes and costs. This way, you can spot issues early and act fast.
Step 4: Operationalize through ITSM and service context
Route each incident to the right owner. Then attach a clear runbook to guide the fix. Also, track every corrective action you take. Finally, create simple monthly governance summaries for leaders and auditors.
If AI incidents must route like any other production event, review how teams cut time-to-restore with incident response and MTTR practices tied to service context.
Step 5: Scale to additional models and teams
Once you can run one system performance well, scaling gets easier, and AI adoption becomes repeatable across teams. Then you can repeat the same pattern across other AI use cases.
AI observability is only valuable if your team can act on it
AI monitoring and observability are not just a tech choice. It is also a step toward stronger operations. In regulated industries, it is also a governance step.
Teams succeed when you do three things well. First, you monitor quality and risk, not just uptime. Next, you integrate with what you already use, like APM, ITSM, and SIEM.
Also, you connect AI signals to enterprise context. That includes services, assets, owners, and compliance exposure. That is the gap Virima helps you close. Virima helps you make AI observability part of daily operations. So, your enterprise AI stays reliable and accountable. And you stay ready for audits.
Frequently Asked Questions
What is AI monitoring, in simple terms?
AI monitoring helps you check that your AI system is running as expected. You track things like latency and error rates. You also watch basic performance signals to confirm it stays within normal limits.
What is AI observability, and how is it different?
Observability helps you understand why AI quality or safety changed. You do this by linking signals across the full chain. You trace data to retrieval, then prompts, then the model. Next, you check guardrails and outcomes.
Why can AI fail quietly?
AI can keep giving smooth answers, even as it gets worse. Accuracy can drop over time. Grounding can weaken, too. Policy compliance can also slip. And none of this has to cause an outage.
What are the most common AI failures in production?
Key AI risks include drift and made-up or ungrounded answers. You may also see bias across user groups. PII can leak, and people can break policy rules. Retrieval can pull outdated or wrong sources. Also, costs can spike without warning.
What is the difference between data drift and concept drift?
Data drift means live inputs no longer match the baseline used to build or validate the model. Concept drift means the relationship between inputs and correct outcomes has changed. Either can degrade quality while classic uptime monitors stay green.