Understanding MTBF vs Service Availability in IT Operations
Service availability is no longer a reliable indicator of reliability.
Most reliability metrics come from small failures repeated at scale: a login that needs a second try, a transaction that times out, a network that drops for two minutes and recovers.
| Quick Summary: MTBF vs service availability is not either-or. They measure different reliability metrics. MTBF (mean time between failures) shows how often failures occur and reflects system reliability. Service availability shows uptime and the amount of downtime users experience. MTTR links them by determining how long each failure lasts, shaping the availability calculation. Virima exists because teams can’t reduce MTTR without system context. When incidents hit, discovery data, CMDB relationships, and service maps. |
Availability metrics barely react to that. They measure total uptime, not how often users get interrupted.
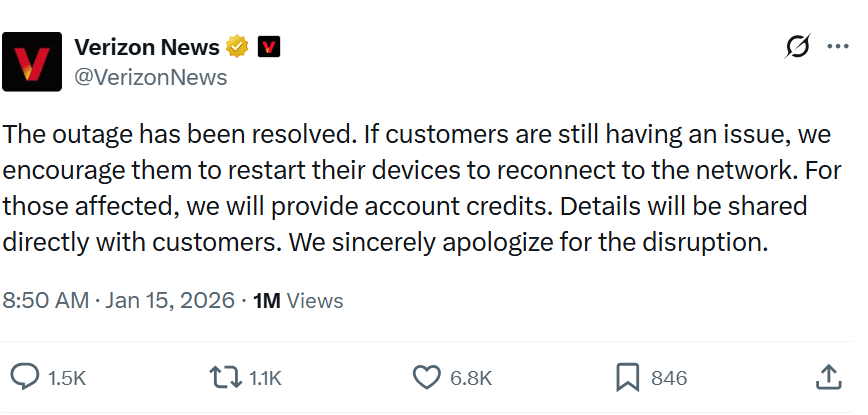
The Verizon outage in January 2026 made the point in public. Service disruptions sent phones into SOS mode. The issue was later linked to software, credits were promised, and service was restored.
That’s where MTBF comes in.
MTBF measures how frequently failures occur. But when combined with availability and MTTR, it provides a complete picture of system health and business goal impact.
Let’s clear the air between MTBF vs service availability and why mixing them up leads teams to optimize the wrong thing.
Why understanding the difference matters
MTBF and service availability are often treated as interchangeable. They aren’t.
- MTBF measures failure frequency.
- Service availability measures user-facing uptime.
Each metric answers a different operational question. When one replaces the other, teams optimize the wrong thing. Reliability reports look healthy while incident management volume rises. SLAs are technically met while customer experience, customer satisfaction, and confidence erode.
Seeing both metrics together is what turns reliability from a reporting exercise into a control mechanism.
Well, this post breaks down:
- What MTBF actually measures and how it’s calculated
- What service availability measures are and how they’re calculated
- How MTBF, MTTR, and availability are mathematically linked
- How Virima helps teams track and improve all three with accurate discovery and service context
Let’s dig in! Definitions below.
What is MTBF (Mean Time Between Failures)?
Mean time between failures (MTBF) is the average amount of time a repairable system or component operates before a failure occurs.
MTBF is about frequency, not impact.
It answers a narrow but important question: how often does this system fail under normal operation? The higher the MTBF, the less frequently failures occur over time.
MTBF is commonly used to:
- Compare reliability across systems or vendors
- identify failure trends
- Support preventive maintenance planning
What it does not describe is what happens after a failure occurs.
| What MTBF tells you | What MTBF does not tell you |
| How frequently failures occur whether reliability is improving or degrading over time when failures are statistically likely to reappear | How long does it take to fix failures how visible failures are to users how much downtime the business experiences Why failures happen |
A system can fail rarely and still be unusable when it does
| How to calculate MTBF MTBF is calculated using a simple ratio. MTBF = total operating time ÷ number of failures Example: A server runs for 1,000 hours in a month and experiences two failures. total time: 1,000 hours total downtime: two hours operating time: 998 hours MTBF = 998 ÷ 2 = 499 hours On average, the server operates for 499 hours between failures. The number looks precise. That’s the problem. |
Why MTBF matters for IT operations
MTBF is most valuable when it’s used as an early signal.
Low MTBF points to instability before outages become prolonged or customer-facing. It helps teams justify redundancy, schedule proactive maintenance, and identify weak components before availability metrics start to slip.
MTBF tells you how often systems break. It does not tell you how painful those breaks are.
That gap is where service availability comes in.
What is service availability?
Service availability measures the percentage of time a system or service is operational and accessible to users.
In reliability discussions, this is the metric most people recognize. Availability is the number that shows up in SLAs, executive dashboards, and uptime reports. It represents uptime measurement, not failure behavior.
Where MTBF focuses on how often failures occur, service availability focuses on how much of that failure translates into downtime. This distinction is at the core of the MTBF vs service availability conversation.
Availability is outcome-focused. It reflects what users experience, not what engineers observe internally.
| How availability is calculated Service availability is calculated as a ratio of uptime to total time. Availability = (uptime ÷ total time) × 100Example: An e-commerce service runs for 30 days, or 720 hours, and experiences 7.2 hours of downtime across several incidents. uptime: 712.8 hours total time: 720 hours Availability = (712.8 ÷ 720) × 100 = 99.0% This availability calculation shows that the service was accessible 99% of the time during the month. What it does not show is how those 7.2 hours were distributed. |
Understanding availability targets and the “nines.”
Availability is often expressed using “nines,” especially in IT service management and SLA reporting.
| Availability | Maximum downtime per year |
| 99% | ~3.65 days |
| 99.9% | ~8.76 hours |
| 99.99% | ~52.6 minutes |
| 99.999% | ~5.26 minutes |
Each additional nine requires significantly more investment in redundancy, monitoring, automation, and faster recovery.
Availability targets are useful benchmarks. They are not a complete measure of system reliability.
| What service availability tells you | What service availability does not tell you |
| How much uptime users experience whether SLA targets are being met The direct business impact of downtime | How often failures occur Whether downtime came from one long outage or many short ones How quickly teams recovered from failures What caused the failures in the first place |
Two systems can report the same availability and behave very differently operationally. This is why availability alone is not enough to evaluate reliability metrics.
To understand why availability looks the way it does, you have to look at failure frequency and repair time.
That’s where MTBF and MTTR come back into the picture.
The relationship between MTBF, MTTR, and availability
At this point, the gap between MTBF and service availability should be clear.
- MTBF (mean time between failures) explains how often failures occur.
- Service availability explains how much downtime users experience.
What connects the two is MTTR (mean time to repair or resolve).
MTTR measures how long it takes to restore a system after a failure. In practice, service availability is shaped by both failure frequency and repair speed.
This relationship is commonly expressed as:
Availability ≈ MTBF ÷ (MTBF + MTTR)
This formula shows why availability is not a standalone reliability metric. It is the result of how frequently systems fail and how efficiently teams recover.
| Looking for more ways to reduce your MTTR? Read this: 8 strategies to get it done quickly |
Worked example: calculating availability using MTBF and MTTR
Consider a web application with the following characteristics:
- MTBF: 720 hours (one failure per month)
- MTTR: 2 hours
Using the formula:
Availability = 720 ÷ (720 + 2) = 99.72%
This means the application is available 99.72% of the time, with approximately two hours of downtime per month.
Now consider a different scenario.
If MTBF stays the same but MTTR increases to four hours, availability drops. If MTBF improves but MTTR stays high, availability still suffers. This is why improving system reliability requires attention to both metrics.
Two paths to improving availability
There are only two ways to improve service availability.
- Increase MTBF by reducing failure frequency
This path focuses on preventing failures.
Common approaches include:
- Using more reliable hardware and software
- Introducing redundancy through clustering and failover
- Strengthening change management to reduce configuration errors
- Performing preventive maintenance before components fail
Increasing MTBF reduces the number of incidents teams have to deal with in the first place.
- Reduce MTTR by fixing failures faster
This path focuses on recovery.
Common approaches include:
- Faster incident detection through monitoring
- Clearer ownership and escalation paths
- Automation for restart, failover, or scaling
- Accurate configuration data to speed up root cause analysis
Reducing MTTR limits how much downtime each failure causes.
Most organizations need to work on both paths. Focusing on only one leads to fragile gains that don’t hold up under real-world conditions.
To make either path work consistently, teams need visibility into what exists, how systems are connected, and which services are affected when something breaks.
That’s where CMDB-driven reliability tracking becomes critical.
How Virima helps track and improve MTBF and service availability
Improving MTBF vs service levels availability in practice is not a tooling problem. It’s a visibility problem.
Teams can’t reduce failure frequency or recovery time if they don’t have a clear, accurate view of:
- What systems exist
- How they are configured
- How they depend on each other
- Which business services do they support
This is where CMDB reliability tracking becomes foundational.
CMDB as the foundation for reliability metrics
Reliable MTBF, MTTR, and availability reporting starts with knowing what you’re measuring.
Virima’s CMDB provides:
- Complete Virima discovery of servers, network devices, databases, storage, and cloud resources
- accurate configuration item (CI) relationships across infrastructure and applications
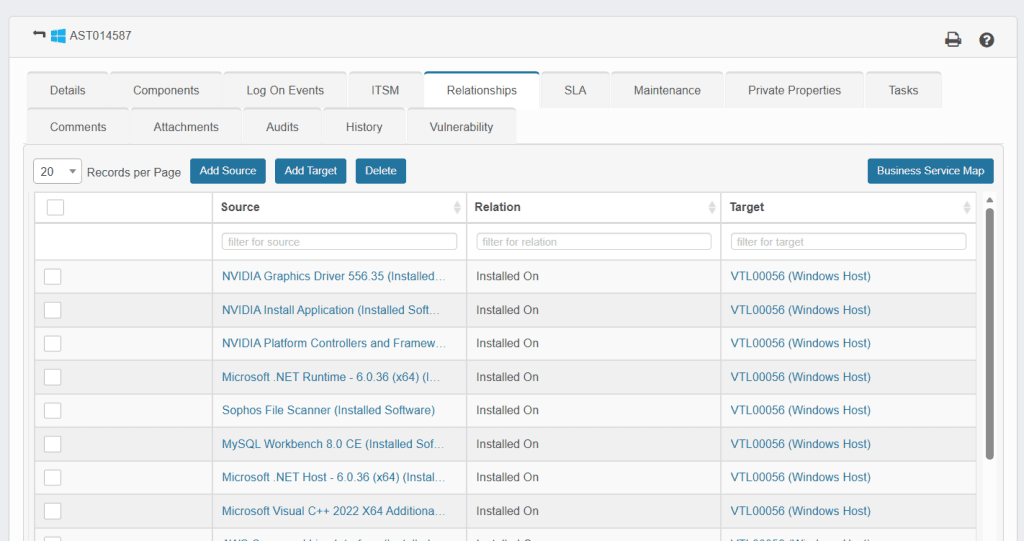
- Historical configuration data to correlate changes with failures
Without this foundation, reliability metrics are incomplete or misleading. Missing components, outdated relationships, or shadow IT distort both MTBF and availability calculations.
With an accurate CMDB database, teams can measure system reliability with confidence.
Business service mapping reduces MTTR
MTTR is heavily influenced by how quickly teams can identify the root cause of an incident and understand its impact.
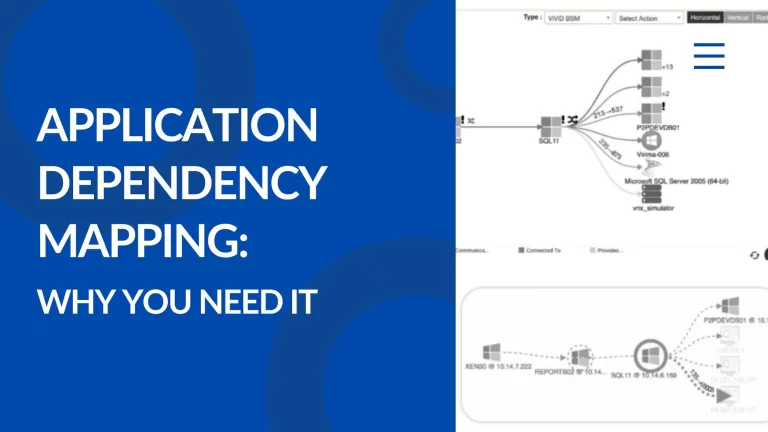
Virima business ViVID service maps provide visibility into how infrastructure components support applications and business services. When an incident occurs, teams can immediately see:
- Which services are affected
- Which components are involved
- Where the failure is most likely to occur
This shortens investigation time and speeds up resolution. Faster root cause analysis directly lowers MTTR and improves service availability
Change management integration reduces failure frequency
Many reliability issues originate from change.
Configuration updates, patches, and infrastructure modifications introduce risk when their impact isn’t fully understood. Virima integrates CMDB data into change management workflows to support:
- Pre-change impact analysis
- Identification of high-risk changes affecting the critical service level agreement
- Post-change validation to confirm expected outcomes
Reducing failed or misaligned changes lowers incident volume, increases MTBF, and improves overall system reliability.
Discovery-driven visibility supports proactive maintenance
Preventive maintenance depends on accurate, current data.
Virima discovery tracks:
- Hardware age and lifecycle status
- Software versions and patch levels
- Capacity trends across compute, storage, and network resources
This enables teams to replace aging components, address capacity risks, and update vulnerable software before failures occur. Proactive maintenance improves MTBF and stabilizes long-term availability.
Integration with monitoring and IT service management tools
Virima integrates with monitoring platforms and IT service management tools to connect events, incidents, and configuration data.
This integration enables:
- Enrichment of incidents with CI context and dependencies
- Automated MTBF and MTTR calculations using incident history
- Availability reporting by application or business service
By combining uptime measurement from monitoring tools with CMDB context, teams gain a clearer view of why availability looks the way it does.
Reporting and dashboards for reliability governance
Reliability metrics only drive improvement when they are visible and actionable.
Virima supports:
- Availability reporting at the CI, application, and service desk level agreement
- Failure trend analysis to identify low-MTBF components
- SLA compliance tracking tied to actual service dependencies
- Identification of untracked or unauthorized configuration items
This gives leadership the insight needed to prioritize investments that improve both MTBF and service availability.
Practical strategies for improving MTBF and service availability
Improving reliability metrics is not about chasing a single number. It’s about pulling the right lever at the right time.
MTBF and service availability improve through different actions. Treating them separately helps teams focus on what actually needs to change.
Improving MTBF by reducing failure frequency
MTBF improves when failures become less common.
Invest in redundancy
Critical components should not exist as single points of failure. Clustering, load balancing, and failover architectures reduce the impact of individual component failures and increase overall system reliability.
Virima business service maps help teams identify where redundancy is missing and where failures would have the highest impact.
Strengthen change management
A large percentage of incidents originate from change. Poorly understood dependencies and rushed updates introduce avoidable failures.
Using CMDB reliability tracking for pre-change impact analysis helps teams understand which services and components are at risk before changes are implemented.
Perform proactive maintenance
Hardware age, outdated software, and capacity exhaustion all increase failure likelihood.
Virima discovery provides visibility into lifecycle status, itsm software versions, and resource trends so teams can act before failures occur.
Reduce unnecessary complexity
More components mean more failure points. Simplifying architectures where possible improves MTBF by design.
Network topology and dependency views help teams identify unused, redundant, or overly complex configurations.
Improving service availability by reducing MTTR
Service availability improves when failures are resolved faster.
Accelerate incident detection
Faster detection shortens downtime. Comprehensive monitoring across infrastructure, applications, and networks is essential.
Integrating monitoring alerts with CMDB context ensures incidents arrive with ownership and dependency data attached.
Streamline incident response
MTTR increases when responders waste time identifying what’s affected.
Virima business service maps allow teams to move directly from alert to impacted service during incidents.
Automate recovery where possible
Manual recovery slows resolution and introduces risk.
Automation for restart, scaling, or failover reduces MTTR and stabilizes uptime measurement across recurring incidents.
Improve knowledge reuse
Repeat incidents often suffer from repeated diagnosis.
Linking resolution steps and known issues to (CIs) in the CMDB reduces investigation time and improves consistency across incident response teams.
Why are both strategies required?
Focusing only on MTBF leads to environments that fail rarely but recover slowly.
Focusing only on MTTR leads to environments that recover quickly but fail too often.
High service request availability depends on both low failure frequency and fast recovery, supported by accurate system data and a clear service delivery context.
That balance is what separates stable environments from fragile ones.
Wrapping up
MTBF vs service availability is not a question of which metric matters more. Each measures a different aspect of system performance.
MTBF shows how often failures occur and reflects underlying system reliability. Service availability shows how much of that failure turns into user-visible downtime. MTTR connects the two by determining how long each failure lasts.
Looking at availability alone can hide rising failure frequency. Looking at MTBF alone can underestimate business impact. Together, these reliability metrics provide a more accurate view of operational risk and service health.
Virima helps IT service management teams improve both MTBF and service availability by providing accurate discovery, CMDB reliability tracking, and business service mapping. This enables teams to prevent failures, reduce MTTR, and measure uptime in the context of real service dependencies.