SLA Monitoring and Reporting: A Complete Guide for IT Teams

SLA monitoring and reporting is the ongoing process of tracking whether IT services meet agreed performance thresholds and communicating that performance to the right stakeholders. Most teams treat it as a dashboarding exercise: configure the metrics, schedule the report, send it on. The problem surfaces when the numbers look worse than expected, or suspiciously better than the reality on the ground.
The gap between what the SLA report says and what actually happened usually traces back to one place: the data feeding the monitoring layer. The tool itself is rarely the problem. This guide covers the metrics that matter, how to structure reports by audience, and the data foundation that makes those numbers accurate.
| What is SLA monitoring and reporting? SLA monitoring and reporting is the ongoing practice of tracking whether IT services meet agreed response, resolution, and availability targets, then communicating that performance to operational teams and business stakeholders. It turns contractual service commitments into measurable operational metrics, giving IT and the business a shared view of whether service standards are being met. |
What SLA monitoring tracks (and what most teams overlook)
SLA monitoring tracks three core dimensions: response time, resolution time, and service availability, measured against agreed targets by ticket priority. Together they show whether IT is meeting its committed performance standards before a breach reaches a customer or an audit exposes a gap.
SLAs define the performance standards IT has agreed to deliver. Monitoring creates a measurement system around those commitments so breaches surface before a customer complaint arrives or an audit exposes a gap.
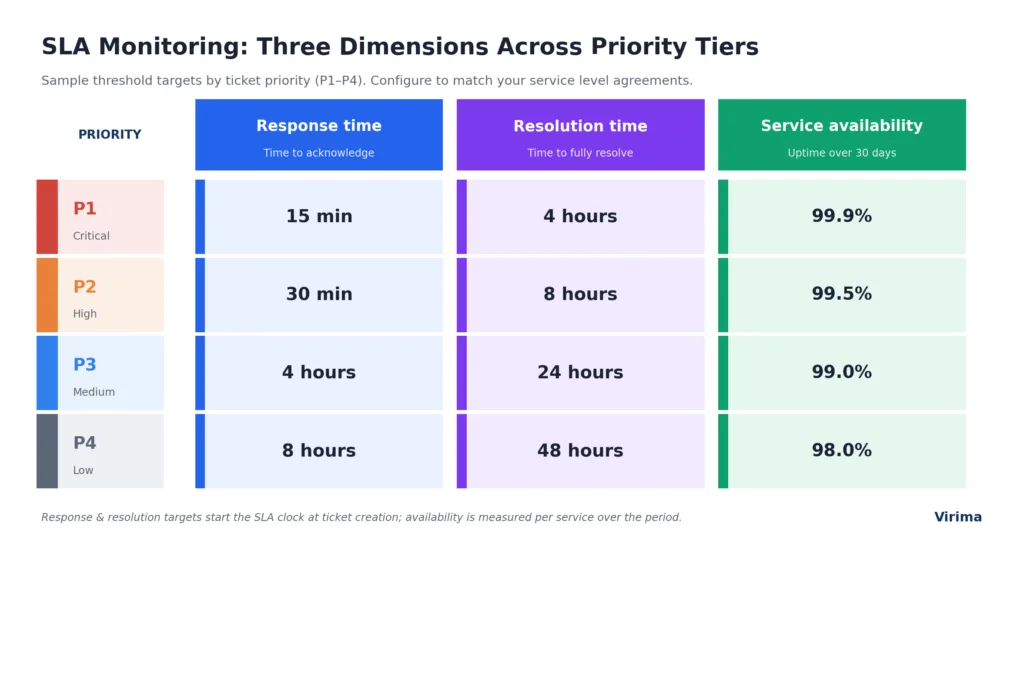
Three dimensions define what SLA monitoring tracks at its core:
- Response time: How quickly the service desk acknowledges a ticket, by priority level. P1 incidents typically carry a 15-to-30-minute response target; P3 service requests may carry four hours or more.
- Resolution time: How long it takes to fully close a ticket. This is the metric that most frequently drives breach notices, because resolution depends on correct routing, resource availability, and accurate CI data in the CMDB.
- Service availability: Whether a given service or application met its uptime commitment over a defined period, usually expressed as a percentage over 30 days.
Beyond these three, mature SLA monitoring frameworks also track:
- SLA compliance rate: The percentage of tickets closed within the agreed timeframe over a reporting period. A 95% compliance rate means 5% of tickets breached their SLA window.
- Near-miss rate: Tickets resolved inside a narrow window before breaching. A rising near-miss rate signals systemic pressure before actual breach numbers start climbing.
- Mean time to repair (MTTR): The average time to restore a service after an outage. Distinct from resolution time, MTTR focuses on service recovery, not ticket closure.
- First contact resolution (FCR) rate: The share of tickets resolved without reassignment. High FCR correlates with better resolution SLA compliance because each reassignment consumes clock time.
The ITSM SLA metrics that carry the most operational weight
The four ITSM SLA metrics that carry the most operational weight are SLA compliance rate, MTTR, breach rate by category, and first contact resolution rate. These correlate directly with service experience and are the ones stakeholders escalate when targets slip.
Not every SLA metric belongs in every report. The ones that carry operational weight are the ones that correlate directly with service experience and get escalated when targets slip.
SLA compliance rate is the primary headline metric in most service reviews. Stakeholders understand it immediately, and it appears in monthly and quarterly service level management (SLM) meetings. Tracking it at the category level (incident vs. service request vs. change) reveals where pressure is concentrated, rather than masking problems inside a blended average.
MTTR matters most to infrastructure and platform teams. When a critical service goes down, stakeholders care how long the outage lasted, not whether the initial acknowledgment met its SLA target. P1 and P2 MTTR should be tracked separately to avoid distorting the overall mean with lower-priority resolutions.
SLA breach rate by category (broken out by service type, support tier, or assignment group) identifies where systemic problems exist. A breach concentration in one assignment group typically points to staffing, tooling, or skills gaps, not a policy-level issue.
First contact resolution rate is a leading indicator. When FCR rises, downstream resolution times tend to improve. When it falls, ticket reassignments increase and every reassignment adds time to the resolution clock.
Atlassian’s ITSM guidance on service level agreements notes that effective SLA monitoring requires clearly defined metrics tied to customer-facing outcomes rather than internal IT workflow steps. Tracking SLA performance by category rather than as a blended average is one of the most practical ways to identify systemic service gaps. (Source: atlassian.com/itsm/service-request-management/slas, Atlassian ITSM)
| What are the most important SLA metrics to track?The highest-weight SLA metrics are compliance rate (percentage of tickets resolved within target), MTTR for P1 and P2 incidents, SLA breach rate by assignment group, and first contact resolution rate. Tracking each by category rather than as a blended average pinpoints where service delivery is breaking down, rather than averaging the problem away. |
SLA breach management: why breaches keep happening (and where the problem actually lives)
SLA breaches most often happen because of stale CMDB data, not slow agents. Incorrect routing, duplicate assignments, and delayed escalations all trace back to inaccurate CI ownership and dependency records. The fix is data accuracy at ticket creation, not more headcount.
When SLA compliance drops, the first instinct is to look at the service desk: were tickets worked slowly? Were there staffing gaps? These are valid questions, but they miss the more common root cause.
SLA breaches in ITSM frequently trace back to incorrect routing, duplicate assignments, and delayed escalations. All three share a common origin: inaccurate or outdated CI data in the CMDB.
This scenario plays out across enterprise service desks regularly: A P1 incident arrives for a business-critical application. The service desk assigns it based on CI ownership recorded in the CMDB. That CI was migrated to a new team four months ago, but the CMDB was not updated. The ticket sits in the wrong queue for 40 minutes before someone notices. The SLA clock ran the entire time.
The same pattern appears in change management. A change touches a CI with undocumented dependencies. The blast radius is underestimated, an unplanned outage follows, and the resulting P1 incident immediately starts consuming SLA time with no routing context available.
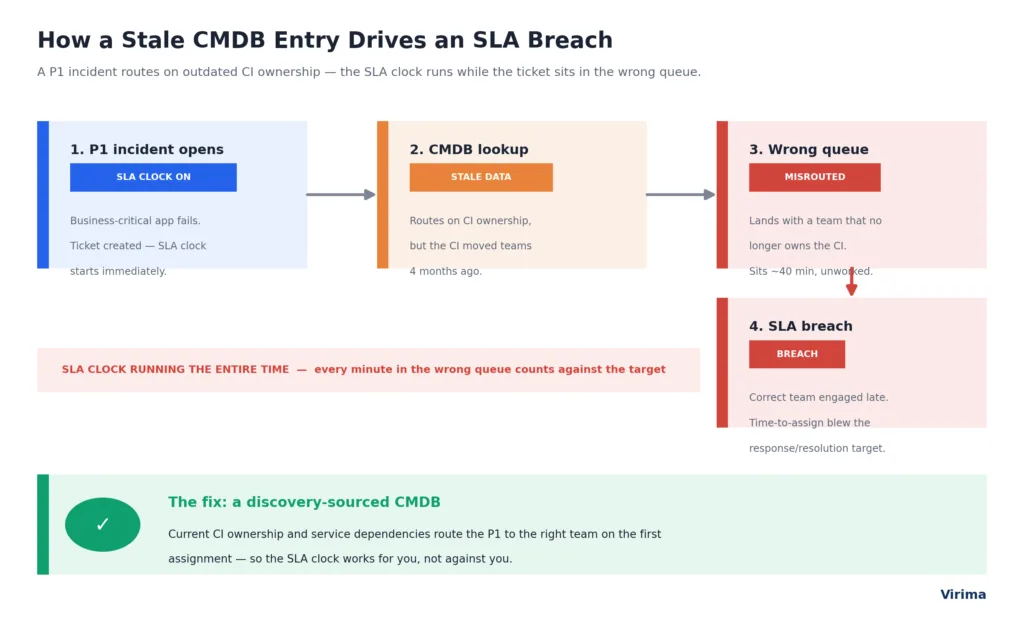
This is where IT discovery and CMDB accuracy become SLA compliance issues, not just data hygiene concerns. A discovery-sourced CMDB surfaces who owns each CI, what it connects to, and how it maps into a business service. That context enables correct routing on the first assignment, which is the single largest lever for improving resolution SLA compliance.
Virima’s ViVID™ service maps show the full dependency chain between infrastructure CIs and the services they support. When an incident opens, teams immediately know which service tier is affected, which SLA clock is running, and who needs to be engaged. When SLA data draws from an accurate CMDB, the reports become auditable and reflect what actually happened, not what the system assumed based on stale records.
See how Virima delivers the Trusted Runtime Truth that makes SLA monitoring accurate.
| How does CMDB accuracy affect SLA compliance?Inaccurate CI ownership records cause incorrect ticket routing, delayed escalations, and wrong priority assignments. All of these consume SLA time before the right team is engaged. Discovery-driven CI data eliminates the manual update gap that allows routing errors to persist across incidents and change events. |
SLA reporting best practices: how to structure reports stakeholders trust
Effective SLA reports split into two types: operational reports (daily or weekly, for service desk managers) and executive reports (monthly or quarterly, for leadership). The same report rarely works for both audiences, because each needs different data at a different cadence.
SLA reports serve two distinct audiences with different needs. Operational teams need to act on the data; business stakeholders need to understand service health. The same report rarely works for both.
Operational SLA reports are generated daily or weekly and reviewed by service desk managers, team leads, and IT operations directors. Executive SLA reports are a form of IT service level reporting delivered monthly or quarterly that frames performance in business terms. Each audience needs a different mix of metrics:
| Operational SLA report (daily/weekly) | Executive SLA report (monthly/quarterly) |
| Open tickets approaching breach, sorted by time remaining | Monthly SLA compliance rate by service tier |
| Breach count by priority and category for the reporting period | Rolling three-month trend line |
| Near-miss breakdown by assignment group | Top three breach categories with a root cause summary |
| MTTR trend for P1 and P2 incidents | Service availability compared to committed uptime percentage |
| FCR rate compared to the prior period | Any agreed exceptions or formally documented deviations |
The reporting cadence matters as much as the content. Operational reports need to be frequent enough to prevent breaches, not just document them after the fact. Quarterly executive summaries give leadership the context to make resourcing and policy decisions. Sending weekly operational data to leadership creates noise without adding decision-relevant insight at that level.
Separating operational and executive SLA reporting is an established ITSM best practice. Operational reports drive daily intervention; executive reports frame performance for quarterly resource and policy decisions. Each audience needs the right data at the right frequency to act on it effectively.
Ready to improve the accuracy of your SLA data at the source? Schedule a demo with Virima to see how discovery-driven CI data reduces routing failures and breach rates.
Connecting SLA monitoring and reporting to your ITSM tool
SLA monitoring runs inside your ITSM platform (ServiceNow, Jira Service Management, Ivanti, HaloITSM, Xurrent, Hornbill, or TeamDynamix), but its accuracy depends on the CI and service-tier data those platforms receive at ticket creation. The ITSM tool applies the rules; the CMDB determines whether they fire correctly.
ITSM platforms apply SLA rules based on CI classification, service tier, and ticket priority at creation. If the CI classification is wrong when a ticket opens, the wrong SLA clock starts. If service tier data is missing, the system defaults to a lower-priority SLA and the potential breach goes untracked.
The connection between your IT asset management data and your ITSM tool is the handshake that makes SLA monitoring accurate. When CI records stay current through discovery rather than manual updates, every ticket gets the correct classification from the point of creation.
Virima integrates directly with ServiceNow, Jira Service Management, Ivanti, HaloITSM, Xurrent, Hornbill, and TeamDynamix to keep CI records, ownership data, and service relationships current in the ITSM layer. SLA rules fire against accurate data from the moment a ticket opens.
| Why does ITSM integration affect SLA monitoring accuracy?SLA rules in ITSM platforms fire based on CI classification and service tier at ticket creation. Stale CI records cause incorrect rule application, meaning the wrong SLA clock starts, or no clock starts at all. Keeping ITSM CI data current through high-frequency discovery cycles eliminates this class of SLA monitoring error at the source. |
Common SLA monitoring challenges and how to address them
The four most common SLA monitoring challenges are misaligned SLA definitions, breach attribution disputes, too many SLAs to track, and reporting gaps during major incidents. Each has a defined fix, and most trace back to either unclear customer-facing outcomes or inaccurate CI data.
SLA data that does not match the service experience
Compliance numbers look acceptable, but stakeholders keep raising quality concerns. This usually means SLAs were written for the wrong metrics: tracking ticket closure time while customers actually care about time to functional service restoration. Aligning SLA definitions to customer-defined outcomes rather than internal workflow steps closes the gap.
Breach attribution disputes
Two teams claim the SLA breach belongs to the other. Without accurate CI ownership and a clear audit trail of ticket assignments, these disputes stall post-incident reviews. Discovery-sourced CMDB data gives the incident record the CI context needed to show where time was spent and which team held the ticket at each stage.
Too many SLAs to monitor meaningfully
Organizations that created a unique SLA per service category often end up with 40-plus SLA rules that nobody reviews in practice. The fix is consolidation: define service tiers (Gold, Silver, Bronze) and apply them by service criticality, rather than maintaining a separate SLA for each configuration item.
Reporting gaps during major incidents
P1 outages generate significant activity in incident management, but that activity often falls outside the standard ticketing workflow. Major incident processes that bypass the normal queue create data gaps in SLA reports. Dedicated major incident SLA reporting, separate from standard compliance reporting, closes this.
| What causes SLA monitoring to produce inaccurate data?Inaccurate SLA data typically stems from stale CI ownership records, wrong priority classification at ticket creation, and manual CMDB updates that lag behind infrastructure changes. High-frequency discovery cycles that keep CI data current eliminate the most common source of SLA monitoring errors before they compound into persistent breach patterns. |
Frequently asked questions about SLA monitoring and reporting
What is the difference between SLA monitoring and SLA reporting?
SLA monitoring is the active, ongoing tracking of whether tickets are meeting their committed response and resolution targets as they move through the service desk. SLA reporting is the retrospective communication of that performance to operational teams and business stakeholders. Monitoring drives intervention; reporting drives accountability and improvement decisions.
What SLA compliance rate is considered acceptable for IT service desks?
A widely used benchmark is 95% or above for P1 and P2 incidents. The appropriate target depends on the commitments in your service level agreements and the criticality of the services covered. Many organizations set higher thresholds (98% or above) for business-critical services and lower ones for low-priority request categories where business impact is minimal.
What metrics should be included in an SLA report?
An SLA report should include SLA compliance rate by category, MTTR for P1 and P2 incidents, breach count by priority and assignment group, first contact resolution rate, and service availability against committed uptime. Operational reports add open tickets approaching breach; executive reports add a rolling three-month trend and a root-cause summary for the top breach categories.
How often should SLA reports be generated?
SLA report cadence depends on the audience. Operational SLA reports should be generated daily or weekly so teams can intervene before tickets breach, while executive SLA reports are best delivered monthly or quarterly to inform resourcing and policy decisions. Sending weekly operational data to leadership adds noise without decision-relevant insight.
Why do SLA breaches keep happening even when teams are actively working tickets?
Persistent SLA breaches often trace to operational friction rather than agent effort: incorrect routing from stale CI ownership data, missing service tier classification, escalation delays caused by unclear dependency context, or ITSM rules firing against outdated CMDB records. The root cause is usually a data quality issue, not a staffing issue.
How does Virima help reduce SLA breaches?
Virima keeps CI data, service relationships, and ownership records in your ITSM tool current through discovery-driven updates. This reduces the routing errors, wrong classifications, and escalation delays that generate SLA breaches. ViVID™ service maps show the dependency chain during incident response, so teams know which service tier is affected and which SLA clock is running from the moment a ticket opens.
Which ITSM platforms does Virima integrate with for SLA management support?
Virima integrates with ServiceNow, Jira Service Management, Ivanti, HaloITSM, Xurrent, Hornbill, and TeamDynamix. In each integration, Virima pushes discovery-driven CI data and relationship updates into the ITSM layer to keep records current, which directly supports accurate SLA rule application and incident routing from ticket creation.
Build SLA monitoring on data you can actually trust
SLA monitoring and reporting is only as reliable as the CI data behind it. Stale ownership records, missing service relationships, and classification gaps all feed into SLA reports as if they were accurate. The breach pattern they create looks like a people problem when it is a data problem.
Discovery-driven CI data is the foundation that makes SLA monitoring work: correct routing from ticket creation, reliable escalation paths, and reports that reflect what actually happened.
Schedule a demo to see how Virima keeps CI ownership and service tiers current, so your SLA clock starts on the right ticket, every time.
Move Faster. Act Safely.