CMDB Automation for Retail Supply Chains in Stockholm: Fixing IT’s Blind Spot

On a Friday evening in July 2021, shoppers across Sweden walked up to Coop tills and self-checkouts that would not take payment. Encryption messages appeared on register displays. Within hours, Coop closed a large share of its roughly 800 stores because customers could not pay. The chain is one of Sweden’s largest grocery retailers, with headquarters in the Stockholm area and stores from Kiruna in the north to Smygehamn in the south. CMDB automation for retail supply chains in Stockholm exists to close exactly that kind of blind spot before it reaches the till.
The trigger was not a direct hit on Coop’s own core data center. It was a supply-chain attack on Kaseya VSA, reaching Coop through Visma Esscom, the supplier managing point-of-sale and related store systems. Cash registers, self-scanning, scales, gates, and in-store payment handling went dark on affected sites. Online stock deliveries were hit as well. Truesec, which supported Coop’s recovery, reported stores beginning to reopen within two days and all stores back within six days. Recorded Future News documented the same pattern the weekend of the outage: an MSP-linked dependency took payment offline at national scale.
This piece does not claim that any retailer lacked a configuration management database, or that any single product would have stopped that malware path. The lesson for retail supply chains run from Stockholm is narrower. When store systems, distribution-center equipment, and third-party operators sit outside a maintained configuration and dependency record, leadership learns what the estate depends on after revenue stops. That pattern is the same class of unknown dependency risk CTOs already price into release and change decisions. CMDB automation is built to close that blind spot before the next peak, not after the tills freeze.
Stockholm is a real hub for the problem, not a keyword add-on. Global retail groups headquartered there, including H&M Group, run multi-market store and logistics estates that mix HQ systems, regional DCs, mixed store ownership models, and long vendor chains. The same dependency pattern appears whenever peak capacity, cold-chain sensors, or a self-checkout wave lands faster than the inventory of record can absorb it.
What is CMDB automation?
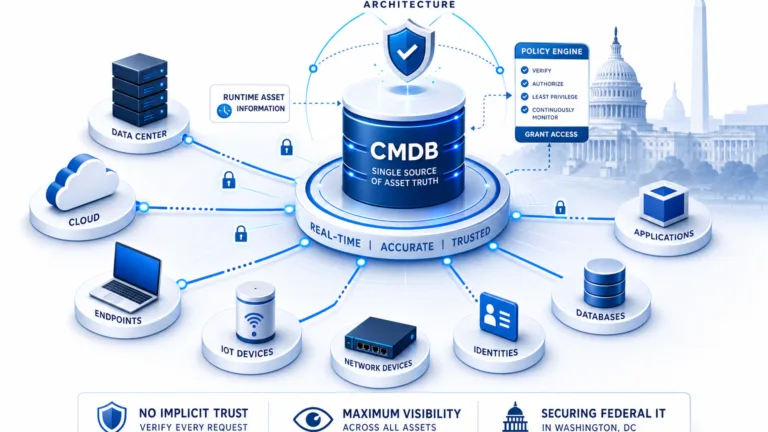
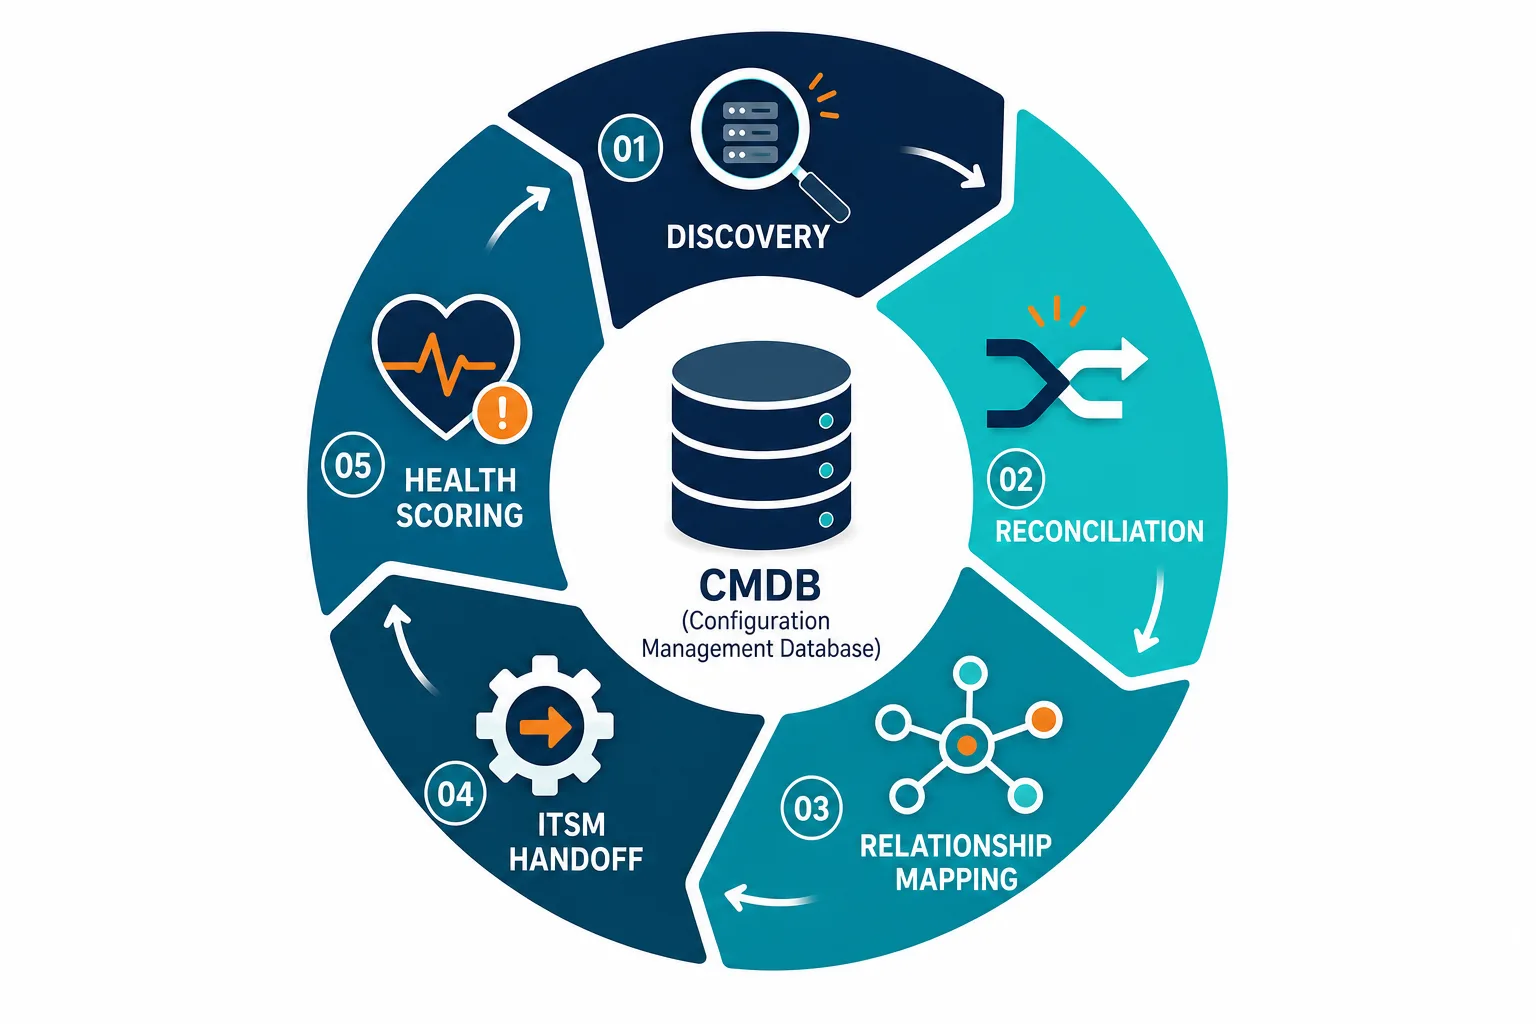
A configuration management database (CMDB) holds configuration items (CIs): the servers, network devices, applications, cloud resources, and related objects IT needs to run services safely. CMDB automation keeps that inventory and its relationships current through scheduled discovery, multi-source reconciliation, relationship mapping, and handoff into IT service management (ITSM) workflows, rather than through spreadsheet imports and tribal memory.
NIST’s security-focused configuration management guidance, SP 800-128, treats configuration management as a control discipline: identify what must be controlled, establish baselines, monitor for change, and remediate drift. Retail supply-chain IT inherits the same logic at store and DC scale. If the baseline is incomplete, every change window and every vendor outage inherits that gap.
Automated CMDB work usually covers five linked jobs:
- Discovery that finds devices and software across store segments, DC networks, and cloud accounts on a high-frequency schedule
- Reconciliation that merges overlapping records from agent, agentless, cloud API, and ITSM sources into one CI identity
- Relationship mapping that records how POS, payments, warehouse controllers, and HQ apps depend on each other
- ITSM integration that feeds change, incident, and asset processes with the same CI truth
- Health scoring that flags stale, incomplete, or conflicting CI data before an audit or peak weekend
When the ITSM CMDB module stops matching the store floor
Many retail IT teams already own a CMDB module inside their ITSM suite. The gap is rarely an empty database. It is the rate at which the estate changes relative to how often that database is refreshed.
| Retail change | What usually happens without automation | What the CMDB misses |
|---|---|---|
| New self-checkout kiosk mid-rollout | Asset tag entered once; network and payment path assumed | Kiosk CI without parent store, switch, or payment gateway links |
| Cold-chain IoT sensors added at a DC | OT team tracks sensors in a separate list | Sensors never join the IT CI graph used for change impact |
| Temporary 3PL / peak-season systems | Vendor VPN and jump hosts under a project ticket | Time-boxed CIs expire in chat, not in the CMDB |
| Store closure or relocation | Hardware retired in finance; DNS and firewall rules linger | Ghost CIs and live paths that still carry traffic |
| Third-party MSP integration (Coop pattern) | Contract names the MSP; map stops at “vendor” | No CI path from till to MSP tooling to payment availability |
When those rows stay manual, the CMDB remains a project artifact. Discovery and reconciliation turn it into an operational control for the supply chain’s IT layer.
Why CMDB automation retail programs matter for global supply chains
Retail supply chains fail in public. A dark till is visible in the aisle. A stalled DC gate backs trucks onto the yard. A payments path that depends on an MSP tool is one commercial thread stretched across hundreds of stores.
ITIC’s 2024 Hourly Cost of Downtime survey (Part 2) reports that 97% of large enterprises with more than 1,000 employees put average hourly downtime above $100,000, and that 41% put hourly cost between $1 million and over $5 million. For top verticals that include retail, ITIC states that average hourly outage costs topped the $5 million mark. Those figures exclude litigation, fines, and goodwill credits. They still understate brand damage when stores close on a summer weekend.
Unmapped dependencies turn a vendor-side outage into an unplanned, multi-hour store closure — the exact cost this section’s ITIC figures describe. That is why automated CMDB retail stores programs treat dependency mapping as a revenue control, not a documentation project.
CISA Binding Operational Directive 23-01 treats accurate, up-to-date asset accounting as a prerequisite for vulnerability detection. Retail is not a federal agency, but the control logic travels: you cannot defend, patch, or isolate what you cannot list with owners and paths.
Five failure modes retail IT keeps relearning
1. Store-level drift
Each store is a mini estate: POS, self-checkout, Wi-Fi, local servers, payment terminals, handhelds. Roll-outs land store by store. Without scheduled discovery, the HQ CMDB holds last quarter’s standard image while the floor holds this week’s exception.
Result: Change packages designed for the “standard store” break on the non-standard store first.
2. Unmapped vendor dependencies
MSPs, payment processors, 3PLs, and SaaS tools sit on the critical path for open-for-business. Contracts name the vendor. The CI graph often stops at a generic external node.
Result: A vendor outage looks like a mysterious local till failure until the dependency path is rebuilt under pressure.
3. Peak-season scale-up without discovery
Campaign weeks add temporary capacity: extra handhelds, pop-up lines, short-term cloud burst, seasonal devices. Projects track the spend. Discovery does not always track the CIs.
Result: Capacity appears in the yard and disappears from the inventory of record on the same calendar.
4. IT and OT tracked separately
Warehouse automation, refrigeration controllers, and yard systems are often owned by facilities or OT. IT owns laptops and the ERP edge. The two inventories rarely share identity rules.
Result: A maintenance window on OT gear surprises IT services on the same plant network, and the reverse.
5. Manual reconciliation at multi-market scale
Stockholm HQ teams supporting Nordic plus wider markets face timezone-skewed imports, partner-format CSVs, and naming collisions across banners — analysts end up spending the week merging rows instead of clearing health exceptions before the next release train.
These modes are why CMDB automation for retail supply chain in Stockholm is an operations and revenue control, not a documentation hobby.
What an unmapped dependency costs retail supply chains
For Leadership
Board language starts with availability and third-party risk. If payment or fulfillment depends on a supplier tool chain you cannot draw on one page, vendor risk is open-store risk. ITIC’s retail-inclusive downtime bands show why a multi-hour regional outage is a P&L event, not only an IT ticket backlog. Leadership also pays twice when the same unknown asset shows up in a security review and again in a change failure: once as incident cost, again as delayed programs that cannot trust the baseline.
Vendor consolidation stalls for the same reason. You cannot retire overlapping monitoring or RMM tools if you cannot prove which store services still hang off each one. Virima blog post on tool consolidation and CMDB visibility covers the pattern in more depth.
For Ops Teams
Ops cost shows up as hours. Someone rebuilds the store CI list from asset tags, DHCP logs, and the last MSP export. Someone else rebuilds it after a remodel. Incident bridges burn the first hour on “which CI is this?” instead of “what do we isolate?” CMDB owners become the most-questioned people in the room when a change takes down a lane that was never on the impact list.
Health scoring matters more than vanity completeness percentages. A CI that is complete but six weeks stale is still a bad input for a Friday night change. Before You Run AI Agents on ServiceNow, Answer These 5 Questions About Your CMDB walks through how teams typically define that staleness threshold.
For Global Operations at Stockholm Scale
Stockholm HQ patterns amplify both problems. One banner may run mixed ownership models with different MSP footprints. Another market may keep local payment acquirers. DC automation vendors differ by country. Without automated multi-source reconciliation, each market becomes its own CMDB dialect, and retail supply chain CMDB Stockholm programs inherit whichever dialect the last import used. Cross-market programs then ship with impact analyses that only cover the HQ lab.
That is the scale tax on manual CMDB work: every new market multiplies reconciliation load instead of reusing a governed CI model.
How CMDB automation fixes this
Automation does not replace ITSM judgment. It replaces the delay between estate change and CMDB truth. Three mechanisms do most of the work.
1. Discovery-driven population
Modern discovery combines several methods: agent-based inventory on managed endpoints, agentless credentialed scans for network and server classes, SNMP and related protocols for network and many warehouse devices, and cloud APIs for AWS and Azure estates that back HQ and digital channels. High-frequency scheduled runs pick up new kiosks, relocated store servers, and cloud resources without waiting for a project close-out form.
Retail estates change faster than quarterly or project-based CMDB updates can track — new kiosks, temporary peak-season devices, and store relocations happen weekly. High-frequency scheduled discovery across agent, agentless, and cloud-API methods keeps store dependency mapping CMDB records aligned with what is actually running on the floor, not what was true at last audit.
Virima’s IT discovery approach is built around that multi-method model so store, DC, and cloud layers can feed one CI set. The same automation patterns that stop CMDB decay after cleanup projects apply here: discovery has to own population, or the next store wave undoes the last spreadsheet load.
2. Multi-source reconciliation and CI health scoring
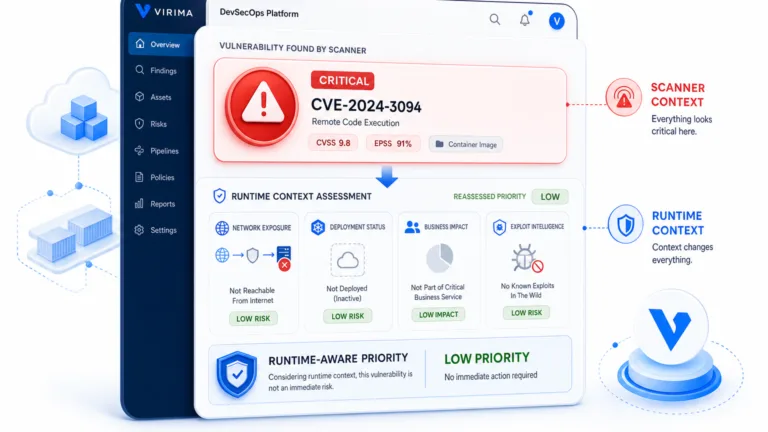
Retail estates always have more than one source in practice: ITSM, MDM, cloud consoles, MSP portals, finance fixed assets. Automation has to match identities, prefer authoritative fields per attribute, and quarantine stale sources. Health scoring then surfaces missing owners, missing relationships, and age thresholds so ops clear exceptions on a cadence instead of during an outage. Field-level authority rules matter when the MSP portal, the ITSM import, and last night’s scan all disagree on the same store server.
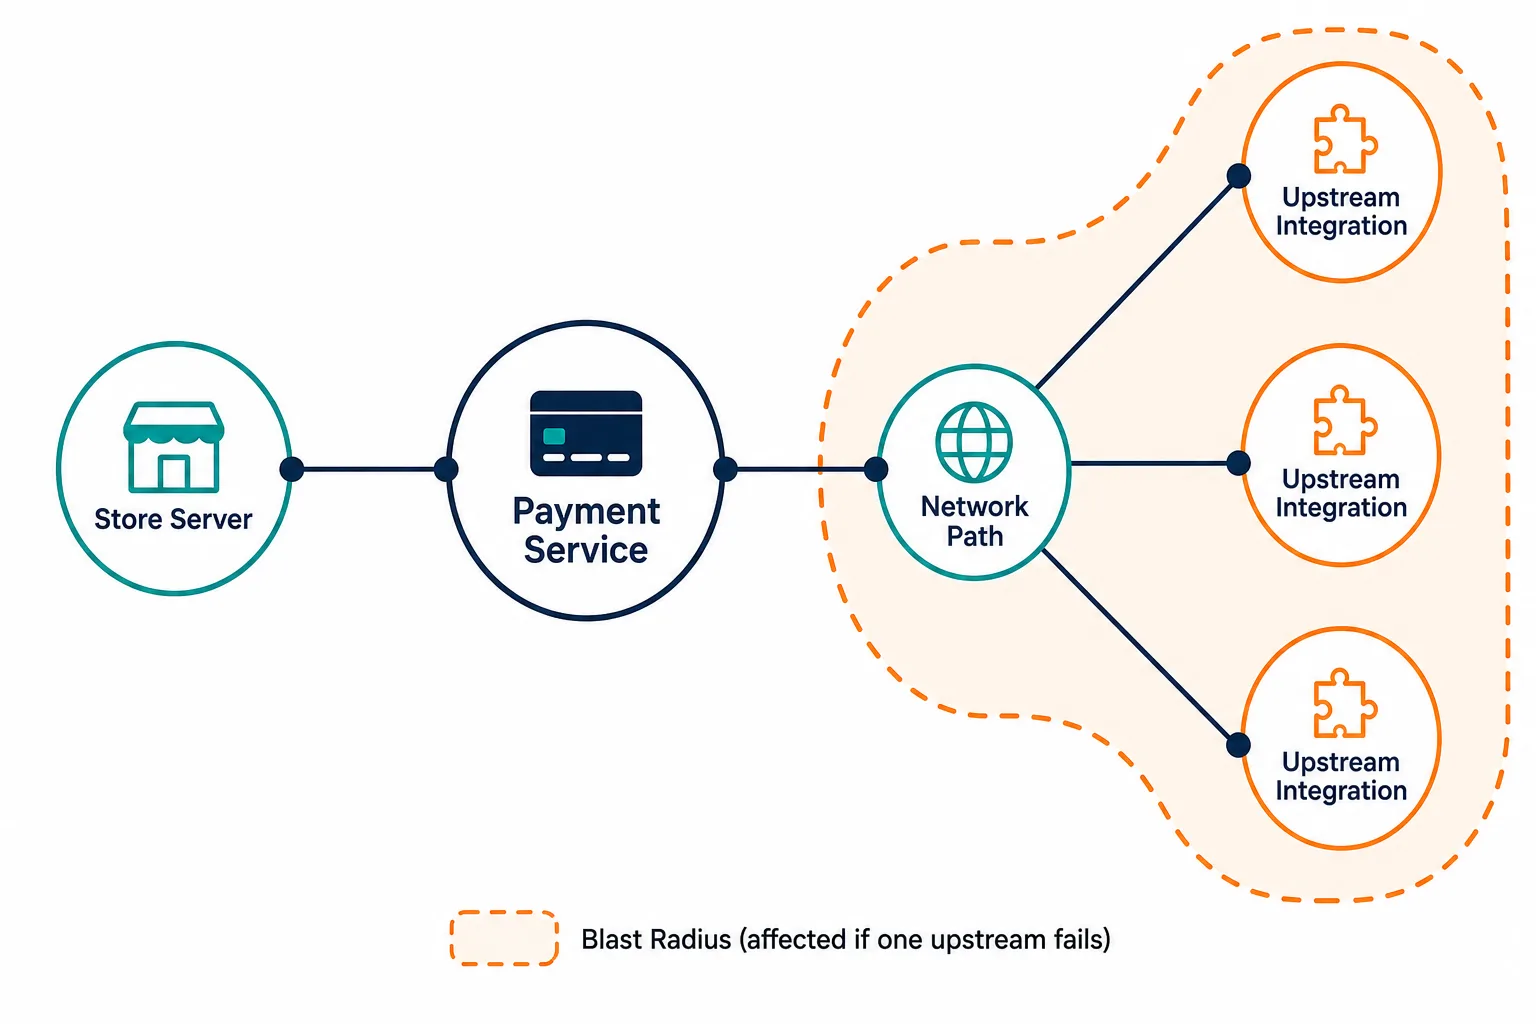
3. Dependency mapping for blast radius
Once service definitions are provided (manually, by import, or via architecture tools), automated map building can show how a payment service rides on specific store servers, network paths, and upstream integrations. That is the direct answer to the Coop-pattern question: if this MSP-linked CI fails, which stores and which business services go dark?
ViVID™ service maps build those application-to-infrastructure visualizations from defined services and discovery-fed relationships, so change and incident teams see impact paths — and cut MTTR — instead of guessing from tribal knowledge. Service composition still has to be defined by the business; the automation is map building and refresh against live infrastructure, not inventing which apps make up “store open” without that input.
Manual vs. automated on the same retail scenarios
| Scenario | Manual CMDB habit | Automated CMDB habit |
|---|---|---|
| Self-checkout roll-out | Spreadsheet of serials after go-live | Discovery registers kiosk CIs and links during the wave |
| Cold-chain sensors at a DC | OT list stays offline from ITSM | Scheduled discovery brings addressable devices into CI classes with owners |
| Peak 3PL systems | Ticket closes; CIs forgotten | Time-bounded CIs with last-seen and relationship signals |
| Store relocation | Finance retires asset; DNS remains | Last-seen and network discovery flag ghost paths for decommission |
| MSP payment stack | Vendor name in a contract field | CI relationships from store payment service to MSP-managed components |
CMDB automation examples in practice
These are illustrative operating patterns, not named Virima customer case studies.
A distribution center onboarding cold-chain sensors. Facilities installs a new sensor mesh on the refrigerated dock. Without automation, IT learns about the gear when a firmware push collides with the WMS edge network. With scheduled discovery and shared CI classes, sensors appear as managed CIs with owners before the first maintenance window, and service maps can show which fulfillment services share the plant segment.
A self-checkout wave across a Nordic banner. The program office tracks install counts. Discovery tracks what is actually online, which payment client version is present, and which store switch each lane hangs from. Failed stores stop being mystery exceptions and become concrete CI gaps.
A peak-season 3PL burst. Temporary handhelds and a vendor VPN land for eight weeks. Automated last-seen and relationship rules keep temporary CIs visible for the season and flag them when traffic stops, so winter does not inherit summer’s attack surface.
A store closure in Greater Stockholm. Hardware returns to the depot. Automated discovery and IT asset lifecycle fields show which identities, certificates, and firewall objects still claim that site, so decommission is a checklist against live data.
Before a cutover, an MSP tooling change on the payment path works the same way: dependency maps list store services that still traverse the old tool, so the change calendar stops treating a vendor upgrade as a black box. For teams that want the product view of how those maps stay tied to infrastructure, see Virima service maps.
How Virima powers automated CMDB retail stores programs
Virima is a discovery-sourced CMDB and service-mapping layer for hybrid estates. For retail supply chains run from Stockholm, store, DC, HQ, and cloud inventory can feed one operational record that ITSM teams already use.
Immediate operational impact
- High-frequency scheduled discovery (agent, agentless, and cloud) reduces lag between a floor change and a CI update
- CI population and relationship updates cut hours spent rebuilding store lists from exports
- Health scoring gives CMDB owners a queue of stale and incomplete records
- Cybersecurity Asset Management (CSAM) context on the same inventory helps security and ops argue from one asset list when unknown devices appear on store or DC segments
Longer-term accuracy
- Multi-source reconciliation keeps ITSM CMDB records aligned with what discovery still sees
- ViVID™ maps stay useful for change impact when infrastructure churn is constant
- IT asset lifecycle fields support store hardware and POS fleet decisions that finance and ops share
Accuracy also shows up in quieter work. Peak planning stops arguing about whether the handheld count is finance’s number or the store manager’s number. Change advisory packets stop attaching last quarter’s topology PDF. Security reviews start from the same CI population ops used on the last failed-change postmortem. Those are not soft benefits. They are hours returned every week in a multi-banner estate.
Integration with existing workflows
CMDB automation does not mean replacing ServiceNow or Jira Service Management — most retail IT organizations will not rip out ServiceNow, Jira Service Management, or Ivanti to fix inventory. Virima is designed to feed those systems discovery-sourced configuration and dependency data rather than replace the service desk. The desk still owns tickets, workflows, and approvals. Discovery owns what exists and how it connects. Partner names stay plain text on purpose so the article does not turn into a deep-link farm. When you need the connector catalog in one place, use the integrations hub. Teams already running ServiceNow CMDB programs can pair discovery authority with established CMDB governance practices without pretending the ITSM platform invents runtime inventory on its own.
Warehouse and plant parallels matter for DC work. Retail OT and IT boundary problems rhyme with manufacturing IT/OT convergence, and agentless methods remain useful for network-visible warehouse equipment when agents are not practical.
Product boundaries stay honest: Virima does not replace your ITSM, payment processor, or OT plant historian. It supplies discovery-sourced CI and dependency truth those tools need. Discovery runs on high-frequency schedules; it is not passive continuous or event-stream real-time monitoring.
Moving from manual, store-by-store tracking to automated CMDB
Before and after
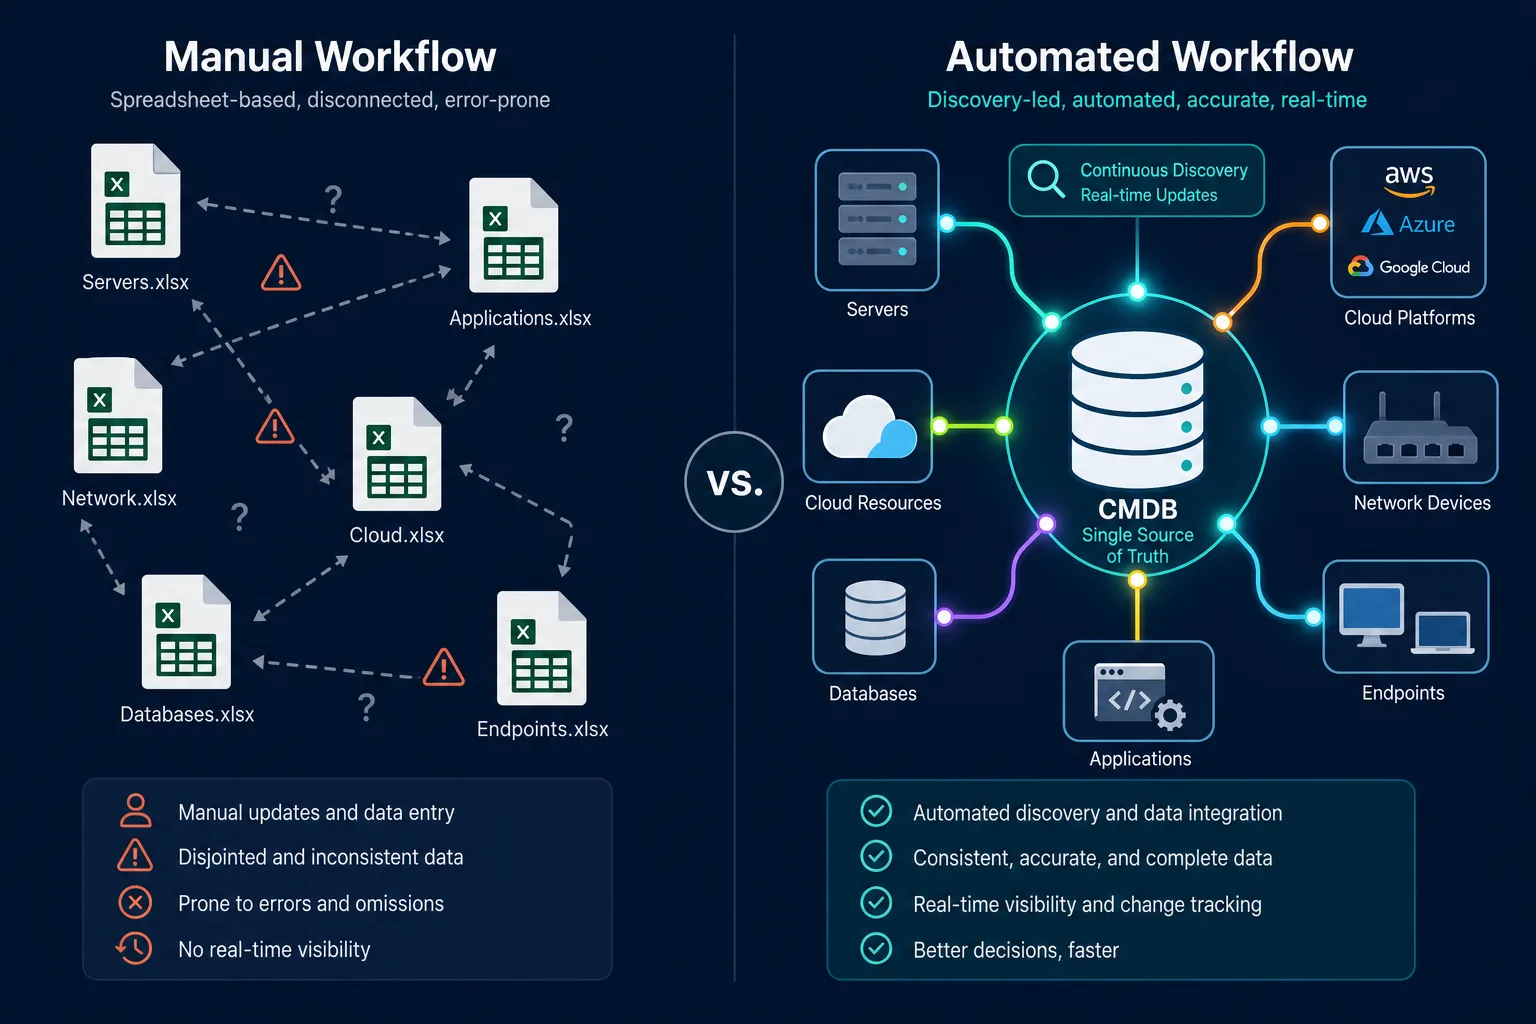
| Dimension | Before (manual / import-led) | After (discovery-led automation) |
|---|---|---|
| Store inventory | Spreadsheet per wave | CI classes refreshed on schedule |
| Vendor dependencies | Contract folder + tribal map | Relationship CIs on payment and fulfillment paths |
| Peak capacity | Project tracker only | Temporary CIs with last-seen signals |
| Change impact | Best-effort list from last audit | Map-backed blast radius for named services |
| Ops time | Weekly merge of CSVs | Exception queue from health scores |
Benefits cascade
- Fewer surprise store closures from unknown paths, dependencies are listed before the vendor event, not after.
- Faster incident and change work, bridges start on the right CI and service, which is where downtime cost compounds for multi-market retail estates.
- Cleaner multi-market governance from Stockholm HQ, one reconciliation model scales better than one spreadsheet dialect per country.
Getting started in five steps
- Map CI classes across store, DC, HQ, and vendor layers, decide what must exist as a CI before tooling arguments.
- Deploy retail IT discovery CMDB coverage including OT/IoT-addressable classes where safe and authorized, cover agent, agentless, SNMP, and cloud APIs on a high-frequency schedule.
- Reconcile against the existing ITSM CMDB, set identity match and field authority rules so imports stop fighting discovery.
- Layer ViVID™ starting with vendor-linked business services, define payment, fulfillment, and store-open services first; let maps build from those definitions plus discovery relationships.
- Establish a governance cadence, weekly health-score review, owner attestation on critical CIs, and decommission checks tied to store and DC lifecycle events.
None of those steps require a big-bang cutover. They require treating the CMDB as a living control for retail supply-chain IT, the same way inventory accuracy is treated for merchandise.
The sequencing also protects credibility with leadership. Start with the CI classes that protect open-for-business (payment, store servers, MSP-linked components, DC controllers gating outbound flow). Prove health-score clearance on that set for two discovery cycles. Only then expand to lower-risk classes such as digital signage or back-office print. That order keeps the program from looking like a multi-year CMDB rewrite while stores still run on tribal maps.
For the broader case that automation and AI-assisted ops need live, explainable estate truth underneath them, see Trusted Runtime Truth.
Close the blind spot before the next peak
Stockholm’s retail supply chains already automate planning, warehouse flows, and store operations. The remaining blind spot is the configuration and dependency layer those automations run on. When that layer is manual, the business discovers its critical paths in the middle of a closed-store weekend. When discovery, reconciliation, and service maps keep the CMDB honest, ops and leadership share one picture of what a store needs to stay open.
A practical next step is to pick one banner or one DC corridor and measure three baselines before tooling debates expand: percentage of store CIs with an owner, percentage of payment-path CIs with a mapped upstream dependency, and median age of last successful discovery for store servers. Those three numbers usually expose whether the problem is missing discovery coverage, weak reconciliation, or missing service definitions. Fix the weakest number first. Expand only after health scores stop bouncing after each roll-out weekend.
Keep the pilot scope honest. Do not promise a single quarter will remap every franchise variant and every 3PL path across all markets. Promise a measurable lift on the payment and store-server classes that close tills when they fail. Publish the before and after health scores to the same leadership forum that reviews peak readiness. That habit turns CMDB automation from a side IT project into a supply-chain control with a named owner.
If the pilot clears those scores, the next expansion is usually DC controllers and temporary peak CIs, not a sudden attempt to model every SaaS planning tool in the estate. The CMDB earns trust by staying accurate on the paths that stop revenue, then growing outward. That is the same discipline retail already applies to merchandise inventory accuracy and it is the practical shape of CMDB automation for retail supply chain in Stockholm: three numbers, one weakest link fixed first, and a governance habit that outlasts any single pilot.
For the product path that holds that inventory and relationship layer, see Virima CMDB.
Frequently Asked Questions
What is CMDB automation?
CMDB automation keeps configuration items and their relationships current through scheduled discovery, multi-source reconciliation, dependency mapping, ITSM handoff, and health scoring, instead of relying on manual imports and tribal updates after each store or DC change.
Why does CMDB automation matter for retail supply chains?
Store payment, fulfillment, and peak capacity depend on IT and vendor paths that change faster than spreadsheets. Without automated inventory and dependency truth, outages and change failures surface as closed tills and stalled DCs rather than as controlled CI exceptions.
Does Virima’s CMDB integrate with ServiceNow or Jira Service Management for retail IT teams?
Yes. CMDB automation feeds discovery-sourced configuration and dependency data into the ITSM platform a retailer already runs — ServiceNow, Jira Service Management, or Ivanti — rather than replacing it. The service desk keeps ownership of tickets and approvals; discovery keeps the underlying inventory accurate.
How does this apply to global retailers based in Stockholm specifically?
Stockholm HQ teams often support multi-market banners, mixed store ownership, and shared DC networks. Automated reconciliation and service maps give one CI model across markets so cross-border programs stop shipping with lab-only impact lists.
How does Virima discover self-checkout and DC devices without replacing existing ITSM tools?
Virima’s agent, agentless, SNMP, and cloud-API discovery methods find and classify store and DC devices on a high-frequency schedule, then hand the resulting CI and relationship data to whatever ITSM platform a retailer already runs. Virima supplies the inventory; the existing service desk keeps its workflows.