How Mapping Applications Enhance ITSM Processes
Picture your entire IT infrastructure on a single screen: every server, application, database, and network link visible with its connections. That’s what mapping applications, map software, and a dependency mapping tool bring to IT Service Management. Instead of digging through spreadsheets or relying on tribal knowledge, your team sees exactly how components connect and where dependencies exist.
For IT operations teams, this visibility changes how work gets done. When a network switch fails at 2 AM, mapping tools show which services sit downstream. When a change request lands, you trace the impact before approving it. When an incident escalates, every team shares the same view of what’s affected.
This blog covers how mapping applications strengthen ITSM workflows, what features matter most, and how Virima’s mapping capabilities help operations teams cut resolution times and manage change more effectively.
What mapping applications do for IT operations?
Application mapping, often powered by a dependency mapping tool, creates visual representations of how your software components, infrastructure, and dependencies connect. For IT operations teams, this means less time investigating how systems relate and more time acting on that knowledge. This is critical, as 45% of IT teams cite automation and efficiency as their top ITSM challenge.
When your team can see the full dependency chain and types of dependencies, which databases feed which applications, which services depend on which servers, you make better decisions about deployments, updates, and infrastructure changes. You stop guessing and start operating from a current, accurate picture.
Key features that matter for ITSM teams
Not all mapping applications or application dependency mapping software deliver the same capabilities, and the learning curve can vary significantly between tools. Here are the features that make a practical difference for IT operations:
- Dependency visualization: Shows hidden connections between applications and their supporting infrastructure. These are the dependencies that cause surprise outages when overlooked during change management windows.
- Data flow tracking: Traces how data moves across your application stack. Useful for spotting communication bottlenecks and performance issues that slow down service delivery.
- Automated discovery: Identifies and maps new assets and dependencies without manual effort, forming the foundation of application discovery and dependency mapping. Modern tools scan your network on a recurring schedule, keeping the map current with near real-time updates as your environment changes.
- Change and incident overlays: The best mapping applications overlay incident tickets and change records directly onto dependency maps, giving your team instant context during troubleshooting.
- Scalability: As your environment grows with more cloud workloads, more integrations, and more services, the mapping tool needs to keep pace without adding complexity to your workflow.
- Shared views for collaboration: When incident response involves three teams, everyone needs the same picture. Shared dependency views replace the “let me describe what I’m seeing” back-and-forth with a single source of truth.
What is the difference between application mapping and service mapping?
Application mapping focuses on how individual software components interact, such as which application talks to which database or what APIs connect frontend and backend systems. Service mapping takes a broader view, using service-based mapping to map entire business services to the infrastructure components that support them.
In practice, you need both. Application mapping tells your engineers what’s connected. Service mapping tells your operations team which business services break when a component fails.
Virima’s service mapping builds on automated discovery to map infrastructure relationships, application dependencies, and host-to-host communications back to the business services they support. Your team sees the business impact of infrastructure changes, not just the technical footprint.
How mapping applications strengthen core ITSM processes
Plugging mapping tools into your ITSM platform does more than add a visual layer. It changes how your team handles the processes they run every day.
Faster incident resolution and lower MTTR
When an incident fires, the first question is always: “What’s affected?” A dependency mapping tool helps answer that instantly. With a clear dependency map, your team skips the 20-minute investigation phase and jumps straight to scoping the blast radius. Service dependencies are visible, affected CIs are identified, and the right team gets pulled in immediately.
This directly cuts mean time to resolution. In fact, recent research shows organizations using modern ITSM technologies reduced incident resolution times by 17.8% on average. Instead of escalating blindly, your level 1 team can see whether a database outage affects one application or twenty and route accordingly.
| How does dependency mapping reduce MTTR? Dependency maps eliminate the guesswork that slows incident response. When your team can see that a failed storage array feeds three databases, which support six applications serving two business-critical services, they know the blast radius in seconds, not hours. Without this visibility, every incident starts with manual investigation: checking monitoring tools, pinging application owners, tracing connections through outdated documentation. Mapping applications compress that investigation into a single visual lookup. Teams that adopt dependency mapping typically see MTTR drop once their maps are accurate and current, highlighting the benefits of dependency mapping. |
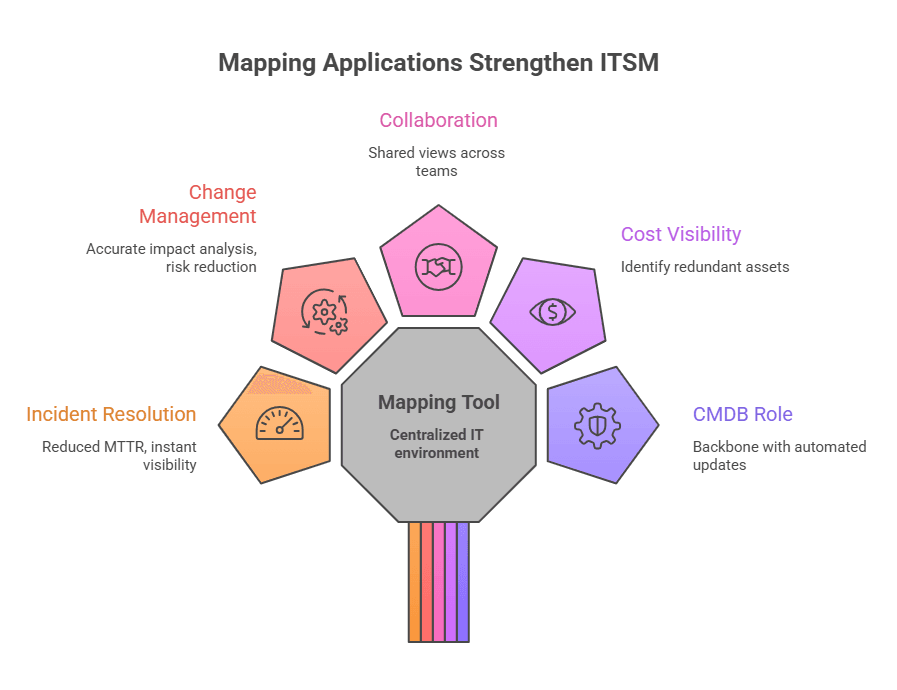
Smarter change management
Change management dependency on accurate data means impact analysis must be precise, and a dependency mapping tool provides the visibility needed to get it right. A mapping application shows you exactly which services and assets are affected by a proposed change before the change advisory board reviews it. No more relying on the submitter’s best guess about downstream impact.
This means fewer failed changes, fewer emergency rollbacks, and better stakeholder involvement. When you can show the CAB a visual impact map, approvals move faster because everyone understands the risk. For a deeper dive into this process, see our guide on how CMDB helps in change management.
Better cross-team collaboration
Major incidents rarely involve just one team. Network, application, database, and infrastructure teams all need context. A shared dependency map gives everyone the same starting point instead of requiring each team to reconstruct the picture from their own monitoring tools.
This shared view also helps during post-incident reviews. When the whole team can see the dependency chain that led to the outage, root cause analysis is faster, and the resulting action items are more targeted.
Cost visibility and resource optimization
Mapping your IT landscape exposes redundancies and underutilized resources that stay invisible without a visual overview. You can identify duplicate services, overlapping infrastructure, and assets consuming budget without delivering proportional value. For operations leaders managing tight budgets, this visibility directly supports more effective IT Asset Management.
| What is the role of CMDB in application mapping? A CMDB is the data backbone of any mapping application. Application and service maps are only as good as the configuration item data behind them. If your CMDB is stale or incomplete, your maps show a picture that doesn’t match reality, and that’s worse than having no map at all. Modern mapping applications feed directly into the CMDB through automated discovery. Every scan updates CI records and their relationships, keeping the CMDB current without manual data entry. But automated scans can’t capture everything. Attributes like asset ownership, lifecycle status, business criticality, and SLA assignments require human input. Virima’s Autonomic Social Discovery (ASD) fills that gap by automatically prompting the right people for the missing information, so your CMDB stays complete without relying on ad hoc spreadsheet updates or email chains. |
How to choose the right mapping application
The right mapping application depends on your environment, team size, ITSM maturity, and whether you prefer open source or commercial solutions. Here’s what to evaluate:
- Environment coverage: Does it work across on-premises, cloud, and hybrid environments? You need a tool that covers your full footprint, not just one slice.
- Discovery method: Look for agentless discovery that scans without installing agents on every device. Agent-based options add coverage for assets that agentless scanning can’t reach.
- ITSM integration depth: The tool should sync with your ITSM platform, whether that’s ServiceNow, Jira Service Management, Ivanti, or another platform you run. Bidirectional sync means CIs discovered by the mapping application appear in your ITSM CMDB without manual import.
- Visualization quality: Some tools show raw data with minimal context. Look for user-friendly visual dependency maps that your entire team, not just engineers, can read and act on.
- Scalability: If you’re managing thousands of CIs across multiple sites, the tool needs to handle that volume without degrading scan performance.
How Virima’s mapping applications strengthen ITSM operations
Virima’s mapping capabilities combine automated IT discovery, service mapping, and ViVID™ (Virima Visual Impact Display) to give operations teams a clear, actionable view of their IT environment.
Full IT landscape visibility
Virima’s service mapping builds accurate dependency maps by combining agentless and agent-based discovery across on-premises, AWS, and Azure environments. Discovery uses machine learning techniques to automatically identify infrastructure relationships and application dependencies, so the maps reflect what’s actually running in your environment rather than what someone documented six months ago.
These maps show how infrastructure components, applications, and services connect, giving your team the context needed for incident response, change planning, and service availability management.
Incident and change overlays with ViVID™
ViVID™ overlays ITSM incident tickets, change records, event management alerts from platforms like SolarWinds, Nagios, and Logic Monitor, and NIST National Vulnerability Database (NVD) vulnerabilities directly onto the dependency maps built by Discovery and Service Mapping.
When an incident fires, your team doesn’t just see the affected CI. They see every related change, every open ticket, known vulnerabilities on affected assets, and every upstream and downstream dependency on a single visual. The NVD integration comes at no additional licensing cost, so your team can prioritize remediation based on both vulnerability severity and the business criticality of affected services.
For change management, ViVID™ shows pending and completed changes across the service map alongside any known vulnerabilities on the assets in scope. This lets your team spot conflicts, assess risk, and involve the right stakeholders before a change goes live, not after it causes an outage.
Recurring discovery keeps maps and ITSM data current
Virima uses recurring scheduled scans, not one-time snapshots, to keep dependency maps current. ViVID™ overlays the latest change statuses from your ITSM platform onto service maps, so your team works from current data rather than stale documentation. When a recent change correlates with a new incident, the connection surfaces as soon as the data syncs; no manual cross-referencing needed.
How does mapping application integration work with ITSM platforms?
Virima integrates with seven ITSM platforms: ServiceNow, Jira Service Management, Ivanti, HaloITSM, Cherwell, Xurrent, and Hornbill. For ServiceNow, Jira Service Management, Ivanti, HaloITSM, and Cherwell, bidirectional sync means CIs and relationships discovered by Virima push into your ITSM CMDB tables while ITSM records like incidents and changes feed back into ViVID™ for overlay on service maps. Xurrent and Hornbill integrations provide discovery-to-CMDB sync with ITSM data visibility through ViVID™.
This means your ITSM platform reflects the current state of your infrastructure without manual imports or stale CI records. Your service desk, change management, and incident response teams all work from the same accurate, current data.
Turn IT visibility into operational advantage with Virima
Mapping applications don’t just add a visual layer to your ITSM processes. They change how your team operates. Faster incident resolution, smarter change management, and better cross-team coordination all start with accurate, current dependency visibility.
Virima combines automated discovery, service mapping, and ViVID™ impact visualization to deliver that visibility. For ServiceNow ITSM customers, that means getting discovery, CMDB automation, and visual impact analysis without the cost and deployment complexity of ServiceNow ITOM licensing, making it a cost-effective option.
If your team is spending too much time investigating dependencies during incidents or second-guessing change impacts, it’s worth seeing what accurate mapping can do. Ready to see the difference? Book a demo and get started with Virima today.