What Is ManageEngine Applications Manager? Features & Review

When application response times spike or database connections stall, IT engineering leads do not need another surface-level dashboard. They need to pinpoint whether the bottleneck stems from a bad SQL query, a memory leak, or an unannounced network change. Managing complex application stacks across hybrid environments requires deep visibility into runtime health, database performance, and underlying infrastructure dependencies.
ManageEngine Applications Manager is application performance and server monitoring software for those metrics. It tracks health, availability, and performance across enterprise applications, databases, cloud resources, and virtualized environments. The product is built primarily for IT operations and sysadmin teams that need broad stack coverage without a heavyweight observability platform.
ManageEngine states support for a wide set of application and infrastructure types out of the box, from legacy ERPs such as SAP and Oracle to containerized workloads and cloud resources. By collecting synthetic transactions, real-user style metrics, and server counters, Applications Manager helps teams detect performance anomalies before end users report downtime.
Where enterprise programs still stall is not the metric itself. It is mapping that metric to a live, multi-source Configuration Management Database (CMDB) with owners, change history, and service impact under the ITSM desk already in use. That boundary is the focus of this review.
| When APM alerts fire without trusted CI, owner, and dependency context, start with discovery-backed estate accuracy under the desk you already run. Explore Trusted Runtime Truth. |
What is ManageEngine Applications Manager?
ManageEngine Applications Manager is APM and infrastructure monitoring software for application health, database performance, synthetic transactions, and hybrid cloud resource metrics. It is not a multi-source CMDB or blast-radius system of record. Teams keep it for telemetry and add discovery-sourced context when tickets need owners and service impact.
Key Features of ManageEngine Applications Manager
Evaluating ManageEngine Applications Manager means looking at how it covers core monitoring domains across on-premises servers, cloud workloads, and database engines.
1. Heterogeneous Application and Database Monitoring
Applications Manager is built for deep monitoring across a broad technology set. It tracks heap usage, thread pools, and garbage collection for Java, .NET, and PHP applications. It also monitors query execution time, lock waits, and index fragmentation across database platforms including Oracle, Microsoft SQL Server, MySQL, PostgreSQL, and IBM DB2.
2. Automated Application Dependency Mapping
The platform includes agentless application discovery that identifies active network connections between monitored servers and maps top-level application-to-database dependencies. Operators get a visual topology of connected nodes that helps initial incident triage. Those maps are strongest for relatively stable stacks. Dynamic microservices and auto-scaling cloud paths often outrun point-in-time topology alone.
3. Synthetic Transaction Monitoring (EUM)
Using browser automation scripts, Applications Manager simulates multi-step end-user transactions across web applications. It records response times, page load breakdowns, and HTTP errors across distributed locations to support SLA checks.
4. Cloud and Virtualization Oversight
Applications Manager collects performance telemetry from Amazon Web Services (AWS), Microsoft Azure, Google Cloud Platform (GCP), VMware vSphere, Hyper-V, and Nutanix AHV. It tracks CPU overcommit ratios, VM sprawl, and cloud resource consumption to support capacity planning. For broader placement and capacity context beyond APM counters, see capacity planning for infrastructure workload placement.
What technologies does ManageEngine Applications Manager monitor out of the box?
ManageEngine Applications Manager monitors a broad set of stacks that commonly includes Java, .NET, Node.js, SAP, Oracle, SQL Server, VMware, Kubernetes, AWS, and Azure. It captures memory utilization, query latency, thread pool saturation, and synthetic transaction response times through agentless and agent-based telemetry paths.
Where Applications Manager Succeeds and Where Gaps Emerge
ManageEngine Applications Manager delivers clear value for mid-market IT organizations that want consolidated APM without enterprise SaaS observability overhead.
Strengths of ManageEngine Applications Manager
- Breadth of out-of-the-box coverage: Pre-configured monitoring templates help teams onboard legacy databases and web servers quickly.
- Predictable perpetual and subscription licensing: Tiered pricing based on monitored attributes or servers is easier to forecast than pure data-ingestion models for many IT budgets. Confirm current packages on ManageEngine commercial pages before you shortlist.
- Direct ManageEngine ITSM integration: Native hooks into ManageEngine ServiceDesk Plus support automated ticket creation when threshold alerts fire.
Architectural limitations in enterprise environments
- Static application dependency maps: Dependency maps inside Applications Manager often rely on point-in-time connection and port discovery. They do not replace a multi-source CMDB that keeps runtime relationships current across dynamic microservices or hybrid auto-scaling events.
- Siloed APM telemetry: Metrics stay strongest inside the monitoring console. Applications Manager is not designed as a multi-source, confidence-scored CMDB that feeds external ITSM tools such as ServiceNow or Jira Service Management with reconciled CI truth.
- Limited blast radius analysis: When an application node fails, Applications Manager alerts on the down state. It does not, by itself, map business service ownership, recent change history, and regulatory posture for that failure path.
Three Decision Paths: Stay, Pair, or Add Estate Context
Stay on ManageEngine Applications Manager alone when your primary need is APM and server metrics, your ITSM desk is ServiceDesk Plus, and dependency questions stay simple enough for topology inside the monitor.
Pair Applications Manager with discovery-sourced CMDB context when alerts are accurate but responders still lose time answering who owns the CI, what changed, and which business service is next. Keep ME for telemetry. Add Trusted Runtime Truth for estate accuracy under the ticket.
Choose Virima under a multi-desk ITSM estate when ServiceNow, Jira Service Management, Ivanti, HaloITSM, Xurrent, Hornbill, or a mixed desk set needs CI attach, ownership, and service maps. Virima does not replace Applications Manager, OpManager, or ServiceDesk Plus. It feeds discovery-sourced CMDB and map context into the system of engagement you already run. Desk coverage is listed on Virima’s integrations hub when you shortlist multi-ITSM handoff.
Why APM Telemetry Still Needs Trusted Runtime Truth
Monitoring metrics tell IT teams that an application is failing. Resolving complex incidents still requires knowing what changed, who owns it, and what else will break.
Unmapped change is a common pattern behind long majors even when the first alert looks precise. According to Enterprise Management Associates (EMA) 2025 ServiceOps research summarized in Virima’s public whitepaper, 64% of enterprise IT outages stem from uncoordinated changes executed across unmapped application dependencies. When APM alerts trigger in ManageEngine Applications Manager, engineers still cross-reference CMDB records for impact. If that CMDB data is stale, MTTR expands.
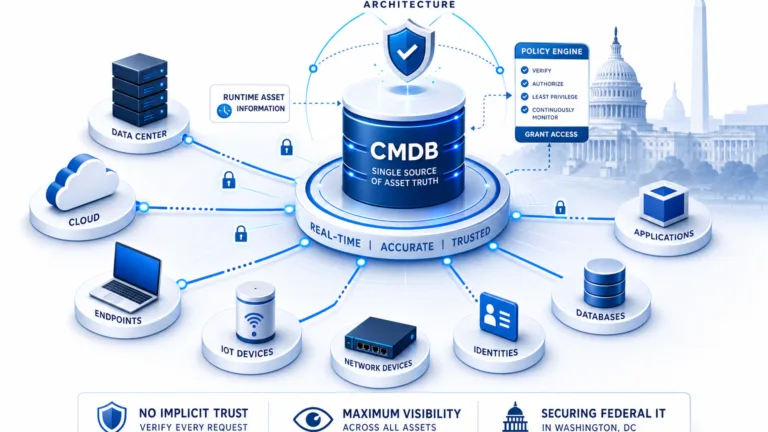
Virima addresses the context gap as an operational layer under the desk. While Applications Manager gathers server-level performance metrics, Virima delivers Trusted Runtime Truth: a multi-source CMDB fed by agentless, agent-based, and API discovery on high-frequency scheduled cycles. AWS and Azure cloud inventory join that mix for hybrid estates.
After service definitions are provided, ViVID™ service maps can overlay dependency, ownership, and change context so teams relate APM symptoms to business service paths. Inventory that never earns discovery authority still decays under load; the pattern is the same whether the front console is APM or a spreadsheet-fed CMDB. For that decay pattern, inventory without discovery authority still looks complete until change outruns the last manual update.
How does Virima work alongside ManageEngine Applications Manager?
Virima does not replace APM telemetry. It correlates multi-source CMDB records, ownership, change history, and ViVID™ service maps with the estate under your ITSM desk so isolated server alerts become impact-aware. Teams keep Applications Manager for metrics and add discovery-sourced context for blast radius and CI truth.
Summary Decision Matrix: ManageEngine Applications Manager vs Enterprise Needs
| Operational requirement | ManageEngine Applications Manager alone | Paired with Virima Trusted Runtime Truth |
|---|---|---|
| Primary job | APM and infrastructure metrics | Runtime CI, ownership, and service context under ITSM |
| Server and database APM | Deep metric collection across a broad stack set | Preserves native APM while grounding work in live CMDB context |
| Dependency mapping | Topology from connection and port discovery | ViVID™ service maps after service definitions, with ownership and change overlays |
| Multi-source CMDB | Not the product’s primary system of record | Multi-source CMDB with source attribution and confidence scoring |
| ITSM ecosystem support | Strongest with ManageEngine ServiceDesk Plus | Two-way style sync patterns with ServiceNow, Jira Service Management, Ivanti, HaloITSM, Xurrent, Hornbill, and more |
| Incident blast radius | Node and service-level alert notification | Business service dependency and blast radius visualization under the ticket |
Can ManageEngine Applications Manager replace an enterprise CMDB?
No. Applications Manager is APM and infrastructure monitoring for metrics, logs, and availability. It does not provide multi-source CMDB reconciliation, confidence scoring, full asset lifecycle management, or formal CSDM-style alignment across external ITSM platforms on its own.
If identification still eats the open of every major after the APM alert is correct, run a short pilot: keep Applications Manager for the metric path, clean ownership and service links in the CMDB, then attach CI and map context under the desk you already use. Confirm current desk coverage on the integrations hub.
The desk list is not the product decision. The decision is whether tickets inherit trusted CI, owner, dependency, and recent-change context from discovery-sourced records, or whether responders keep paying identification tax after every correct APM alert. Applications Manager can stay the metric source either way. Virima does not replace ManageEngine monitoring or ServiceDesk Plus.
Service composition still needs named definitions for the business paths that matter under load. Topology inside the monitor helps triage. It does not by itself carry ownership, change history, and blast radius across hybrid auto-scaling edges. Name the services that fail most often first. Clean owners and service links on those paths next. Only then expect maps to cut identification time on a Monday morning major.
High-frequency scheduled discovery is what keeps CI records and dependency edges worth trusting after the APM alert is already correct. Agentless methods still cover racks, network gear, and many servers where credentials already exist. Agent coverage matters for remote endpoints that rarely stay on the corporate subnet long enough for a clean agentless pass. API discovery fills cloud instance and configuration gaps that neither agent path will see from inside the guest alone.
AWS and Azure inventory joins that mix for hybrid estates without turning Virima into a GCP APM console. GCP remains a ManageEngine monitoring strength when your stack needs cloud telemetry there. Currency is the contract with responders. If the CMDB only refreshes when someone remembers a spreadsheet import, tickets inherit last quarter’s owners and last month’s topology even when the APM graph looks sharp. That gap is expensive across a year of majors.
After those definitions exist, induct map depth in the same pilot rather than treating APM topology as the full service model. For that map layer under tickets, see service mapping.
Walk one of your own APM alerts with discovery-sourced CI context and ViVID™ maps under the ITSM desk you already run. Leave with a clearer picture of how much identification time your team can still reclaim.
Optimize Your Application Monitoring Strategy
Enterprise application health needs both deep APM telemetry and an authoritative, discovery-sourced CMDB. ManageEngine Applications Manager is a strong choice for server and database monitoring, synthetics, and ManageEngine-centric ITSM hooks. Pairing that telemetry with live operational context is what keeps responders from starting every major blind.
Virima does not replace ManageEngine Applications Manager. It supplies Trusted Runtime Truth under the tickets and change windows where ownership, dependency, and blast radius decide MTTR.
Disclaimer: Product capabilities, stack coverage counts, licensing, and integrations change over time. Confirm current Applications Manager features and commercial terms on ManageEngine documentation. EMA figures are as summarized in the linked Virima whitepaper. Outcomes vary by estate, discovery scope, and desk configuration.
Frequently asked questions
Can ManageEngine Applications Manager replace an enterprise CMDB?
No. ManageEngine Applications Manager is an APM and infrastructure monitoring tool built to track metrics, logs, and server availability. It does not provide multi-source CMDB reconciliation, confidence scoring, full asset lifecycle management, or formal CSDM-style alignment across external ITSM platforms on its own.
Does ManageEngine Applications Manager support cloud-native monitoring?
Yes. Applications Manager provides monitoring for AWS, Azure, GCP, Kubernetes, and Docker-class environments as ManageEngine documents them. Cloud infrastructure still changes often, so pairing APM with scheduled API and multi-method discovery keeps short-lived nodes and auto-scaling resources represented accurately in the CMDB you trust for impact.
How does Applications Manager integrate with third-party ITSM tools like ServiceNow?
Applications Manager can raise email alerts or custom webhooks to open tickets in third-party ITSM platforms. Native depth is strongest with ManageEngine ServiceDesk Plus. Reconciling CI data and dependency relationships inside third-party CMDBs usually needs a multi-source integration path such as Virima rather than one-off scripts alone.
What is the main difference between ManageEngine OpManager and Applications Manager?
ManageEngine OpManager focuses primarily on network infrastructure, routers, switches, firewalls, and bandwidth monitoring via SNMP and NetFlow-class methods. Applications Manager focuses higher up the stack on application performance, database queries, web services, and synthetic end-user transactions.
Why do IT teams pair Virima with ManageEngine monitoring software?
Teams pair Virima with ManageEngine when performance alerts are clear but ownership, change history, and business service impact are not. Virima feeds discovery-sourced CMDB and ViVID™ maps under the ITSM desk. It does not replace Applications Manager, OpManager, or ServiceDesk Plus.