Capacity Planning From Live Inventory: Where Workloads Should Land

Place two compute-heavy, interconnected workloads on the same physical host, and shared memory and network contention can degrade an entire service before anyone notices. That’s especially likely when the last capacity review ran off a spreadsheet from last quarter. Add a cloud migration or a new application launch, and the guesswork compounds: teams pad safety buffers to avoid outages, cloud bills climb, and bottlenecks still surface during peak demand anyway. Capacity planning is the practice of forecasting infrastructure resource needs against live utilization and service dependency data, not historical averages or static hardware inventories.
The high cost of reactive infrastructure capacity planning
Traditional capacity planning relies heavily on static hardware inventories and historical utilization averages. This retrospective approach creates severe blind spots in dynamic enterprise environments.
When IT teams allocate host resources without understanding application communication paths, they risk resource contention. Placing two compute-heavy, interconnected workloads on the same physical host or hypervisor cluster starves shared network interfaces and memory buses. Conversely, over-allocating safety buffers across public cloud accounts inflates monthly cloud spend without improving service availability. A cloud CMDB that tracks utilization alongside asset records surfaces this kind of waste before it compounds, rather than after the invoice arrives.
According to the Flexera 2026 State of the Cloud Report, wasted cloud spend on IaaS and PaaS rose to 29% in 2026, the first increase in five years. Static buffers compensate for poor visibility rather than actual utilization requirements, so the waste grows every time a new workload gets added without a matching review.
Reactive capacity management also delays business projects and hides risk until it’s too late. When new application initiatives launch, IT Ops Managers at hybrid enterprises running ServiceNow or Jira Service Management struggle to estimate required compute capacity without clear baseline metrics, so teams react to performance bottlenecks only after end users report application slowness. Proactive capacity management instead requires real-time data feeds that correlate hardware load with specific business application flows — and inaccurate capacity estimates during cloud migration often trigger costly post-migration re-architecting projects.
What is capacity planning in enterprise IT infrastructure?
Capacity planning is the practice of analyzing current system utilization and predicting future resource needs. It ensures compute, storage, and network infrastructure scale efficiently to support business applications without over-provisioning or performance degradation.
How discovery and dependency mapping drive workload placement
Effective workload placement requires understanding how individual infrastructure components interact to deliver business services.
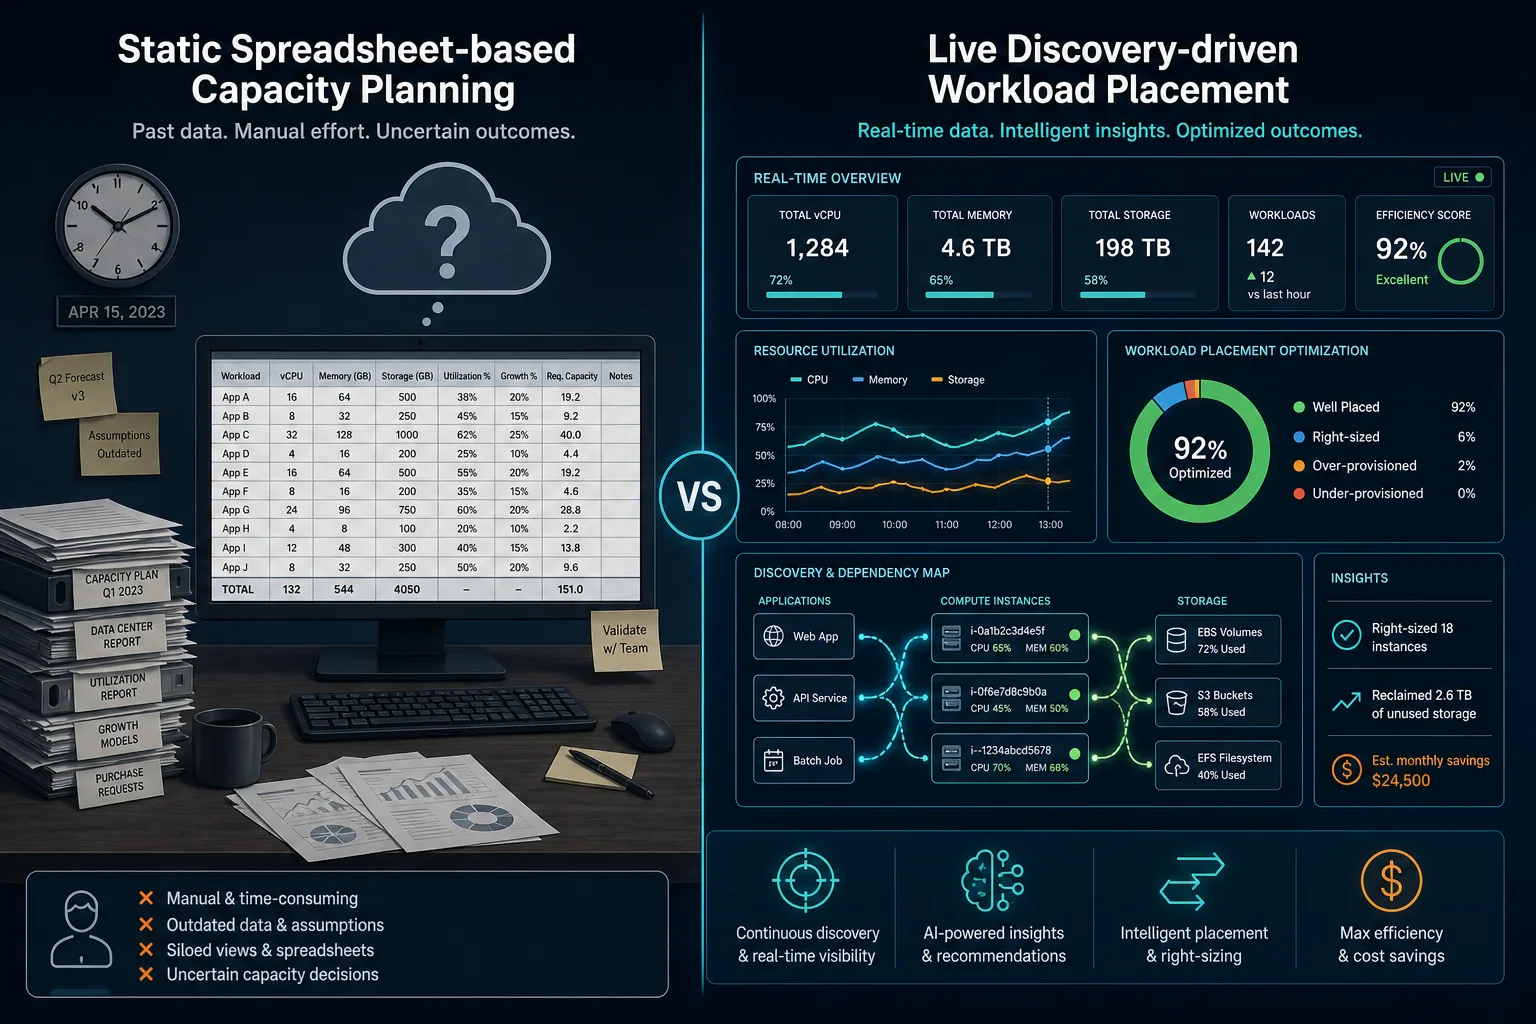
Automated asset discovery tools collect real-time performance metrics across physical servers, hypervisors, cloud instances, and storage arrays. Dependency mapping engines layer operational context on top of raw utilization metrics, surfacing host-to-host links, database queries, and storage volume attachments.
Combining asset metrics with service mapping transforms capacity decisions through clear phases:
- Capture baseline CPU, memory, storage, and network utilization across all environment nodes.
- Map application components to underlying physical and virtual CIs.
- Identify shared infrastructure bottlenecks and resource-contention clusters.
- Model workload placement scenarios based on actual traffic growth trends.
- Rebalance workloads dynamically across target hosts and cloud regions.
Consider a three-tier ERP application spread across a database cluster, an application server pool, and a reporting service. Without dependency mapping, a capacity planner sees three separate sets of utilization numbers with no way to tell they belong to the same workload. With dependency mapping, those three CIs roll up into one logical service. A memory ceiling on the database tier then gets evaluated against the business impact of the whole ERP application, not only that one server.
Industry analysts have linked automated asset mapping to meaningfully fewer resource bottlenecks than static planning models. Live data replaces guesstimates with measurable runtime facts, so continuous visibility prevents unexpected cloud billing surprises caused by hidden compute dependencies.
Granular dependency visibility also helps infrastructure architects model future application expansions. Planners can evaluate how adding new user groups or transaction volumes impacts downstream database servers before deploying code to production.
IT teams seeking to optimize infrastructure allocations can explore Virima’s trusted runtime truth to connect capacity metrics directly to live service dependency maps.
Core criteria for sizing hybrid infrastructure capacity
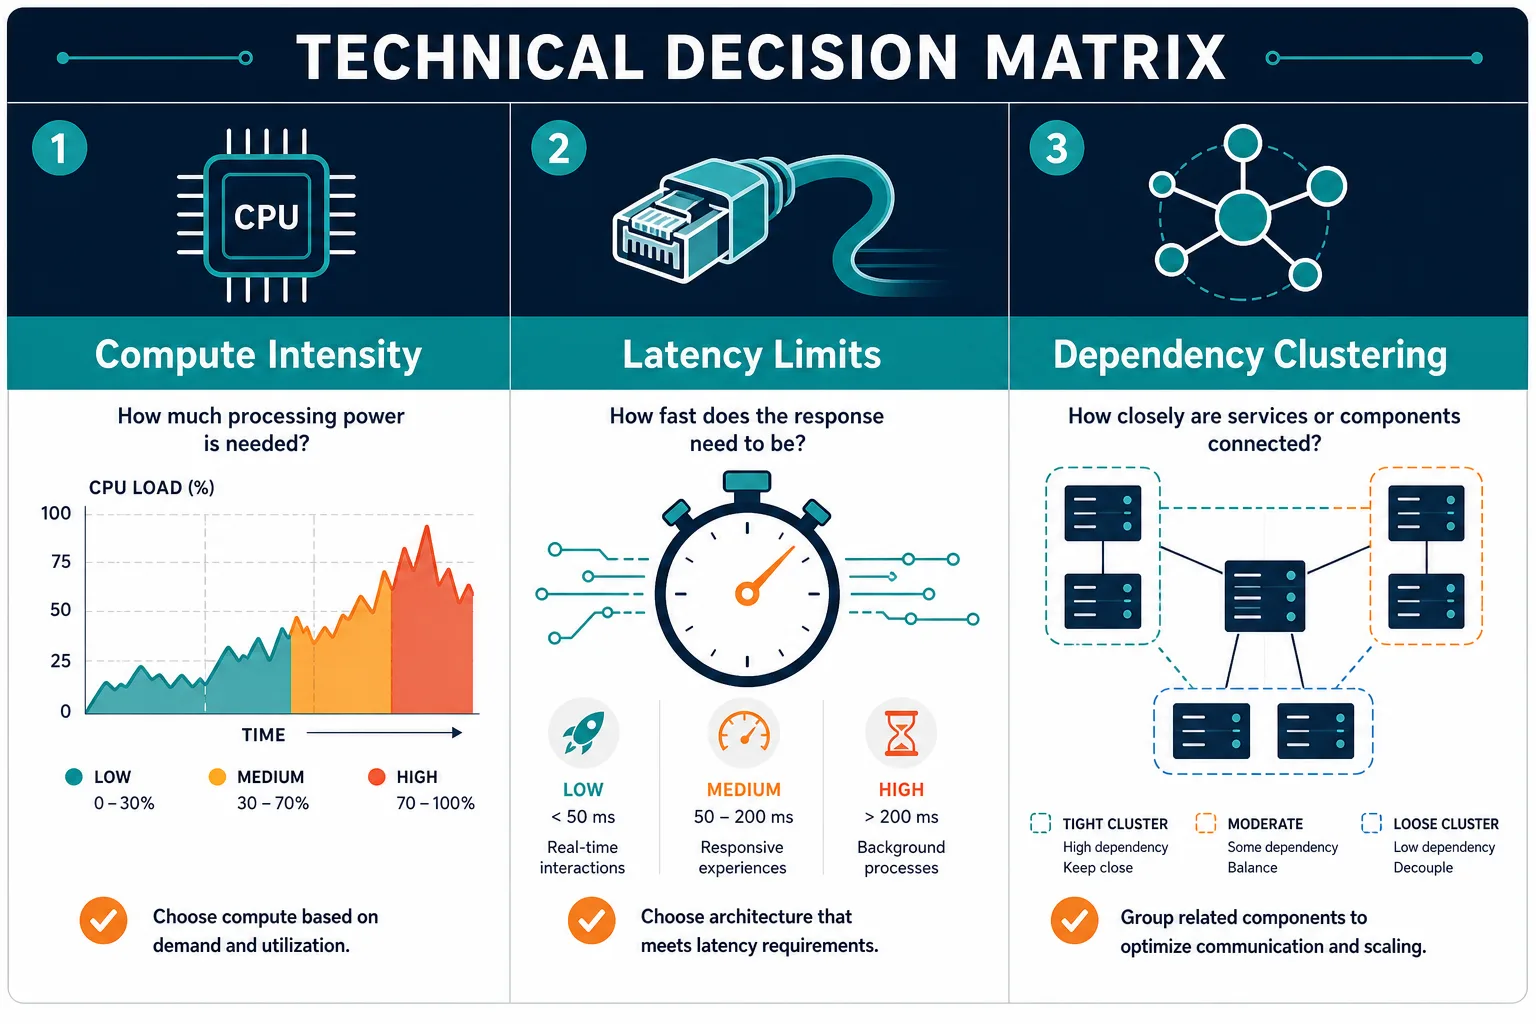
Infrastructure architects evaluate several technical dimensions when placing workloads and sizing future capacity allocations. Platforms that combine discovery, CMDB, and service mapping data give architects a single source for these dimensions instead of stitching together spreadsheets and monitoring dashboards.
| Capacity Factor | Data Center Infrastructure | Public Cloud Environments | Hybrid Placement Strategy |
|---|---|---|---|
| Compute Sizing | Physical CPU cores, RAM limits, socket density | Virtual CPU tiers, auto-scaling thresholds | Right-size baseline on-prem; burst to cloud |
| Storage Utilization | SAN/NAS IOPS, disk throughput, storage tiers | Block storage IOPS, object storage policies | Tier hot data locally; archive cold objects |
| Network Bandwidth | Backplane capacity, switch port saturation | Egress bandwidth, VPC peering limits | Place coupled CIs within local subnets |
| Dependency Impact | Local hypervisor host affinity rules | Cross-region API latency | Group dependent CIs on high-speed links |
Balancing these factors prevents localized bottlenecks. That’s why placing a high-volume database on a low-IOPS storage array, for instance, causes severe application slowdowns.
Dependency mapping ensures that coupled application tiers sit within acceptable network latency boundaries. Grouping dependent microservices onto high-speed local network segments minimizes latency spikes during peak processing hours.
Public cloud and on-premises infrastructure also fail differently under the same capacity mistake. An undersized on-prem host degrades gracefully as request queues build, while an undersized cloud instance can auto-scale into runaway spend before anyone traces the root cause. Sizing decisions that ignore this difference either under-protect the data center or over-spend in the cloud. Dependency context is what tells a planner which failure mode a given workload is actually exposed to.
How does application dependency mapping improve workload placement?
Dependency mapping reveals active communications between web tiers, databases, and microservices. Understanding these links enables IT teams to place coupled workloads on adjacent physical hosts or cloud zones. This approach minimizes network latency and prevents resource starvation.
Best practices for data-driven capacity planning
Implementing a proactive capacity management framework requires integrating live discovery data into daily IT operations workflows. This pairs with the broader operational practices that keep IT infrastructure reliable.
1. Maintain continuous automated asset discovery
Static asset inventories become obsolete within days. Combine agentless network probes, hypervisor polling, and cloud API connectors to track infrastructure changes automatically. Continuous discovery captures transient compute spikes that periodic audits miss.
2. Map service dependencies visually
Analyze utilization in the context of complete business applications. Use visual dependency mapping tools to evaluate resource allocations. Teams can inspect these maps using Virima’s service mapping capabilities to visualize resource bottlenecks and change impact before reallocating server workloads.
3. Establish baseline growth metrics
Measure historical utilization trends over 30 to 90-day windows. Identify seasonal processing peaks, end-of-month batch jobs, and steady-state growth patterns. Baseline metrics allow capacity planners to project future hardware purchases accurately. Planners should also track memory growth trends on database nodes to prevent sudden out-of-memory errors.
4. Optimize cloud auto-scaling policies
Configure auto-scaling triggers using real-time application demand metrics rather than static CPU thresholds alone. Combining memory usage, queue depth, and network IOPS metrics ensures cloud instances scale up before end users experience performance degradation.
5. Establish capacity threshold alerts
Set automated alerts for infrastructure components approaching utilization limits. Early warnings at 75% or 80% capacity give engineering teams time to rebalance workloads or procure additional resources.
6. Synchronize capacity data with a central CMDB
Ensure capacity metrics and asset states update automatically within your central configuration management database. Bi-directional synchronization keeps incident responders and change boards informed about capacity constraints. For the full pattern, see these CMDB best practices. Integrate discovery engines natively with ITSM platforms including ServiceNow, Jira Service Management, Ivanti, HaloITSM, Xurrent, and Hornbill.
Organizations maintaining live CMDB integrations have reported meaningfully lower emergency capacity spending compared with those relying on periodic, manual reconciliation.
Why is CMDB integration essential for capacity management?
CMDB integration links capacity metrics directly to IT service management workflows. Connecting utilization data to CI records ensures change management boards evaluate capacity impact before approving infrastructure updates and server consolidations.