How Virima Closes the Gap Flexera’s 2026 Cloud Report Highlights

Flexera surveyed 753 IT and cloud practitioners in late 2025 for their State of the Cloud report, and 85% of them didn’t name security as their biggest challenge. They named managing cloud spend instead, for the fourth year running, ahead of security and software licenses alike. That was released on March 18, 2026, marking the first edition in five years to document wasted cloud spend climbing rather than falling.
Wasted spend is now up to 29%, after half a decade of steady decline. For every enterprise watching a cloud bill that keeps climbing, that reversal is a warning sign. It means the governance built over the last five years isn’t converting into savings the way it was expected to.
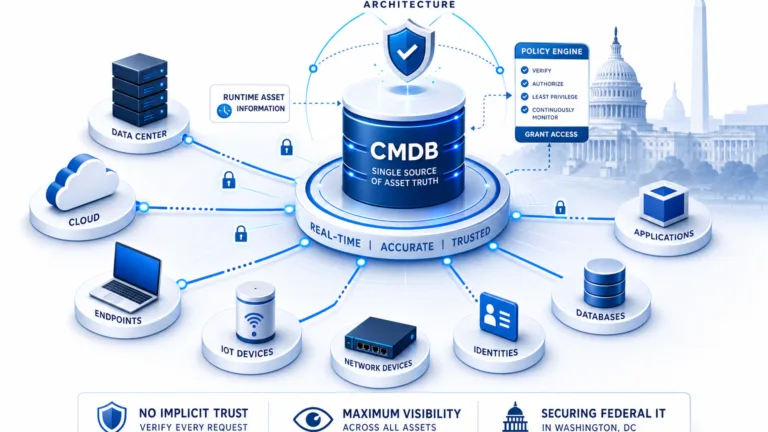
That gap shrinks when IT teams have an infrastructure-level, accurate record of what’s actually running in their hybrid environment, and that’s something Virima CMDB provides by default. It’s a trusted runtime truth that FinOps leaders can rely on and act on.
Cut wasted cloud spend before your next budget review. Virima’s discovery and CMDB give FinOps and ITAM teams the operational record they need to close the gap Flexera’s data finds. Start a free trial and see what’s actually running across your estate, at no cost.
Why the gap exists at all
Flexera’s 753 respondents describe an estate that has outgrown spreadsheets and tribal knowledge. 73% of organizations now run hybrid infrastructure, up three points year over year, and roughly a third operate multiple public and multiple private clouds at once. Enterprises typically arrive here by acquisition rather than design. A merger brings in a Google Cloud footprint, a new product line shows up with its own AWS account, and nobody planned any of it as one system.
Scale keeps compounding the problem as 76% of large enterprises spend more than $5 million a month on cloud services, and SaaS spend is climbing right alongside it. Gartner projects worldwide IT spending will reach $6.37 trillion in 2026, up 14.2% from 2025, with data center systems and infrastructure-as-a-service outpacing every other category. IDC’s read on the U.S. specifically is just as direct, with American public cloud spending alone on pace to reach roughly $647 billion in 2026. That growth is pulled up by large-scale enterprise migrations, hyperscaler AI buildouts, and demand from regulated industries like financial services and healthcare.
Generative AI adds another layer on top of it. Every organization Flexera surveyed reported using GenAI to some degree. 45% of them now describe that use as extensive, up from 36% a year ago. Only 47% of large enterprises have a dedicated AI governance team or leader in place to manage what that infrastructure costs or how it’s secured.
What the gap means for enterprise
Every finding above compounds into something bigger than a line-item cost problem for enterprise leadership.
Spend keeps leaking in more places at once
Wasted Infrastructure as a Service (IaaS) and Platform as a Service (PaaS) spend sits at 29%, and discount programs are shifting so fast that fewer than half of organizations use even one commitment discount consistently per provider. Google Committed Use Discount adoption rose four points, and AWS Reserved Instance usage rose three, while IBM and Oracle discount usage collapsed by double digits.
Migration and M&A risk goes up
Understanding application dependencies is the single most commonly cited migration challenge Flexera tracked, ahead of technical feasibility or cost, and the same finding holds among European respondents. Every acquisition, workload move, or repatriation decision now carries a real chance of breaking something nobody mapped.
AI adds a faster-moving version of the same problem
Unpredictable, bursty AI usage is already the leading driver of runaway AI cost for 27% of organizations managing AI workload costs. Fifty-three percent name security and compliance as their top challenge in scaling AI workloads, ahead of cost forecasting itself. GPU environments spin up and down faster than any quarterly review cycle can track, and the visibility gap that already created cloud waste is now creating AI waste, only quicker.
Shadow SaaS turns a budget problem into a compliance one
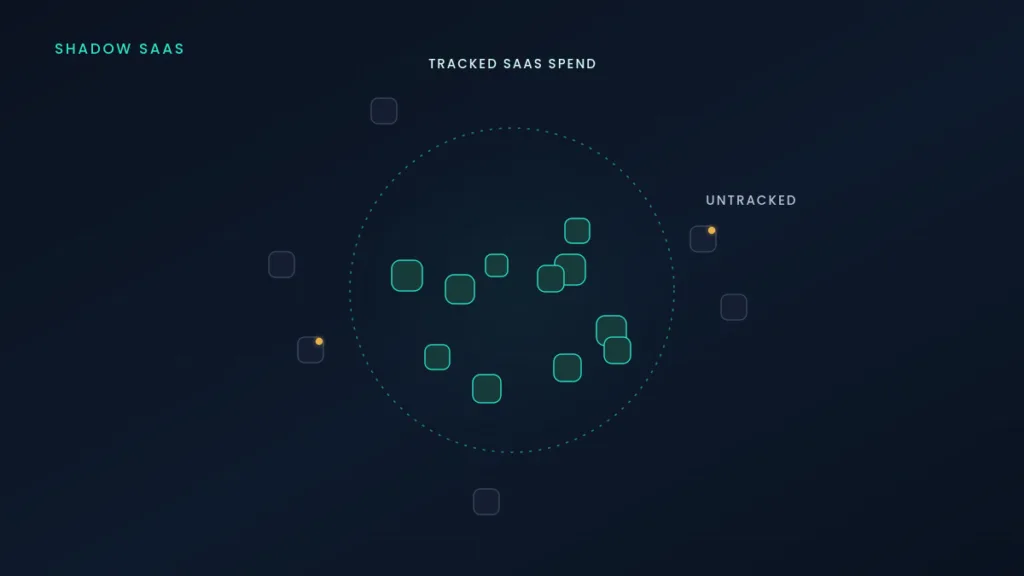
Eight percent of organizations don’t track SaaS costs at all, up from five percent the year before. An organization that can’t see its SaaS spend can’t see its SaaS assets either, and that’s a security exposure long before it shows up on an invoice.
Put together, these effects land squarely on IT leadership’s credibility. Boards are watching cost outrank security as the top concern for the fourth year running. Every FinOps team or CCoE that can’t show a falling waste number next year will face harder questions about the investment behind it.
Closing the gap: what a discovery-sourced CMDB actually changes
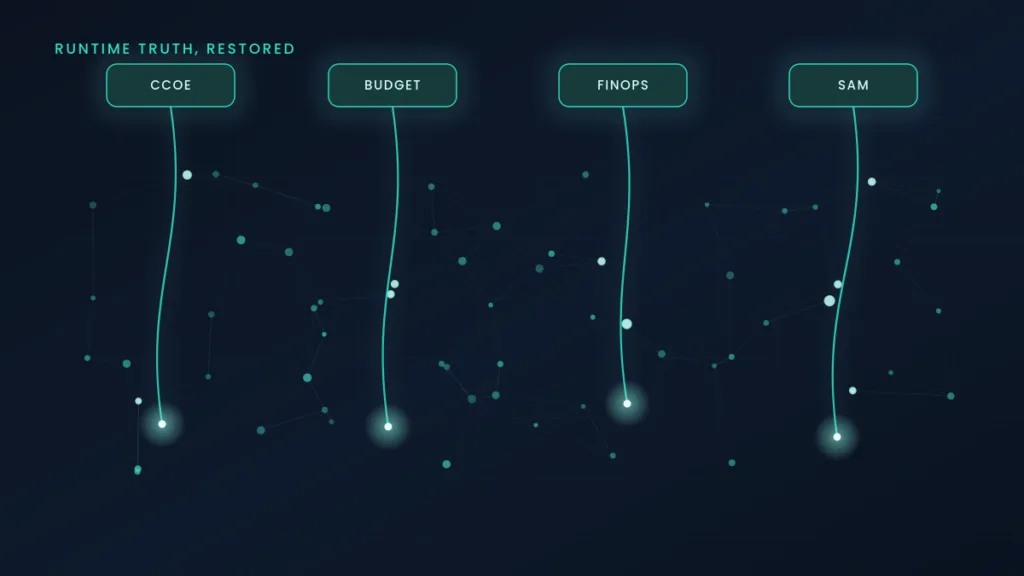
This is exactly the layer a configuration management database is built to hold, and exactly where most CMDBs fall short. Most of them are populated by hand, updated whenever someone remembers to, and stale within a quarter of go-live.
Virima approaches it from the other direction. Its discovery engine runs frequently and automatically across on-premises infrastructure and the two providers that dominate enterprise cloud today, AWS and Azure. That’s where 83% and 79% of enterprises, respectively, run active workloads. AWS integration and Azure integration extend that same discovery natively to each platform. It scans agentlessly where that’s practical and uses an installable agent for endpoints that move. That feed keeps the CMDB current against what’s actually running, not what was documented at the last audit or inferred from a billing export.
That inventory becomes useful the moment it’s connected. ViVID™ Service Mapping turns discovered assets into a live map of what depends on what. That’s the exact question Flexera’s respondents named as their top migration obstacle, two years running. Before a workload moves, or gets repatriated back on-premises, a team can see the blast radius: which applications sit downstream, which services would feel the change, which “isolated” workload turns out not to be. That’s the difference between a migration plan built on an architecture diagram from a workshop 18 months ago and one built on what the environment is doing right now.
The same discovery-sourced data gives IT asset management something to work with beyond spreadsheets. Software Asset Management (SAM) teams stepping into cloud governance need to tie license entitlements, discount commitments, and actual usage to the same record operations teams already trust. That’s different from a separate shadow inventory that drifts out of sync within a quarter. And because that record lives inside native integrations with ServiceNow, Jira Service Management, Ivanti, and HaloITSM, cost exceptions and change requests land with an owner attached, not just a ticket number. That’s what actually closes the loop between a FinOps dashboard and the engineer who provisioned the resource in the first place. Organizations already running Flexera for software license tracking specifically should weigh what that ITAM layer covers against a discovery-sourced alternative before assuming the two solve the same problem.
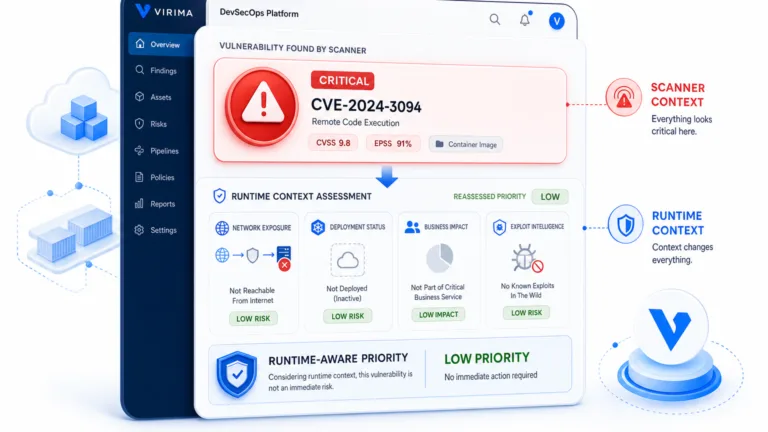
Virima’s role here is specific, and it’s the layer that FinOps policy, discount strategy, billing platforms, and AI governance frameworks all depend on to actually work. What it provides is the base every one of those functions is currently missing: a continuously discovered, explainable record of what exists, how it connects, and who’s responsible for it. Flexera’s own data shows what happens without that record as waste creeps back in even as the organization chart around it gets more sophisticated. AI workloads add a category of infrastructure that spins up faster than any quarterly review cycle can track. That same discovery-sourced foundation, Trusted Runtime Truth, is what lets governance keep pace with an estate that no longer sits still.
Takeaway for IT leaders
Flexera’s report is a diagnosis, not a verdict. It says cloud governance matured faster than cloud visibility did, and that mismatch is where the waste, the migration risk, and the shadow SaaS all originate. Adding another dashboard on top of the same incomplete inventory won’t close that gap.
Before your next budget cycle or AI governance review, it’s worth asking a blunt question that most FinOps tools aren’t built to answer. If you had to prove, right now, what’s running across your hybrid estate and what depends on it, could you?
See how Virima’s discovery and CMDB give that record a high-frequency, defensible foundation.
Frequently Asked Questions
What is the Flexera 2026 State of the Cloud Report?
It’s Flexera’s annual survey of cloud decision-makers and practitioners, now in its fifteenth year. The 2026 edition, released March 18, 2026, polled 753 respondents worldwide, most of them based in the U.S., on hybrid and multi-cloud adoption, FinOps and governance maturity, wasted spend, generative AI usage, and cloud provider market share. It’s one of the most widely cited benchmarks for how enterprise IT teams manage cloud cost and complexity.
Why did cloud waste rise in 2026 despite record FinOps maturity?
Flexera’s 2026 report found wasted IaaS/PaaS spend at 29%, the first increase in five years, even as FinOps team adoption reached 63% and CCoE adoption reached 71%. The gap traces back to visibility: FinOps and CCoE structures govern spend, but most organizations still lack a continuously current record of what’s actually running across hybrid and multi-cloud environments.
What’s the biggest cloud migration challenge organizations face, according to Flexera?
Understanding application dependencies is the top-ranked migration challenge across organizations of every size, ahead of assessing technical feasibility or estimating cost. Virima’s ViVID™ Service Mapping addresses this directly by building a live, discovery-sourced map of those dependencies, so teams can see what depends on a workload before they move or repatriate it, not after something breaks.
Why isn’t a FinOps team or CCoE enough to prevent cloud waste?
A FinOps team or CCoE sets policy, tracks budgets, and assigns accountability. Still, none of that is the same as knowing what’s actually deployed, how it’s connected, or what changes if a workload moves. Virima closes that gap by feeding those teams a continuously updated CMDB and dependency map, so the policy and the budget are finally based on an accurate record rather than an assumed one.
Does Virima replace the FinOps or billing tools an organization already has?
No, Virima’s discovery and CMDB capabilities supply the operational data (what exists, how it connects, and who owns it) that FinOps platforms, SAM teams, and AI governance programs need in order to act. It complements existing FinOps, ITSM, and billing tools rather than replacing them.
If FinOps and CCoE maturity still leave cloud waste climbing, see how discovery-sourced CMDB and service maps give those teams a current record of what is running and what depends on it.