Best Network Management Software in 2026: A Complete Buyer’s Guide

Most IT outages begin with the same gap. Nobody knew what was running, where it lived, or what it depended on. Network management software closes that gap. It gives your team a constant view of device health, traffic, and topology, so you can catch problems early. But dozens of platforms claim to solve the same issue. So choosing the right one takes more than reading a feature sheet.
Your network has likely grown faster than your team can document it. Today’s setups mix on-premises routers and switches with cloud networks, containers, and software-defined infrastructure. They also add more IoT and OT devices every year. As a result, tools built five years ago now struggle to show the full picture.
The market has responded. Newer platforms handle cloud workloads, API-based discovery, and AI-assisted anomaly detection. Meanwhile, older tools have stretched their SNMP and flow-based monitoring to cover hybrid setups. To choose well, you need honest answers about two things. What does your environment really look like? And what can your team actually run?
This guide covers the 10 best network management software options for 2026. It explains the features that separate strong platforms from basic alert tools. It also gives you a simple framework to match a tool to your infrastructure.
What Is Network Management Software?
Network management software is a group of IT tools that discover, monitor, configure, and fix the devices on your network. This includes physical gear like routers, switches, firewalls, and wireless access points. It also covers virtual and cloud parts, such as SDN controllers, AWS VPC setups, and Azure Virtual Network resources.
TechTarget’s networking reference splits network management into five areas. These are fault, configuration, accounting, performance, and security, often called FCAPS. A strong enterprise platform should handle at least the first four:
- Fault management: spotting and alerting you to device failures, interface errors, and dropped connections
- Performance monitoring: tracking bandwidth use, latency, packet loss, and device CPU and memory
- Configuration management: recording device settings and flagging changes you did not approve
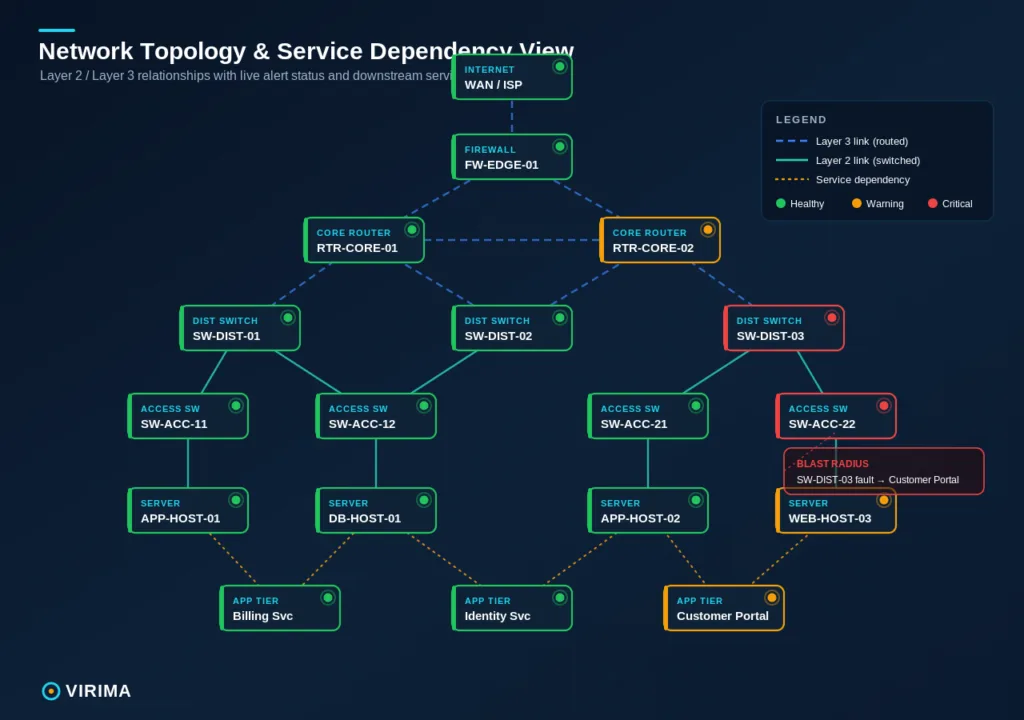
- Topology mapping: showing how your devices connect and depend on each other
What to Look for in Network Management Software
Discovery breadth. Can the tool find every device on your network? That includes unmanaged switches, wireless endpoints, and cloud-hosted virtual appliances. Discovery scope sets how accurate your topology map is from day one. A tool that uses only SNMP polling will miss more and more gear as you move to the cloud.
Protocol support. SNMP v2c and v3 covers most physical network devices. WMI handles Windows infrastructure. SDN controllers and cloud platforms need REST APIs. So a tool without API-based discovery will leave gaps in any hybrid setup that uses AWS or Azure.
Alert quality. Too many low-value alerts wear your team down. The fix is dependency-aware alerting. For example, if a core switch goes down, the platform should mute the downstream alerts it causes. That way, you see one real problem instead of fifty symptoms.
ITSM integration. Network events should create tickets in ServiceNow or Jira Service Management on their own. If they cannot, your team loses time on manual handoffs. So look for native integrations or clear webhook support. This is a basic need if you run ITSM workflows next to network operations.
Topology accuracy. A map that shows devices but not their dependencies is like a floor plan with no walls. The best maps show Layer 2 and Layer 3 links, application dependencies, and change history.
Licensing model. Tools priced by device count get expensive fast in large networks. Sensor-based models give you cost certainty, but the count can climb as you track more metrics. SaaS platforms often price by node or by site, which makes budgeting easier across many locations.
The 10 Best Network Management Software Tools in 2026
1. SolarWinds Network Performance Monitor (NPM)
SolarWinds NPM is one of the most widely used enterprise monitoring platforms. It polls devices with SNMP v1, v2c, and v3, and analyzes traffic with NetFlow and sFlow. Its topology mapper builds network maps from the relationships it finds. The alerting engine also supports dependency-aware suppression, so you get less noise during big outages.
Key strengths: Deep SNMP coverage across Cisco, Juniper, HPE, and Aruba; PerfStack troubleshooting that links network and server metrics; integrations for ServiceNow, Jira, and PagerDuty.
Best for: Large enterprises with multi-vendor networks that need detailed SNMP monitoring and a mature alerting framework.
Limitations: Per-element licensing adds up fast at high device counts. You also need dedicated network ops staff to set it up and maintain it.
2. Paessler PRTG Network Monitor
PRTG uses sensor-based pricing, where each metric you monitor uses one sensor from your pool. It supports SNMP, WMI, REST APIs, NetFlow, and SSH. You can run it as a self-hosted appliance or as a cloud service. Auto-discovery builds a device inventory on the first scan, and the map editor lets you create custom topology views.
Key strengths: Sensor pricing gives cost certainty; a broad out-of-box sensor library; an on-premises option for data-residency needs.
Best for: Mid-market IT teams that want wide coverage without per-device pricing headaches.
Limitations: Sensor counts can grow fast in busy environments. Advanced customization also requires scripting skills.
3. ManageEngine OpManager
ManageEngine OpManager brings network, server, and VMware monitoring into one platform. It polls with SNMP, WMI, and CLI, and includes a built-in topology mapper. It also connects natively with ServiceDesk Plus, AssetExplorer, and other ManageEngine tools.
Key strengths: Network and server monitoring in one place; native ManageEngine ITSM integration; automatic Layer 2 topology maps from discovery.
Best for: Teams that already use the ManageEngine product suite.
Limitations: The interface is dense and takes time to learn. Licensing also varies across feature tiers.
4. Datadog Network Performance Monitoring
Datadog NPM is a cloud-native module that tracks network flows between hosts, services, and containers. It uses an agent on each host to capture connection data. It then ties that data to APM, infrastructure metrics, and logs in one platform.
Key strengths: Tight links to app and infrastructure monitoring in one platform; container and Kubernetes visibility; no on-premises hardware needed.
Best for: Cloud-native teams whose app performance depends closely on network performance.
Limitations: It is weaker for traditional switch and router monitoring. SNMP-based polling is also not a core feature.
5. LogicMonitor
LogicMonitor is a SaaS platform that monitors network devices, servers, cloud services, and apps. It works through a single agent or an agentless collector. Also, supports SNMP, WMI, REST APIs, and JMX. It also ships with a large library of modules for hundreds of vendor devices.
Key strengths: Broad coverage across physical, virtual, and cloud infrastructure; dynamic thresholds and anomaly detection; strong MSP and multi-tenant support.
Best for: Enterprise IT teams and MSPs that manage many clients or sites.
Limitations: Pricing sits at the premium end. Deep configuration also takes real upfront effort.
6. Zabbix
Zabbix is an open-source monitoring platform with no per-device or per-host fees. It supports SNMP, IPMI, JMX, HTTP checks, and agent-based monitoring. It also gives you a flexible engine for triggers and alerts.
Key strengths: No licensing costs; highly customizable templates; a strong community and many third-party integrations.
Best for: Teams with engineers who can invest time to set up and maintain an open-source tool.
Limitations: It has no commercial support by default. It also takes far more engineering time than commercial SaaS tools.
7. Auvik
Auvik is a cloud-based platform built for MSPs and teams that manage distributed networks. It auto-discovers devices, builds topology maps, and monitors performance through SNMP and syslog. Speed is its main selling point. Most environments get mapped within minutes of deploying the collector.
Key strengths: Fast deployment and automatic topology maps; multi-site management from one console; built-in network documentation and config backup.
Best for: MSPs and mid-market teams that manage many sites and want fast, low-effort setup.
Limitations: It is not built for deep application-layer visibility. It is also less extensible than enterprise platforms.
8. Cisco Catalyst Center (formerly DNA Center)
Cisco Catalyst Center is Cisco’s management and intent-based networking platform. It is built for environments that run mostly Cisco hardware. It covers discovery, configuration, policy enforcement, and assurance across Cisco switches, routers, and wireless controllers.
Key strengths: Deep integration with Cisco hardware and firmware; intent-based networking and policy automation; AI-driven anomaly detection in Cisco environments.
Best for: Teams that run mostly Cisco gear and want tight vendor integration.
Limitations: It is built for Cisco-centric setups. Multi-vendor support is limited, and its value depends on how much Cisco hardware you run.
9. NinjaOne
NinjaOne is mainly a remote monitoring and management (RMM) platform. It adds network monitoring through its agent-based design. It covers endpoint health, patch management, and basic network device monitoring. So it suits teams that want one agent for both endpoints and network devices.
Key strengths: Endpoint and network monitoring in one agent; cloud-native with strong automation; a clean interface with low admin overhead.
Best for: SMB and mid-market teams that want combined endpoint and network visibility without a dedicated network ops setup.
Limitations: Its network monitoring is shallower than dedicated NMS tools. It also does not fit complex multi-vendor environments that need detailed SNMP analysis.
10. Virima — Network Device Discovery and CMDB Integration
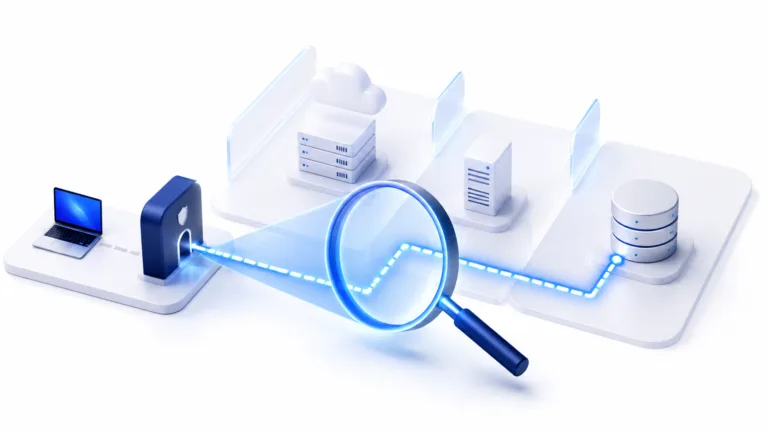
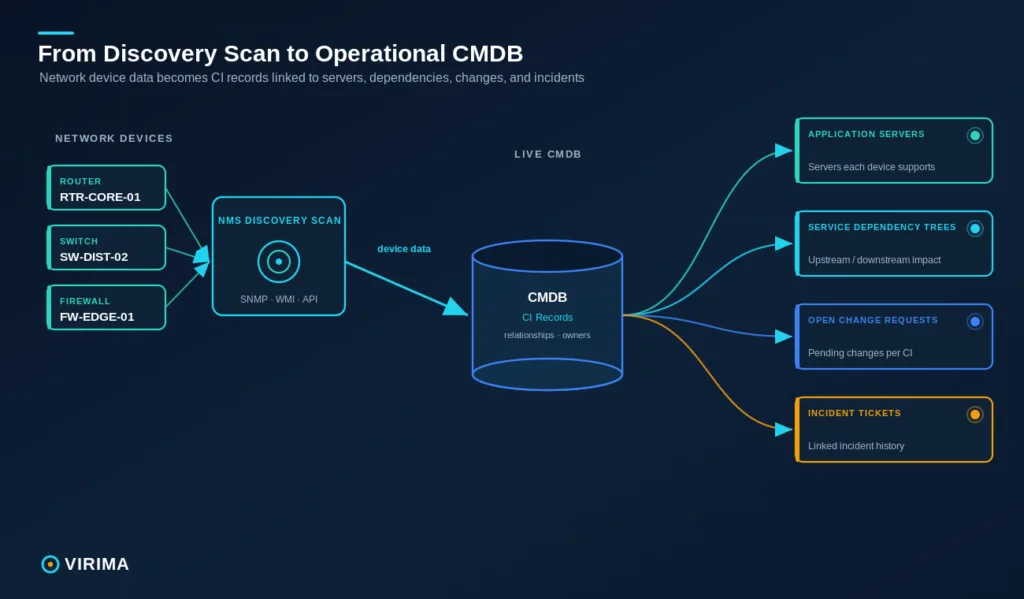
Virima takes a different angle than the tools above. Traditional NMS platforms focus on performance monitoring and alerting. Virima’s IT discovery engine instead finds network devices across hybrid environments. It uses agentless SNMP, WMI, and API-based scanning to do this. Then it feeds that data into a live, accurate CMDB rather than a performance dashboard.
The result links your network device data to the rest of your IT infrastructure. You can see which apps run on which servers, and which servers connect through which switches. You can also see the blast radius of a change before you make it. ViVID(tm) service maps show these dependencies clearly. So your team knows which services are at risk when a device fails or goes offline for maintenance.
Key strengths: Network device CIs flow automatically into a live, accurate CMDB with full relationship tracking; service dependency mapping ties network failures to application impact; IT asset management tracks network hardware lifecycle and contracts; it integrates with ServiceNow, Jira Service Management, Ivanti, HaloITSM, Xurrent, Hornbill, and TeamDynamix.
Best for: IT teams that need network device data tied to CMDB accuracy, change impact analysis, and ITSM workflows.
Limitations: Virima does not replace a performance monitoring tool. Pair it with a dedicated NMS platform for bandwidth analysis, NetFlow reporting, or threshold-based alerts.
Explore the Trusted Runtime Truth platform to see how network discovery data becomes useful across change, incident, and compliance workflows.
What Most Network Management Tools Don’t Cover
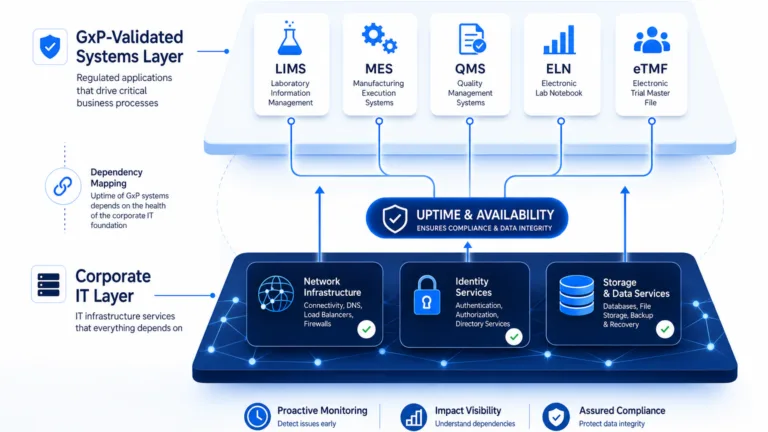
Performance dashboards answer one question: is this device up? A CMDB answers a harder one: what breaks if this device goes down?
Most NMS platforms generate alerts. But they lack the configuration item (CI) data to connect a failing switch to the services it supports. So when an alert fires, the next question is hard to answer: what does this affect, and who owns it? Usually you have to look it up in another system. Or you follow a runbook that may already be out of date.
NIST SP 800-82 Rev 3 is the leading guidance on operational technology security. It names an accurate asset inventory as a must-have for network security. The same idea applies to operations. You cannot manage what you have not documented well.
Teams that build a CMDB from discovery data close this gap. The devices your discovery tools find become CIs with tracked relationships. You can see which servers they connect to and which services those servers support. You can also see which incidents have touched them and which change requests are open. As a result, network management becomes a real discipline instead of a reactive alert queue.
Understanding your network topology is the foundation. Discovery-driven CMDB data is what makes that topology useful at scale.
The gap matters most in three situations:
- You schedule a network change and need impact analysis before the maintenance window opens
- An incident is open and root cause means tracing application dependencies back to one network device
- An audit is underway and you must show configuration history for network infrastructure
Network management software handles the first mile. It detects, alerts, and displays performance data. The CMDB handles the mile that follows. It connects what happened on the network to what it means for your services, teams, and compliance duties.
How to Choose Network Management Software
What is your network scale? Device count and site count drive both licensing cost and architecture fit. Cloud-native tools like LogicMonitor and Auvik handle distributed setups well. Self-hosted tools like PRTG and Zabbix give you more control, but they need more upkeep at scale.
How varied is your infrastructure? Multi-vendor networks that mix Cisco, Juniper, Aruba, and HPE need wide SNMP and vendor-specific MIB support. If you run only Cisco gear, Catalyst Center can give you deeper native integration.
Do you run hybrid cloud? Tools that poll only on-premises devices will miss AWS VPC, Azure Virtual Network, and software-defined components. So test cloud discovery against your real environment before you buy.
How does the tool connect to your ITSM? Check the integration depth. Find out what data passes between systems, in which direction, and whether it costs extra.
What can your team operate? Open-source options cost less but need engineering time. SaaS platforms trade some customization for faster value and lower upkeep.
Making Your Network Data Work Beyond the Dashboard
The right network management software depends on your environment, your team’s capacity, and your goals. Performance-focused teams in large enterprises often land on SolarWinds NPM or LogicMonitor. Mid-market teams tend to match well with PRTG or ManageEngine OpManager. Cloud-native teams lean toward Datadog. Open-source advocates with engineering resources get strong value from Zabbix.
Over time, most teams learn that monitoring alone is not enough. Knowing a switch is down is only the first step. The real value comes from knowing what it supports, what it affects, and who needs to act. That is what turns an alert into a resolved incident.
Understanding your network topology is the starting point. The next decision is agent-based vs agentless discovery. That choice matters most for teams that build visibility from discovery data rather than manual documentation.
Schedule a Demo at virima.com
FAQ
What is the difference between network management software and network monitoring software?
Network monitoring software tracks device health, such as uptime, bandwidth, CPU, and latency. It then sends alerts when a threshold is crossed. Network management software includes monitoring, but it adds more. It also handles configuration management, change tracking, topology documentation, and capacity planning. Most enterprise platforms cover both, while lightweight tools focus only on health and alerts.
Can network management software work across hybrid cloud environments?
Yes, but only under one condition. The platform must support API-based discovery for clouds like AWS and Azure, not just SNMP polling for on-premises devices. Tools built entirely on SNMP will miss cloud-hosted network components. So test discovery against your real cloud setup rather than trusting vendor documentation alone.
Why do network topology maps often show inaccurate or incomplete data?
Topology maps go stale for a few reasons. Discovery may run too rarely, or new devices may sit outside the scan scope. Cloud infrastructure may also change faster than scheduled scans can track. The fix is frequent discovery cycles and automatic CI updates in a CMDB. Together, they keep your topology data current.
How does Virima complement network management software?
Virima’s IT discovery engine finds network devices across hybrid environments. It then fills a CMDB with their CI records, relationships, and ownership data. NMS platforms answer whether a device is healthy. Virima answers what that device supports and what breaks if it goes down. The two work well together. Monitoring handles alerts and performance, while Virima adds the CMDB context that makes those alerts useful for change, incident, and compliance work.
Does Virima replace a dedicated network performance monitoring tool?
No. Virima focuses on IT discovery, CMDB population, and service dependency mapping. It does not alert on performance thresholds or generate traffic flow reports. So use Virima alongside a dedicated NMS platform. Together, they give you accurate CI records and high-frequency performance monitoring.