Shadow SaaS Grows Faster Than Manual Tracking Can Follow

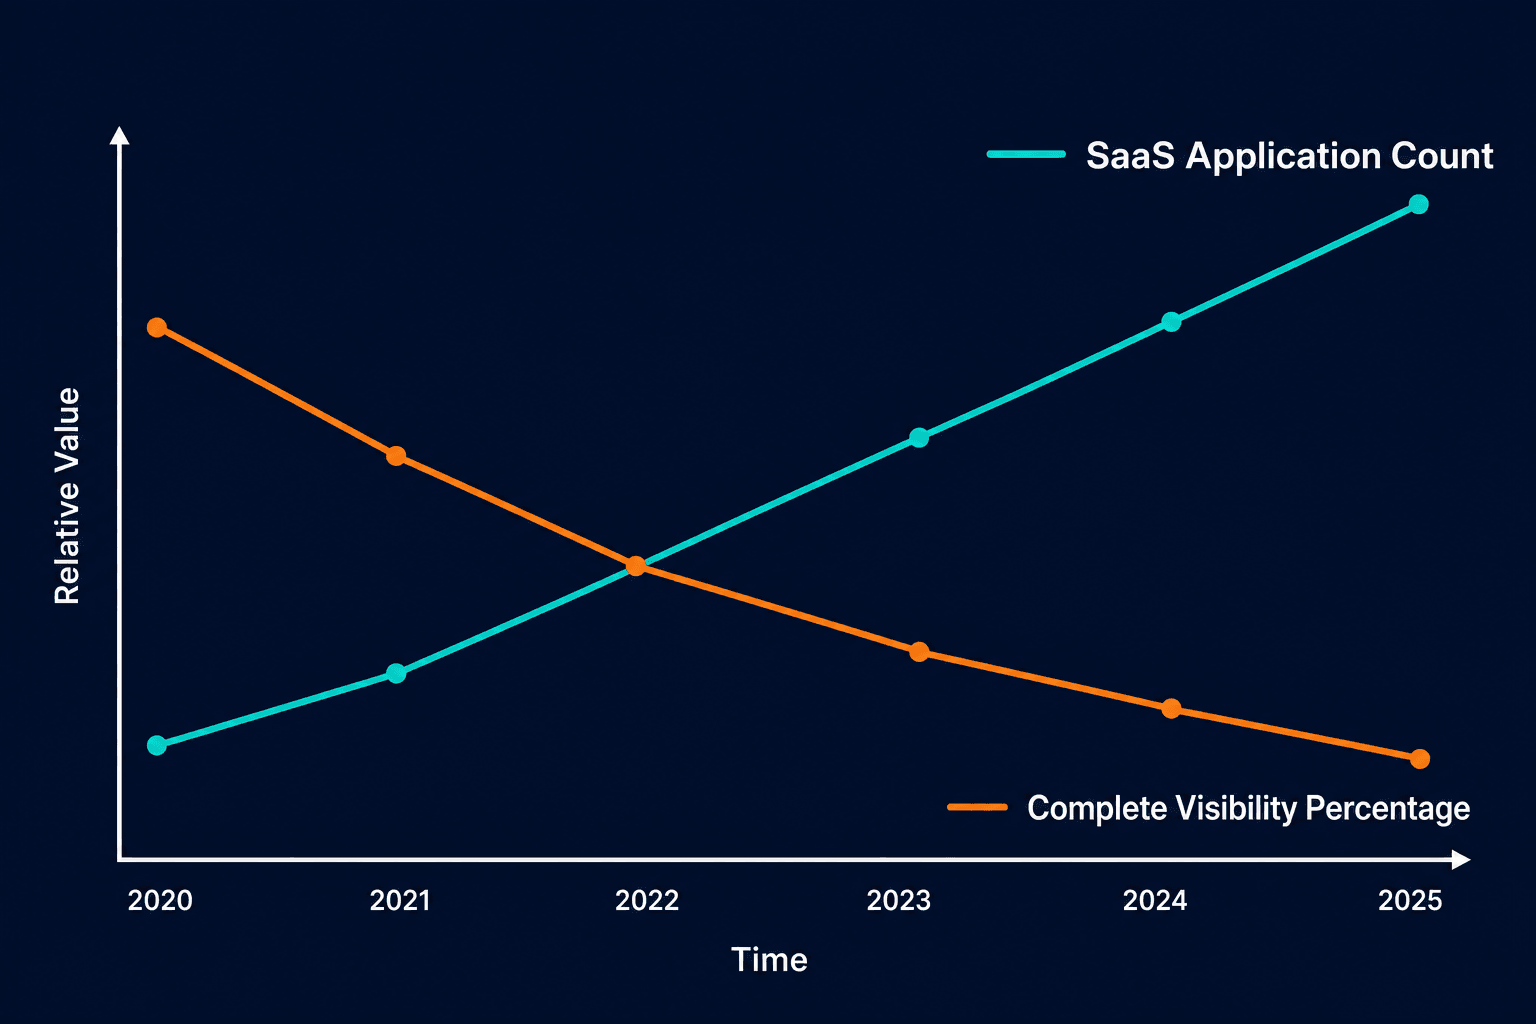
If you manage IT assets for a living, here is an uncomfortable number: only 36% of enterprises say they have complete visibility into their technology estate, down from 43% just a year earlier. Whatever is in the spreadsheet, the gap between it and reality got bigger this year, not smaller. That is not a tooling failure or a discipline problem. It is what happens when a snapshot method runs against a continuous-change environment, and the rate of change keeps accelerating.
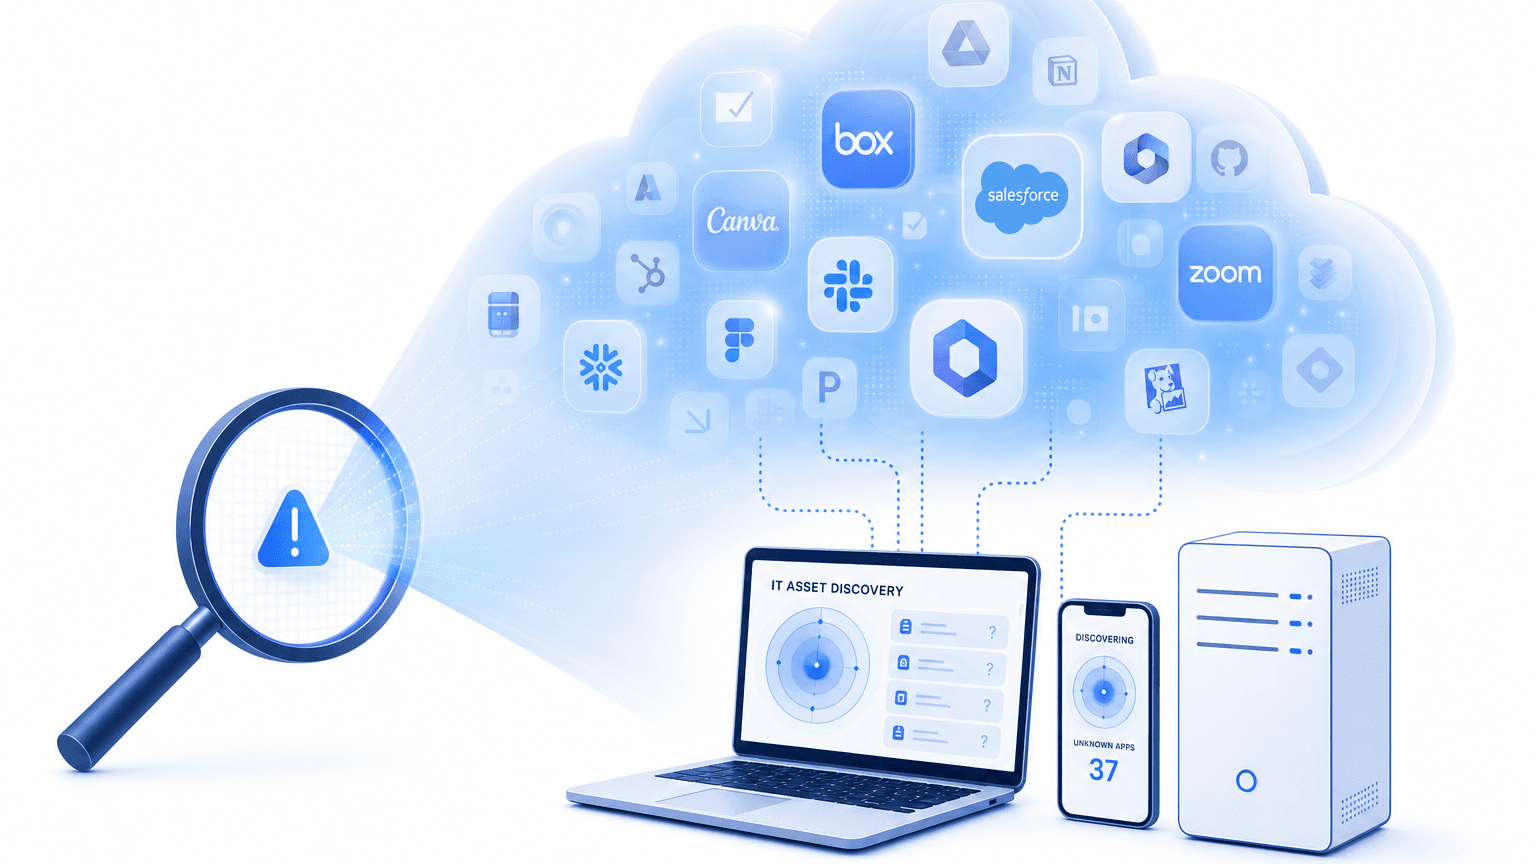
Shadow SaaS is the subscription software running in your environment that IT never approved, provisioned, or added to the asset record — and it is the layer manual tracking is built to miss. This piece is not about SaaS spend visibility or subscription reconciliation. Tools built on SSO logs and expense data do that job well. This piece is about the question those tools are not built to answer: what is actually installed and running across managed endpoints, unmanaged devices, and network segments- the asset-inventory question the ITAM Manager’s record has always owned, now moving faster than the method used to answer it.
The shadow SaaS gap is growing, not static
The SaaS footprint problem is a growth-rate problem, not a fixed backlog to clear.
Mid-market organizations’ SaaS footprints grew 41% in a single year (BetterCloud 2026 State of SaaS Report). The average company now manages roughly 305 SaaS applications, with total apps in use up 11% year over year (Zylo 2026 SaaS Management Index). Every self-service signup, every browser-installed app, every SaaS trial that bypasses a purchase order adds to a count the quarterly review will not catch in time.
For the ITAM Manager, the financial stakes are specific. Enterprises waste up to 30% of IT budget on underutilized or redundant licenses, and 23% exceeded $5 million in software audit costs over the same period, per the same Flexera report. Those numbers don’t belong to a generic “IT efficiency” conversation. They belong to the ITAM Manager’s audit-defense line items.
The visibility trend makes this harder to dismiss as a temporary gap. A year-over-year drop from 43% to 36% complete visibility means the direction of travel is wrong. More apps, less visibility, and the same quarterly review cycle trying to bridge both.
How much has enterprise SaaS footprint grown, and why does it matter for asset management?
Mid-market SaaS footprints grew 41% in a single year, and complete tech-estate visibility fell from 43% to 36% in the same period (Flexera 2026 State of ITAM Report; BetterCloud 2026 State of SaaS Report). A quarterly review cycle cannot close a gap that accelerates between each cycle. That combination is a SaaS sprawl visibility problem, not a discipline problem.
You don’t actually know how exposed you are
The approval-gap numbers span a wide range, and the range itself is evidence of the blind spot.
BetterCloud’s 2026 report finds only 56% of apps in use carry IT approval; roughly 44% do not. Cledara’s 2026 guide puts the unsanctioned share as high as 65%. Different vendors, different methodologies, same direction. Nobody can produce a precise number for apps that are, by definition, outside the record. The uncertainty is not a research flaw. It is the measurement problem the ITAM Manager has to manage.
Ghost assets compound this from the inside. Organizations relying on manual counts carry a 12-25% ghost-asset rate in their own inventory records (Virima IT Asset Tracking: Methods, Gaps, and Best Practices, citing OnPoint Service). That means the spreadsheet is not only missing shadow apps outside the record, but it is also overstating the managed estate at the same time. An auditor arriving with a true-up request finds both problems at once. The same pattern shows up in CI lifecycle audits: ghost servers left in the CMDB after decommissioning quietly inflate license and asset counts the same way shadow SaaS deflates them.
Secondary stakeholders feel this too. Procurement leads face unexpected true-up charges tied to entitlements nobody reconciled. CISOs carry unmanaged software as an attack surface with no owner of record. FinOps leads own the wasted-spend number when the quarterly variance surfaces. The ITAM Manager’s record is the common thread each of those conversations pulls on.
Shield your organization from audit exposure. See how Virima’s Trusted Runtime Truth surfaces the gap between your asset record and what’s actually running.
What percentage of company software is typically unsanctioned or unapproved?
Research puts the unsanctioned share between 44% and 65% of apps in use, depending on methodology (BetterCloud 2026; Cledara 2026). The spread reflects the measurement problem itself: apps outside the approval record are, by definition, difficult to count precisely.
Why the spreadsheet can’t close the gap
Manual tracking is a snapshot method. SaaS procurement is a continuous-change environment. A method built on periodic review will always trail a rate of change that doesn’t pause between cycles.
The structural gap runs deeper than tooling. Sixty-two percent of IT leaders say manual work is actively preventing strategic projects (BetterCloud 2026), and offboarding is one of the clearest casualties: former employees can retain access to apps that never surface in the asset record as candidates for reclamation, because nobody owns the reconciliation step.
Whoever is accountable for keeping the inventory current is structurally short on time to do it. That is a capacity constraint built into the method, not a failure of individual effort.
One boundary worth stating early: SaaS-spend and subscription-management platforms are built to close the billing-and-renewal version of this problem. BetterCloud, Zylo, Cledara, and similar tools sit on SSO logs and expense data, and they do that job well. A company running both a SaaS-spend tool and an endpoint discovery approach is solving two different halves of the same fear, not choosing between competing claims on one problem. The distinction matters because the resolution in the next section addresses only the endpoint- and infrastructure-level gap.
Why can’t spreadsheets keep up with SaaS sprawl?
Spreadsheets are snapshot methods in a continuous-change environment. SaaS footprints grew 41% in one year; a quarterly review cycle cannot track daily change. BetterCloud’s 2026 report also finds 62% of IT leaders say manual work blocks strategic projects, leaving the team structurally short on capacity to reconcile an accelerating count.
Closing the shadow SaaS gap: what actually keeps pace
Closing the endpoint- and infrastructure-level shadow-IT gap requires a tracking method that runs on a discovery cycle, not an audit cycle.
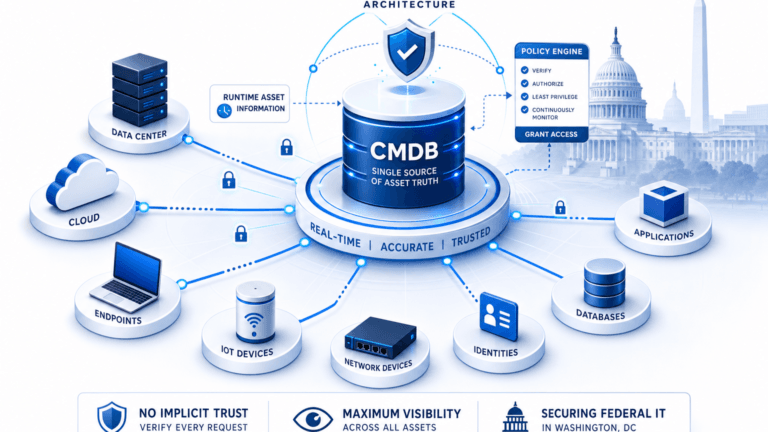
Agent-based endpoint discovery finds installed software and usage data on managed devices, the same devices where self-service SaaS installs land, regardless of whether a purchase order ever existed. Agentless network discovery — a form of unmanaged software discovery — finds devices and servers that bypassed the procurement process entirely. API-based discovery reconciles cloud infrastructure state against the record. Together, these methods feed a CMDB that narrows the gap between the record and reality on every discovery cycle. That is the same gap that leaves manually tracked estates carrying a 12-25% ghost-asset rate.
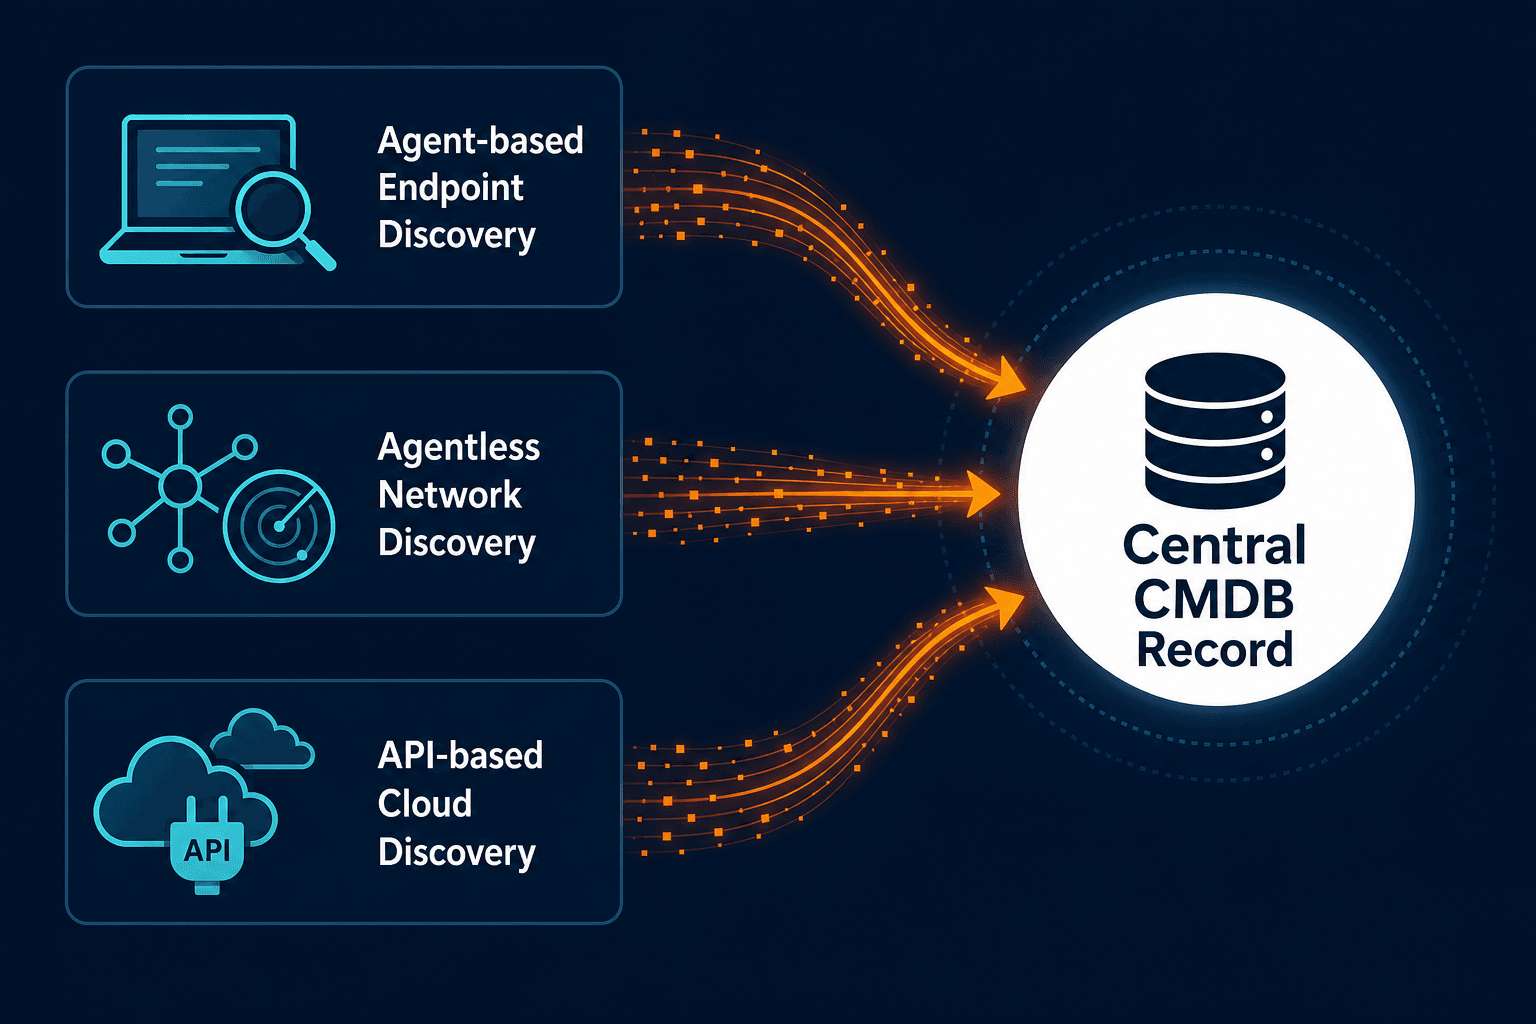
Virima’s discovery covers three areas:
- Installed software and usage discovery on managed endpoints
- Agentless discovery of devices and servers that were never in the request queue
- License entitlements reconciled against actual installs
The output is a CMDB with audit history showing what changed and when — a record built for IT asset inventory accuracy, one the organization can defend in a true-up conversation because it reflects what is actually running, not what was running at last quarter’s review.
For organizations that have deployed Virima’s ViVID™ service maps, discovered assets also carry dependency context, which business services they feed and what breaks if they change. That context does not come from a spend-reconciliation tool.
For a closer look at the discovery methods that feed this record, see the agent-based vs. agentless discovery comparison on the Virima blog.
Where to start: turning a vague fear into a measured gap
Four steps convert the suspicion that the inventory is incomplete into a number the organization can act on:
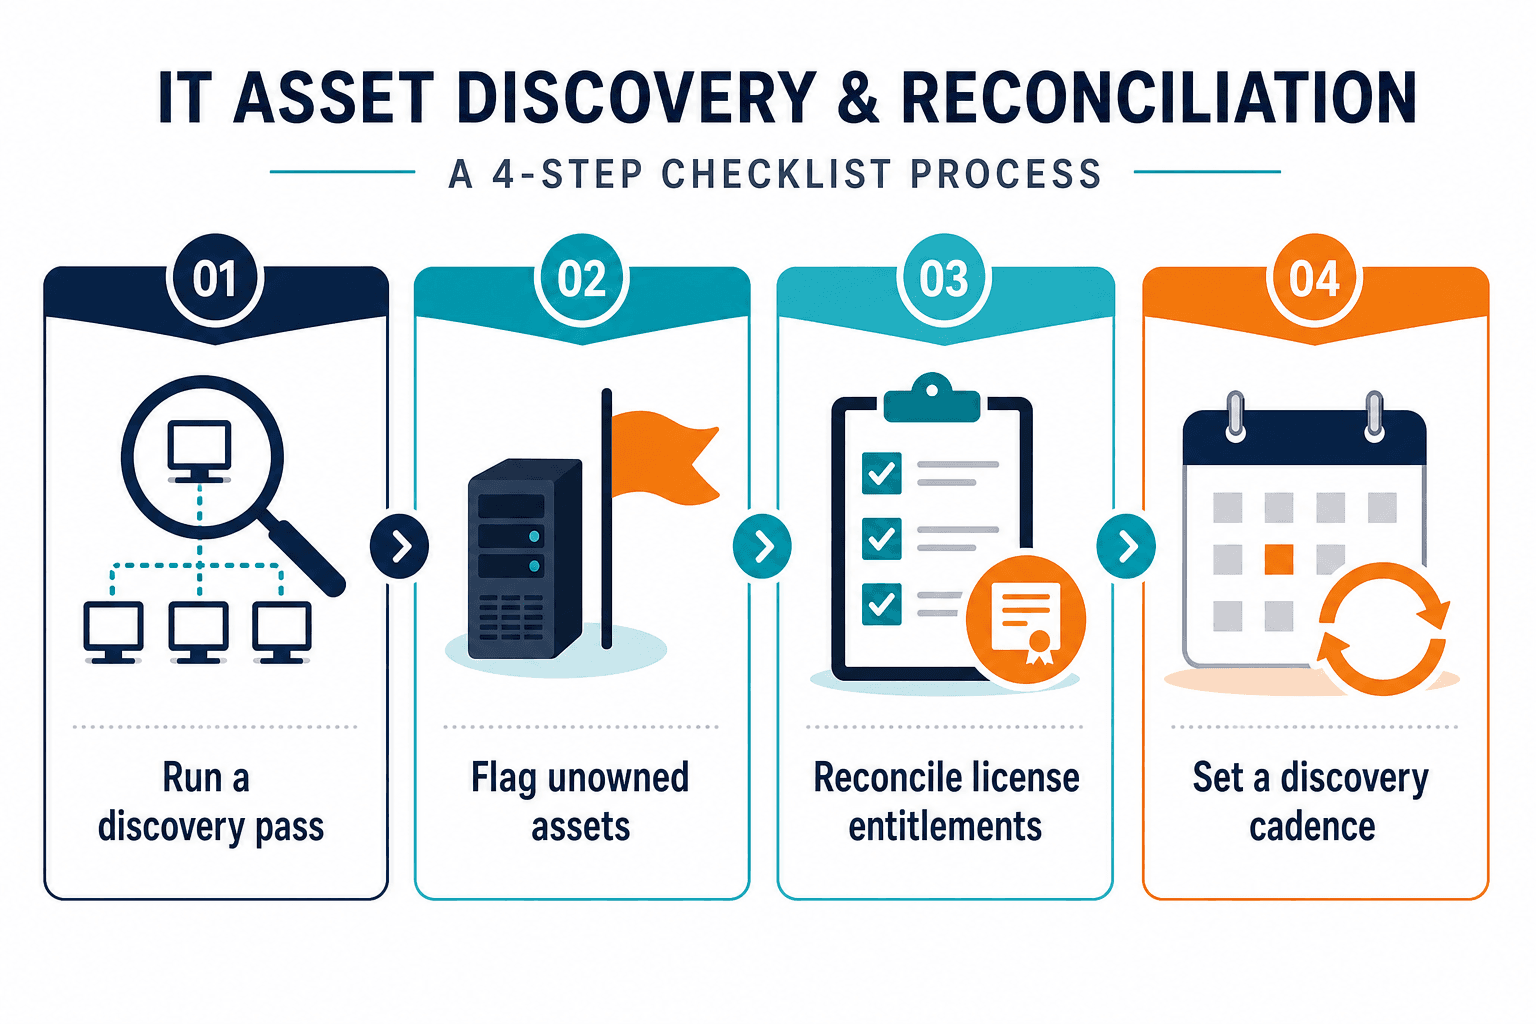
Run a discovery pass and compare the count against the current CMDB or inventory record. The delta is the actual exposure, not an estimate, not a vendor projection.
Flag every discovered asset with no owner of record. Unowned assets are the fastest path from unknown to audit-finding, and they surface quickly in a discovery pass.
Reconcile license entitlements against actual installs using the current discovery output. Last quarter’s audit list is not the right baseline when the footprint grew 41% in a year.
Set a discovery cadence, not a review cadence, for the assets that matter most. A quarterly review cannot track a daily rate of change. High-frequency discovery cycles close the gap a scheduled audit leaves open.
Closing this gap directly targets the audit-cost exposure named earlier — the $5-million-plus true-up risk and the 30% licensing waste are both symptoms of a review cadence that can’t keep pace, and a discovery cadence closes both at once.
None of these steps require a full platform migration to start. A single discovery pass against a known network segment will surface the difference between the record and reality quickly enough to inform whether the current method is still fit for purpose. For context on what a modern ITAM discovery program covers, the Virima ITAM feature page outlines the approach.
Shadow SaaS is not only a spend problem. It has an endpoint and infrastructure footprint that grows faster than any manual method can track, and the industry’s own visibility numbers are moving the wrong way. Closing that gap requires a tracking method that matches the rate of change, running on a discovery cycle, reconciling entitlements against what is actually installed, and surfacing unmanaged devices before an auditor does. That gap is solvable once the method matches the environment.
Frequently Asked Questions
What is shadow SaaS, and how is it different from shadow IT more broadly?
Shadow IT refers to any technology, hardware, software, or services used without IT’s knowledge or approval. Shadow SaaS is the software-subscription layer of that problem: apps employees sign up for directly, often via a credit card or free trial, that bypass the procurement process. The distinction matters because shadow SaaS has two distinct footprints. One is a billing and subscription footprint, tracked by spend-management tools. The other is an installed-software and network footprint, tracked by endpoint and network discovery. Most content on shadow SaaS addresses only the first.
What is the real cost of an inaccurate IT asset inventory?
Shadow SaaS risk runs across three cost buckets. License waste accounts for up to 30% of IT budget lost to underutilized or redundant licenses (Flexera 2026 State of ITAM Report). Audit penalties are direct: 23% of organizations exceeded $5 million in software audit costs, per the same Flexera 2026 State of ITAM Report. Ghost assets, inventory records for assets that no longer exist, make up 12-25% of records in manually tracked estates, inflating entitlement counts and complicating true-up negotiations. Unmanaged software also represents an attack surface with no owner of record, a cost that lands on the security budget rather than the ITAM budget.
How does continuous discovery find shadow SaaS that manual tracking misses?
Agent-based discovery finds software installed on managed endpoints, including apps deployed outside the procurement process, and captures usage data that shows whether an entitlement is active or idle. Agentless network discovery finds devices and servers that never entered the request queue. API-based discovery reconciles cloud infrastructure state. Running these methods on a regular discovery cadence, rather than a quarterly audit cycle, surfaces new installs and unmanaged assets between review windows. That’s when the gap is still small enough to act on before a true-up.
What does Virima discover that SaaS-spend platforms don’t cover?
SaaS-spend platforms sit on SSO logs and expense data; they are built to find subscriptions being paid for and reconcile them against usage. Virima’s discovery finds the installed-software footprint on managed endpoints, unmanaged devices and servers that bypassed procurement, and cloud infrastructure state. The two are complementary: one closes the billing-and-renewal gap, the other closes the installed-software and network-device gap. For organizations running both, Virima feeds the CMDB and license entitlement record; the spend platform manages the subscription and renewal layer.
Why is visibility into the tech estate getting worse, not better?
Investment in ITAM tooling has increased industry-wide, yet Flexera’s 2026 report shows the visibility number moving in the wrong direction. The reason isn’t tooling adoption; it’s growth rate. SaaS footprints at mid-market organizations grew 41% year over year, and 62% of IT leaders report manual work is blocking the strategic capacity needed to close the gap. A tool purchased on a quarterly renewal cycle still runs against a snapshot process; unless the discovery cadence itself changes, buying more tooling doesn’t fix a method that can’t keep pace with the growth rate driving it.