When Black Friday Traffic Spikes: ITOM in Retail and E-commerce

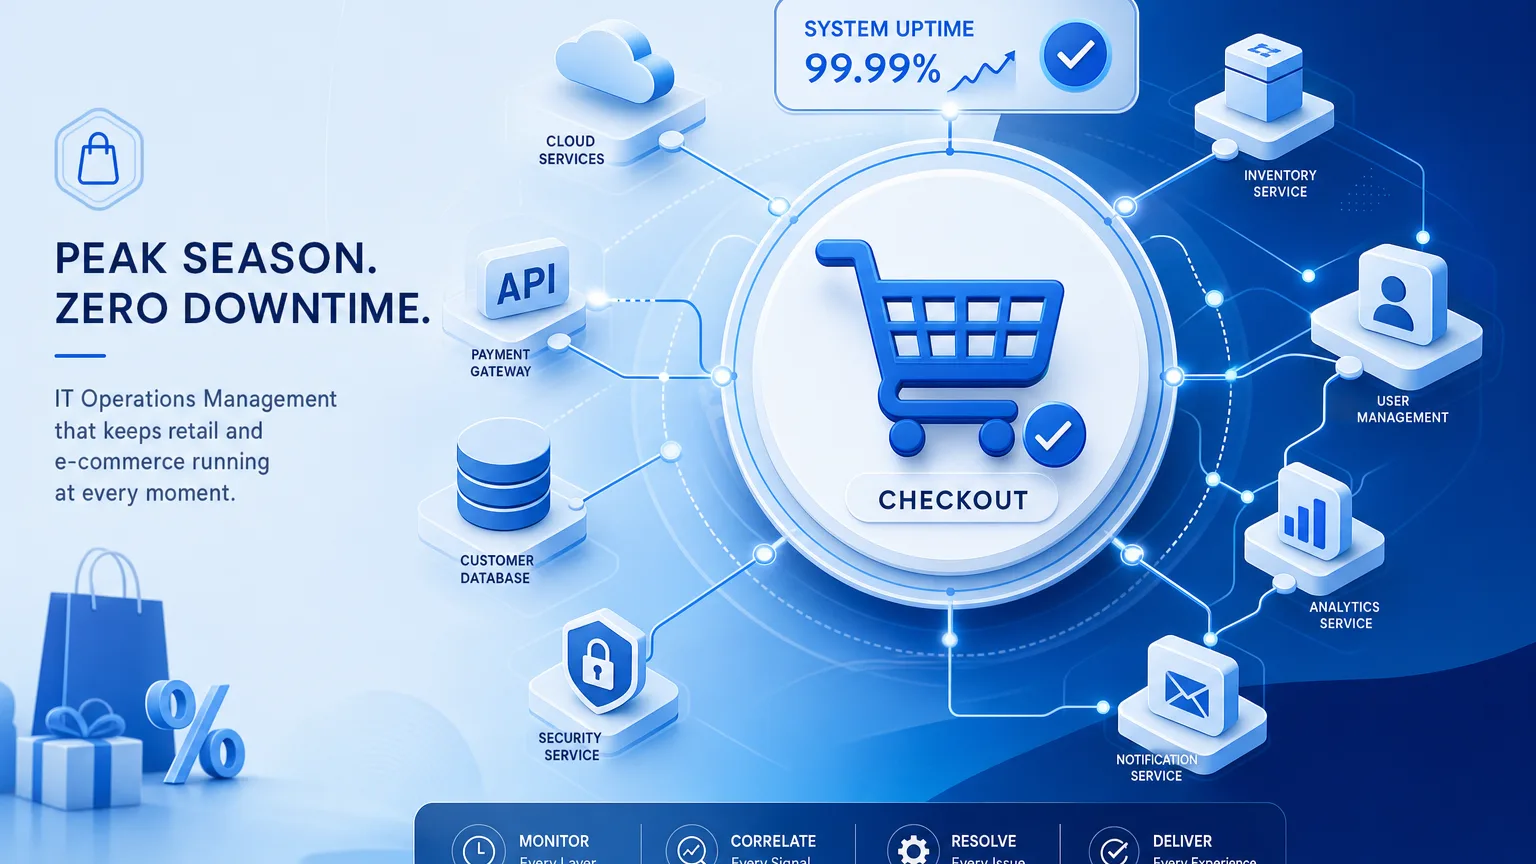
A smooth checkout experience during Black Friday or Cyber Monday looks simple to a consumer. Underneath that single click lies a complex ecosystem of microservices, third-party payment APIs, inventory databases, enterprise resource planning (ERP) systems, and edge fulfillment networks. When traffic volumes surge during peak shopping seasons, small technical flaws turn into revenue-destroying blackouts.
According to research from Pingdom Industry Downtime Benchmarks, enterprise downtime averages $5,600 per minute across standard operational periods. For high-volume retail and e-commerce operations during peak promotional events, that figure frequently surpasses $14,000 per minute. Preventing these high-stakes outages requires a dedicated operational strategy. Implementing ITOM in retail and e-commerce gives infrastructure teams the discovery-sourced data and service visibility needed to keep mission-critical shopping systems available when sales volumes reach their highest levels.
The high stakes of ITOM in retail and e-commerce during peak season
Peak shopping seasons produce a massive surge in digital foot traffic. According to the Adobe Analytics Cyber Five Report, global online shoppers spent over $38 billion during the Cyber Five period alone. For enterprise retailers, this compressed window generates a major portion of annual revenue. Transaction volumes climb sharply above baseline during that window, straining payment gateways, inventory databases, order management systems (OMS), and point-of-sale (POS) integrations at the same time.
| TRADITIONAL IT OPERATIONS | ITOM RUNTIME TRUTH |
|---|---|
| Siloed Infrastructure Monitoring Independent server/APM alerts without business context | Unified Service Dependency Map Automated CI-to-business-service mapping |
| Static CMDB & Spreadsheet Inventories Stale configuration data and unmapped shadow IT | High-Frequency Discovery Cycles Discovered CIs and dynamic state reconciliation |
| Blind Change Approvals in Freeze Windows Emergency patches break critical payment APIs | Blast Radius & Impact Analysis Pre-change risk scoring before ticket execution |
| OUTCOME: Cascading Outages & Extended MTTR | OUTCOME: 99.99% Uptime & Rapid Triage |
During these critical hours, system slowdowns directly reduce conversion rates. Research from the Akamai Retail Performance Benchmark demonstrates that a 100-millisecond delay in website load time can lower conversion rates by 7%, while a two-second delay increases bounce rates by 103%. When systems crash entirely, the impact extends beyond immediate sales loss. Customers abandoned at a frozen checkout counter quickly move to a competitor, causing long-term customer lifetime value erosion.
Why retail systems are uniquely vulnerable during peak demand
Retail IT environments are uniquely vulnerable during peak demand periods due to four operational factors:
Extreme Burst Scaling: On-premises and multi-cloud environments scale up dynamically to absorb traffic spikes, creating ephemeral cloud workloads that disappear before traditional tools detect them.
Complex Third-Party Dependencies: Payment processing gateways, tax calculation engines, address verification services, and fraud detection APIs run outside the retailer’s direct network control.
Omnichannel Fulfillment Intertwining: In-store POS terminals, mobile checkout apps, buy-online-pickup-in-store (BOPIS) systems, and warehouse management systems (WMS) share centralized inventory databases. A slowdown in one channel cascades across all others.
Freeze-Window Emergency Changes: While code freezes restrict routine software deployments, emergency configuration tweaks, security patches, and database index adjustments still occur, often without complete visibility into downstream dependencies.
Navigating these challenges requires establishing a single source of operational truth across all retail infrastructure layers.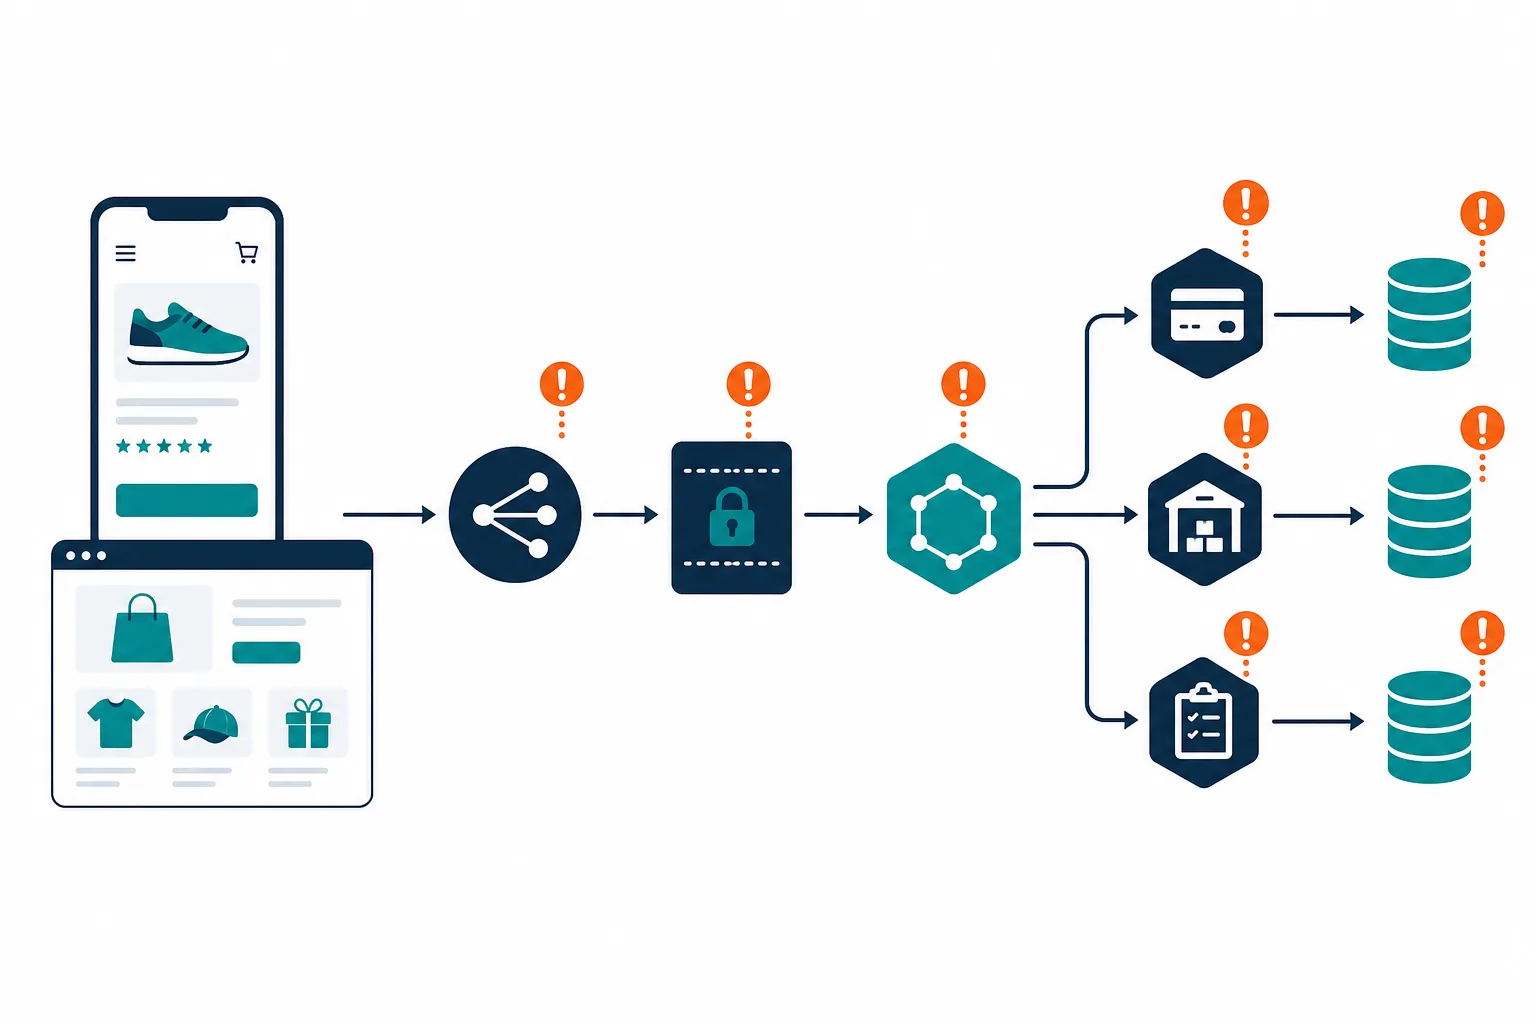 To de-risk digital transformation and protect peak revenue, enterprise CMDB owners and IT leaders rely on Virima’s Trusted Runtime Truth to maintain complete operational visibility across hybrid e-commerce architecture.
Why is ITOM critical for retail and e-commerce during peak shopping seasons?
ITOM in retail and e-commerce provides high-frequency asset discovery, configuration health scoring, and dynamic service dependency mapping. It allows IT teams to identify single points of failure, evaluate change risks before freeze windows, and isolate root causes instantly when surge traffic stresses e-commerce infrastructure.
Key ITOM capabilities required for e-commerce system availability
Not all IT operations tools handle the pace of modern e-commerce. Legacy monitoring systems alert teams when a server CPU exceeds 90% utilization, but they fail to explain which business service is affected. Effective retail ITOM bridges the gap between infrastructure health and customer-facing business outcomes, building on the same discovery-sourced operational visibility that underpins ITOM everywhere, adapted to retail’s peak-season stakes.
High-frequency asset discovery across hybrid cloud
Retail architectures rarely sit in a single cloud. Core transaction engines often reside on-premises or in private clouds for security and compliance, while web storefronts scale horizontally across public clouds like AWS and Azure.
Running credentialed IT discovery through agentless and lightweight agent-based scans captures rapid infrastructure shifts. High-frequency discovery identifies newly provisioned cloud instances, containerized microservices, and network devices, so no shadow IT asset operates outside operational governance.
Multi-source CMDB data reconciliation
A Configuration Management Database serves as the core operational repository for IT infrastructure. However, retail CMDBs frequently become stale due to rapid multi-cloud provisioning and unrecorded manual tweaks.
Deploying an enterprise CMDB with multi-source data reconciliation ingests configuration data from cloud providers, hypervisors, and network tools. It normalizes those records into a single source of truth. When IT teams know exact software versions, patch levels, and hardware specifications across the enterprise, they eliminate blind spots before high-traffic events begin.
Change risk and blast radius analysis
During peak retail seasons, IT organizations implement change freezes to prevent disruptions. Yet emergency changes remain unavoidable when zero-day vulnerabilities or database bottlenecks emerge.
Discovery-sourced change risk analysis evaluates proposed adjustments against live configuration data. Mapping the blast radius of a patch or configuration change per best practices in our guide to IT change management shows IT leaders exactly which payment APIs, fulfillment modules, or POS terminals will be impacted. That visibility lets them approve changes with confidence in ITSM platforms like ServiceNow, Jira, Ivanti, and HaloITSM.
How does ITOM prevent e-commerce change-induced outages during Black Friday?
ITOM correlates proposed infrastructure changes against live CMDB data to perform automated blast radius analysis. This reveals hidden application dependencies and downstream risks, allowing IT operations teams to validate emergency patches safely without risking storefront downtime during critical shopping windows.
Proactive uptime strategies for peak shopping seasons
Maintaining system availability during extreme demand requires a structured operational cadence. Successful retail IT organizations structure their uptime strategy across three distinct phases: pre-season preparation, live peak monitoring, and post-peak review.
| Uptime Phase | Key ITOM Focus Area | Operational Objective | Primary Risk Mitigated |
|---|---|---|---|
| Pre-Season Prep (T-90 Days) | Enterprise-Wide Discovery & CMDB Health Audit | Eliminate ghost assets, unmapped CIs, and EOL/EOS software | Single points of failure in checkout/inventory flows |
| Freeze Window (T-14 Days) | Automated Change Blast Radius Mapping | Validate emergency patches against live service dependencies | Unintended service disruption from emergency edits |
| Live Cyber Five Event | Service-Centric Incident & Alert Correlation | Isolate root cause CIs instantly when alerts fire | Prolonged MTTR and revenue loss from triage delays |
| Post-Peak Review | Infrastructure Drift & Capacity Reconciliation | Reconcile temporary cloud scaling with license entitlements | Unbudgeted cloud true-up costs and license non-compliance |
Pre-season preparation: auditing CMDB health and single points of failure
Ninety days (T-90) before major promotional events, retail IT teams must conduct an enterprise-wide discovery audit. This process evaluates three core metrics:
- Completeness — confirming every server, database, switch, and cloud container has complete configuration attributes.
- Relationship accuracy — confirming that application-to-infrastructure dependencies accurately reflect current deployment states.
- End-of-life (EOL) risk — identifying aging hardware or unsupported software versions that lack vendor patch support.
Running enterprise-wide credentialed discovery across all network segments uncovers forgotten staging servers, orphan databases, and misconfigured load balancers that could fail under burst traffic.
Live event execution: service-centric alert correlation
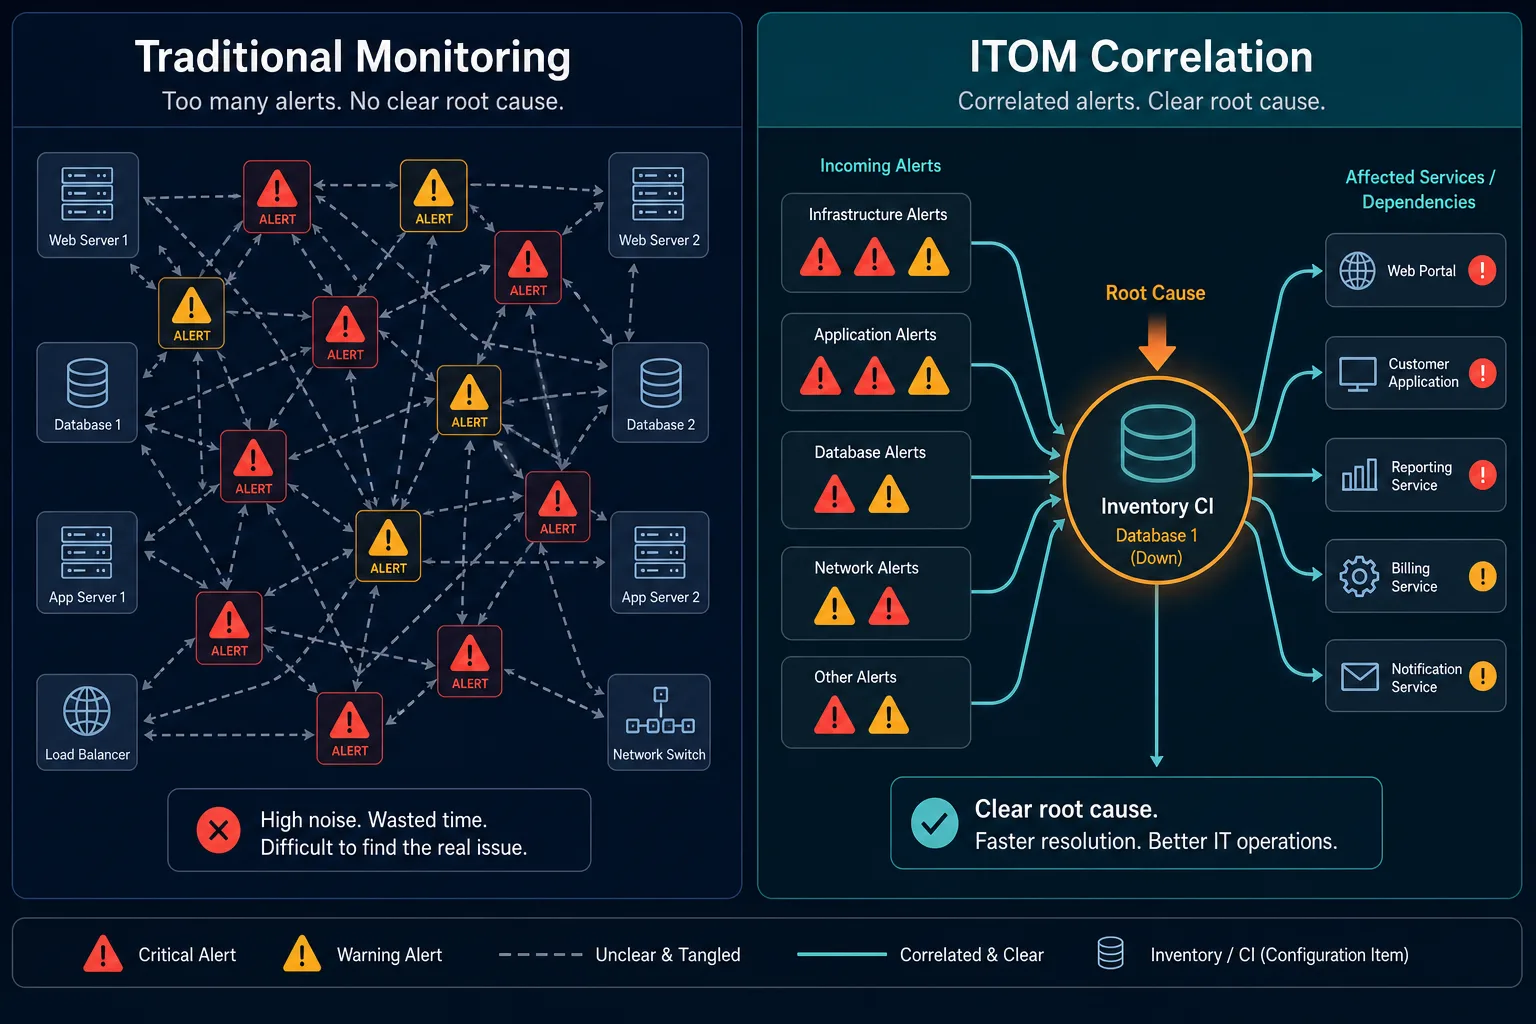
When traffic spikes during Cyber Five, monitoring dashboards flood with thousands of low-level infrastructure alerts. A memory spike on a background microservice can trigger dozens of secondary warnings across network switches and application logs.
Without operational context, SREs and IT operations engineers waste precious minutes determining which alert represents the actual root cause. Service-centric alert correlation links incoming alerts directly to the underlying Configuration Item (CI) and its mapped business service. Following established incident management communication best practices, incident managers instantly identify that a specific database index lock is throttling the primary checkout microservice instead of reviewing 50 isolated server warnings.
What is the difference between traditional monitoring and ITOM service mapping in retail?
Traditional monitoring tracks individual metric thresholds like CPU usage or disk space on isolated assets. ITOM service mapping connects those technical infrastructure components directly to business services, showing IT operations teams how a database slowdown impacts the customer checkout experience in real time.
Connecting infrastructure visibility to business service mapping
A core challenge in retail IT operations is the communication gap between technical teams and business stakeholders. When an outage occurs, executives do not need to know which virtual machine IP address failed. They need to know if online credit card processing or in-store order pickup is down.
Connecting IT discovery data to business service definitions solves this communication gap. With Virima ViVID™ service maps, service definitions provided manually, imported via spreadsheets, or ingested from enterprise architecture tools like LeanIX automatically become dynamic, multi-tier dependency maps.
| ARCHITECTURAL LAYER | COMPONENTS & DEPENDENCY FLOW |
|---|---|
| Business Service Layer | Global E-Commerce Checkout Storefront |
| Application Tier | Payment Gateway API | Inventory Reservation App |
| Middleware & Database Tier | Redis Cache Cluster | PostgreSQL Database Cluster |
| Infrastructure Layer | AWS EC2 Burst Nodes | On-Prem vSphere Hosts |
These visual service maps display application relationships across web, application, and database tiers. During a major incident, IT teams use impact path tracing to follow the line of failure from a malfunctioning storage volume upward. The trace ends at the affected retail store location or online catalog.
By establishing this clear connection between technical CIs and business services per our guide on understanding service availability in IT operations, retail organizations achieve three major operational advantages:
Rapid Mean Time to Resolution (MTTR): War rooms resolve incidents faster because responders immediately see which infrastructure component supports the failing application tier.
Prioritized Incident Response: Triage teams focus resources on critical checkout and payment channels before addressing non-critical back-office administrative tools.
Audit-Ready Compliance Records: Comprehensive change history logs track every configuration modification, providing clear evidence for security audits and industry compliance standards.
How Virima transforms peak shopping governance: from risk to trusted control
CMDB owners and IT operations managers carry a heavy burden during peak retail seasons. Being the most questioned person in the room during a Black Friday outage is an operational nightmare. When unmapped cloud drift or unrecorded emergency patches break checkout flows, traditional IT tools leave teams searching through disconnected logs while revenue drains away.
Virima eliminates this vulnerability by establishing discovery-sourced runtime truth across your entire retail environment:
- Eliminate CMDB Data Decay: Automated agentless and agent-based discovery scans continuously refresh CI attributes, keeping configuration models accurate across on-premises servers, hybrid clouds, and edge POS networks.
- De-Risk Emergency Freeze Changes: Before approving emergency patches during high-traffic windows, Virima provides automated change risk scoring and blast radius visualization, showing exact downstream application impacts.
- Accelerate Outage Triage: When alerts fire during traffic surges, ViVID™ service maps link technical infrastructure directly to named retail services, allowing incident responders to isolate root cause CIs in seconds.
To eliminate data decay and protect your enterprise from change-induced downtime during critical retail windows, schedule a personalized Virima demonstration to see how discovery-sourced runtime truth transforms peak shopping governance.
Frequently Asked Questions
What is ITOM in retail and e-commerce?
IT Operations Management (ITOM) in retail and e-commerce refers to the tools, processes, and governance strategies used to manage the performance, availability, and configuration of retail IT infrastructure. It encompasses automated asset discovery, CMDB management, change risk analysis, and service dependency mapping across online storefronts, payment systems, WMS, and POS networks.
How does ITOM support omnichannel retail operations?
Omnichannel retail relies on shared data repositories for inventory, customer profiles, and order processing. ITOM maps the complex technical dependencies between physical store POS terminals, mobile apps, e-commerce websites, and central ERP databases, ensuring that a performance bottleneck in one channel does not disrupt customer fulfillment elsewhere.
Why do change freezes fail during peak shopping seasons without ITOM?
Change freezes restrict planned code releases, but emergency fixes, database re-indexing, and security patches still occur during peak periods. Without discovery-sourced ITOM, teams approve emergency changes based on outdated spreadsheets or tribal knowledge, leading to unexpected service disruptions when unmapped microservice dependencies break.
Does Virima integrate with ServiceNow, Jira, Ivanti, and other ITSM platforms for retail change management?
Yes. Virima integrates directly with leading ITSM platforms, including ServiceNow, Jira Service Management, Ivanti, HaloITSM, Xurrent, and Hornbill, feeding discovered CI data, relationship maps, and change risk assessments into existing change and incident workflows.
How does Virima’s ViVID™ service map reduce MTTR during Black Friday outages?
ViVID™ service maps visualize the exact relationships between technical CIs and customer-facing business applications. When an alert fires during a high-volume event like Black Friday, incident teams trace the failure directly to its root-cause CI, eliminating manual triage cycles and shortening MTTR.