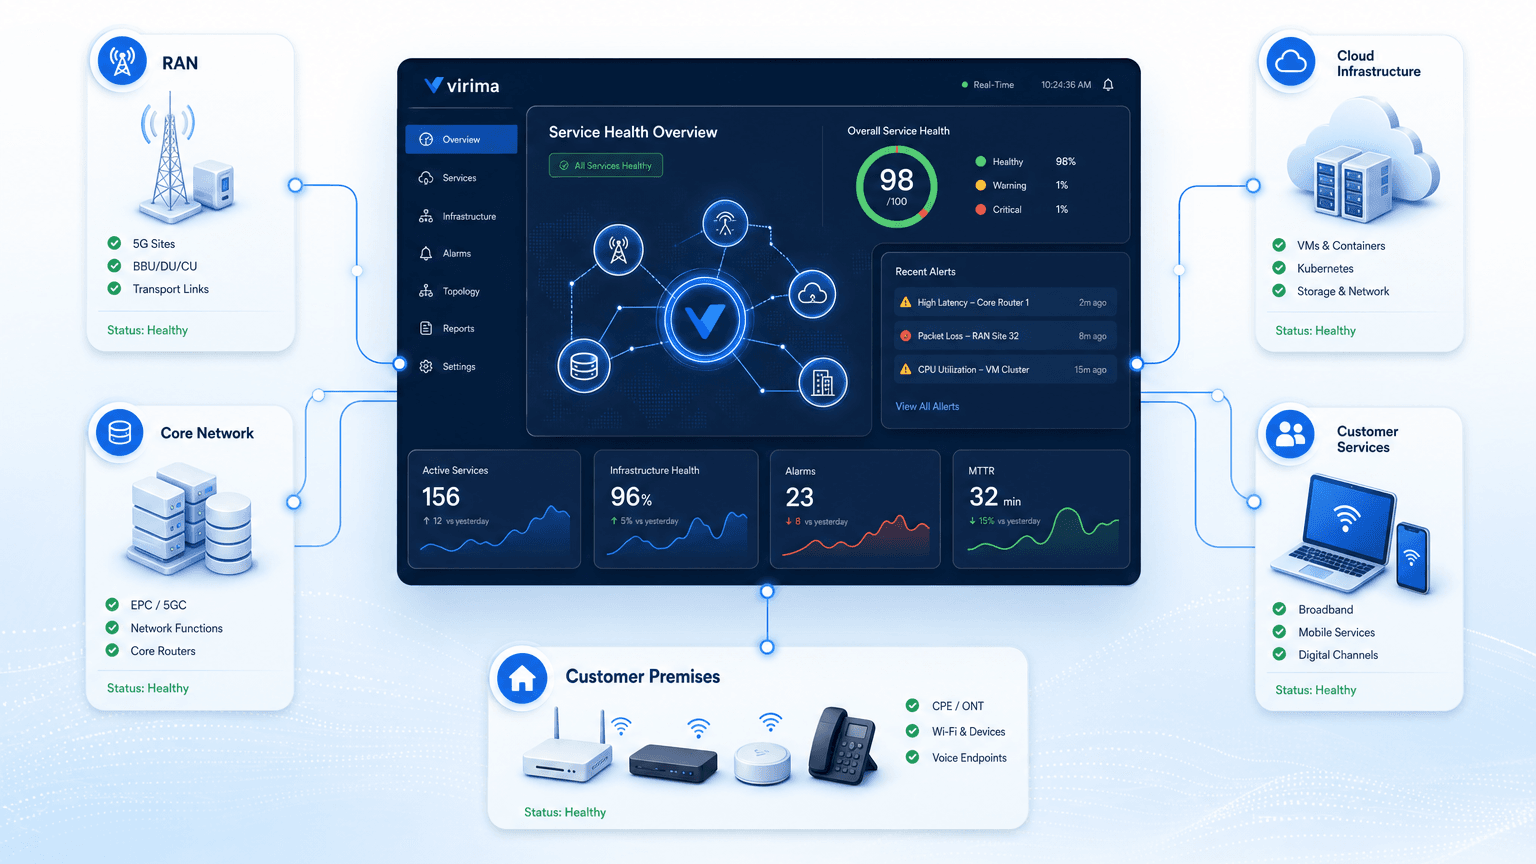
ITOM in Telecommunications: Delivering Real-Time Visibility Into Network and Service Health

A transport path stays inside threshold. Compute nodes stay online. A core function still answers health checks. Customer tickets still climb because the service path crosses domains that each report “green” on their own.
For the configuration or operations lead, that gap is personal. You are the person asked which service is at risk, what changed, and how wide the blast radius runs. Domain monitors answer what looks unhealthy. They rarely answer what the customer is still consuming.
Real-time telecom operations therefore need more than component monitoring. Teams need operational context that shows which services each event can affect across the dependency chain.
Telecom Already Produces Enormous Operational Visibility
Telecom environments already collect alarms, performance counters, telemetry, logs, topology, configuration state, utilization, availability, and service KPIs. The industry problem is rarely a missing probe on a single device.
The harder condition is fragmentation. Signals live in separate tools that were bought for separate domains and separate teams. Each tool can be correct about its slice and still leave end-to-end service health incomplete.
TM Forum’s Globe Telecom case study documents that pattern in production terms. In 2016, Globe had more than ten systems supporting network performance management alone. Report generation could take a week. Identifying and resolving service-issue root causes could take days, with revenue and churn risk attached.
Globe’s later work used cross-domain topology monitoring and automated fault correlation so faults could be tied toward root cause across domains. Routine performance data extraction and analysis time fell by approximately 70 percent on average. Manual effort for routine report generation was eliminated. The lesson for ITOM in telecommunications is direct. Telemetry abundance can coexist with weak operational visibility when context stays siloed.
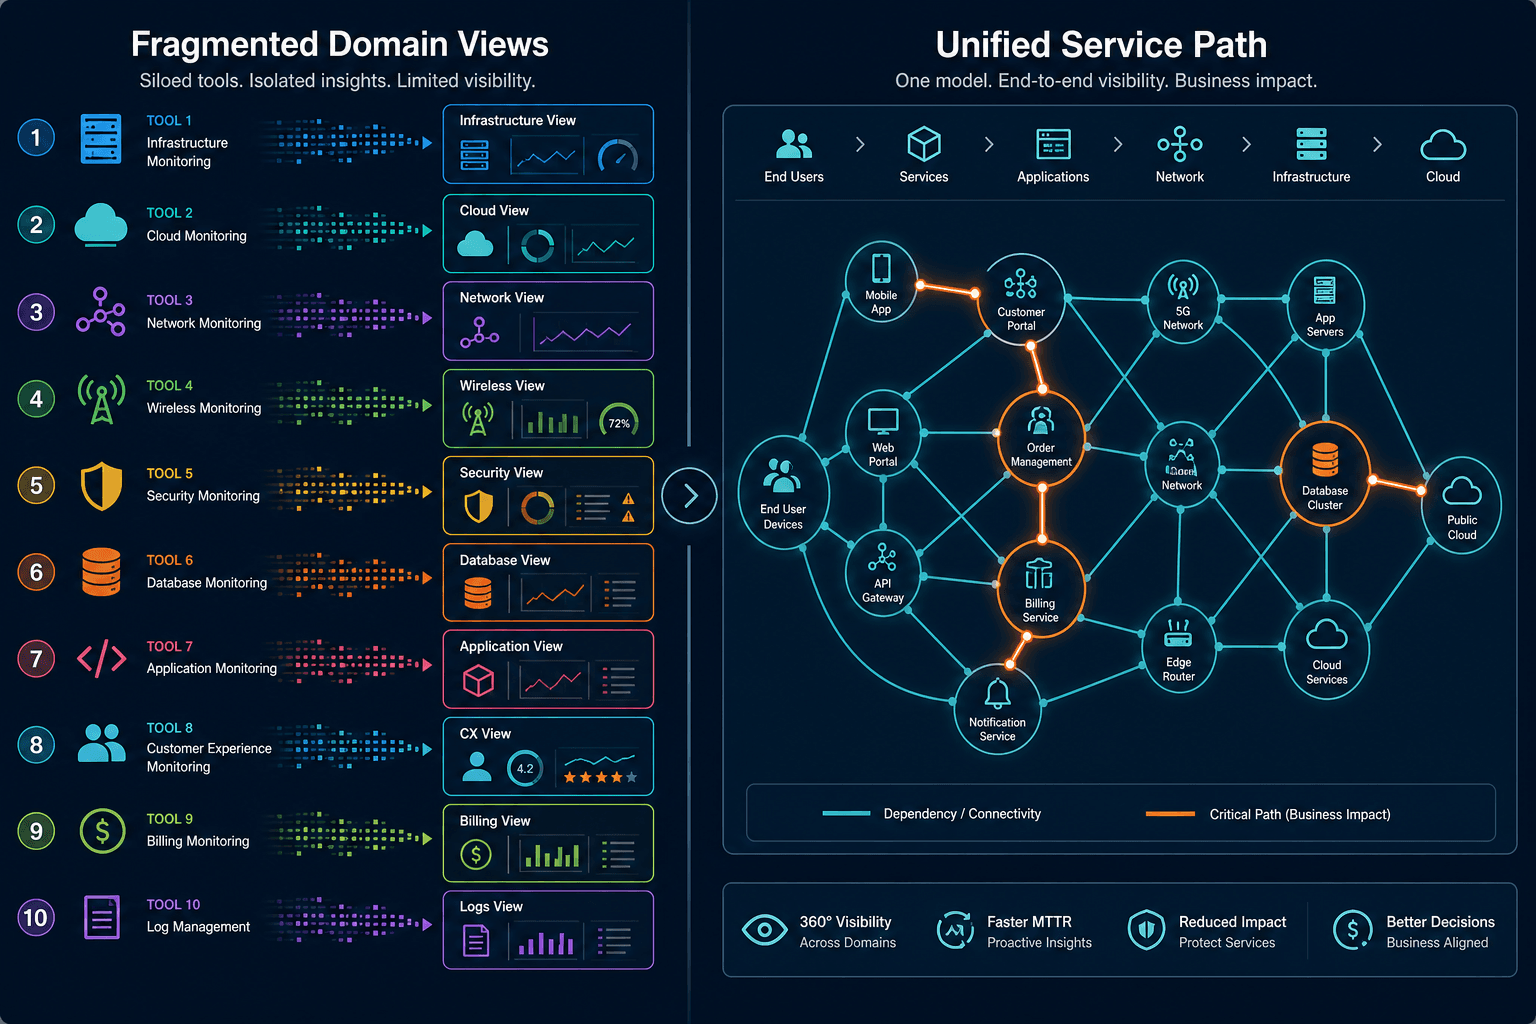
Why can telecom teams have rich monitoring and still lack service visibility?
Because alarms and KPIs often live in separate domain tools. Each tool can be accurate about its slice while end-to-end service health remains incomplete. Visibility improves when topology and dependency context connect those signals to the customer-facing service path.
Network Health and Service Health Are Different Questions
Network assurance and service assurance answer different operational questions. Nokia’s Assurance Center documentation states the split clearly. Network assurance focuses on infrastructure health, performance, and availability. Service assurance focuses on whether services meet SLA, quality, and customer-experience objectives.
A simple chain keeps the difference concrete:
Network resource → network function → application or service component → customer-facing service
A component alarm answers what appears unhealthy. Service context answers what that unhealthy component affects. Both answers matter. They are not interchangeable.
Enterprise ITOM does not replace carrier-grade RAN, transport, or core assurance stacks. Those systems remain the right place for domain telemetry and many network-level correlation jobs. ITOM becomes relevant when IT and service-supporting infrastructure must be joined to incidents, changes, ownership, and business-service impact using a current dependency model.
Modern Telecom Services Cross Multiple Operational Domains
Correlation has grown harder because modern services rarely stop at one technology domain. A single customer-facing offer can span access, RAN, transport, IP, mobile core, cloud infrastructure, edge resources, IT applications, and customer-premises equipment. Each layer can appear acceptable while the combined path still fails the experience the customer pays for.
ETSI’s Zero-touch Network and Service Management (ZSM) framework targets that structure explicitly. Horizontal end-to-end means cross-domain and cross-technology management. Vertical end-to-end means resource layers through customer-oriented layers. ETSI ZSM aims to automate all operational processes, delivery, configuration, assurance, and optimization, across that full span. That architecture assumes operators can reason across domains, not only inside them.
TM Forum’s PRISM-AI Phase II catalyst describes a related multi-domain reality for edge AI and multi-CSP services. Service performance depends on interactions among edge cloud, IP, access, and photonic layers that often still operate in silos. Slow root-cause analysis, higher MTTR, and SLA risk follow when those layers do not share enough operational context.
A telecom service can therefore sit across several independently healthy-looking domains while end-to-end experience remains degraded. Domain green status is not the same proof as service health.
More Alerts Can Make the Problem Worse
Alert volume is not a human-factors story alone. It is a correlation mechanics problem. One underlying failure can fan out as device alarms, interface alerts, application symptoms, service degradations, and customer incidents across separate systems.
Without topology and dependency context, operations teams must infer which events belong together. That manual join is slow under SLA pressure. It is also fragile when ownership and recent change history sit in other tools with no shared reference.
Globe’s TM Forum case shows the opposite pattern when correlation is designed in. Real-time cross-domain topology monitoring supported automated root-cause analysis and remediation orchestration. Mean time to repair for customer-affecting issues fell as more issues were resolved before customer impact. Correlation reduced operational ambiguity. Collection alone increased signal volume.
Real-Time Visibility Requires a Current Dependency Model
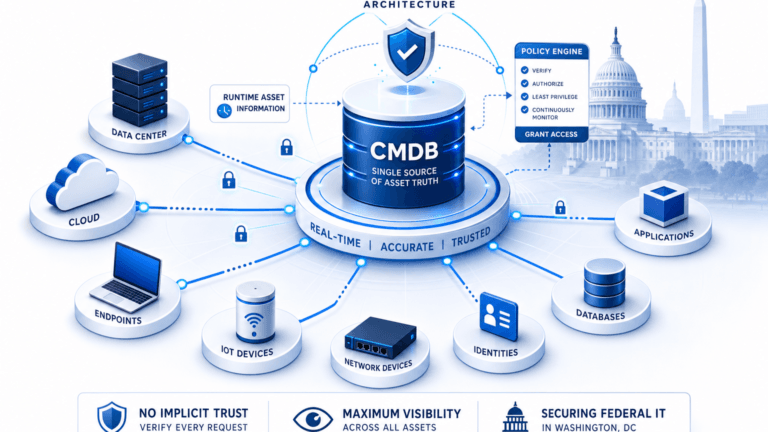
Monitoring tells teams something changed. A current CMDB and service map help explain what the component is, where it belongs, what depends on it, which service it supports, what changed recently, and who owns it.
Service assurance programs already treat inventory and topology as part of the assurance fabric, not as optional reference data. Globe’s cloud-native assurance path included a unified inventory and topology product aligned to TM Forum information models, alongside alarm and performance integrations. Assurance needed operational context, not only more charts.
That is the bridge from telecom monitoring to ITOM practice. ITOM visibility is the discipline of keeping configuration, relationship, ownership, incident, and change context current enough to interpret live signals. Do not expect an enterprise ITOM platform to replace carrier-grade RAN or core KPI collection. Expect it to keep the service-supporting infrastructure graph honest so impact questions have a defensible answer.
Eliminate data decay with Virima’s discovery-sourced Trusted Runtime Truth when you need current relationships, ownership, and service context beside domain monitors.
Real-Time Does Not Mean Every System Needs One Dashboard
Telecom already runs specialized OSS, NMS, controllers, orchestration, and domain assurance tools for good reasons. Forcing one dashboard to replace RAN assurance, transport management, network controllers, and domain telemetry platforms usually fails on depth, scale, and vendor reality.
The stronger model is narrower and more durable. Keep domain-specific monitoring. Create shared operational context around the services and infrastructure those systems describe. Shared context is the join key across tools, not a mandate to collapse every console into one pane.
That boundary keeps ITOM honest. ITOM should reduce the time spent reconstructing “what connects to what” during incidents and changes. It should not claim to be the sole source of radio KPIs or optical performance data.
Service Health Becomes More Useful When Incidents and Changes Share Context
Suppose monitoring raises a service-impacting alert. Useful operational questions follow quickly. Which infrastructure supports the affected service? What changed recently? Is there already an incident against this component? Which other services share the dependency? Who owns the affected CI? What is the probable blast radius?
Those questions sit at the IT operations boundary even when the first symptom arrived from a network domain tool. Telemetry without incident and change context produces another queue item. Telemetry plus dependency, ownership, and change context produces prioritized impact.
This is where ITOM bridges monitoring with CMDB, service mapping, incident, and change practice. The value is faster, safer interpretation of signals that already exist.
Cross-Domain Visibility Is a Prerequisite for Automation
ETSI’s ZSM work aims for automated operational processes across service delivery, configuration, assurance, and optimization. TM Forum autonomous-network and assurance catalysts likewise connect observability to closed-loop detection, correlation, decision, and action patterns across domains.
Automation does not reduce the need for operational context. It increases it. An automated response that cannot identify the service, its dependencies, ownership boundaries, and likely blast radius is not safer operations. It is faster ambiguity.
Closed-loop work therefore inherits the same hidden prerequisite as human triage. Live signals must relate to topology, resources, and service dependencies those signals affect. Without that relation, automation scales noise and risk together.
The August 2026 ETSI ZSM additions include a dedicated work item on “Agent for predictive and cross-domain network assurance,” specifying normative architectural extensions for autonomous agents to enable coordinated cross-domain assurance. That standards direction makes the dependency-context prerequisite explicit at the architectural level.
Why does telecom automation need dependency context before closed-loop action?
Automated remediation (ZSM) must know which service is affected, which resources sit on the dependency path, and what else shares those dependencies. Without a current service map, an automated script can clear a local symptom while widening blast radius across domains the operator still treats as separate.
What Telecom ITOM Visibility Should Connect
| Operational question | Context required |
|---|---|
| What is unhealthy? | Alerts, events, metrics, telemetry |
| Where is it? | Domain, location, resource, CI |
| What changed? | Configuration and change history |
| What depends on it? | Infrastructure and application relationships |
| Which service is affected? | Service mapping and topology |
| Who owns it? | Technical and service ownership |
| How broad is the impact? | Shared dependencies and blast radius |
| What should respond? | Incident, escalation, or approved automation workflow |
This table keeps ITOM distinct from raw monitoring. Monitoring populates the first row well. ITOM earns its place on the remaining rows.
A Practical Visibility Workflow
A practical sequence stays tool-agnostic:
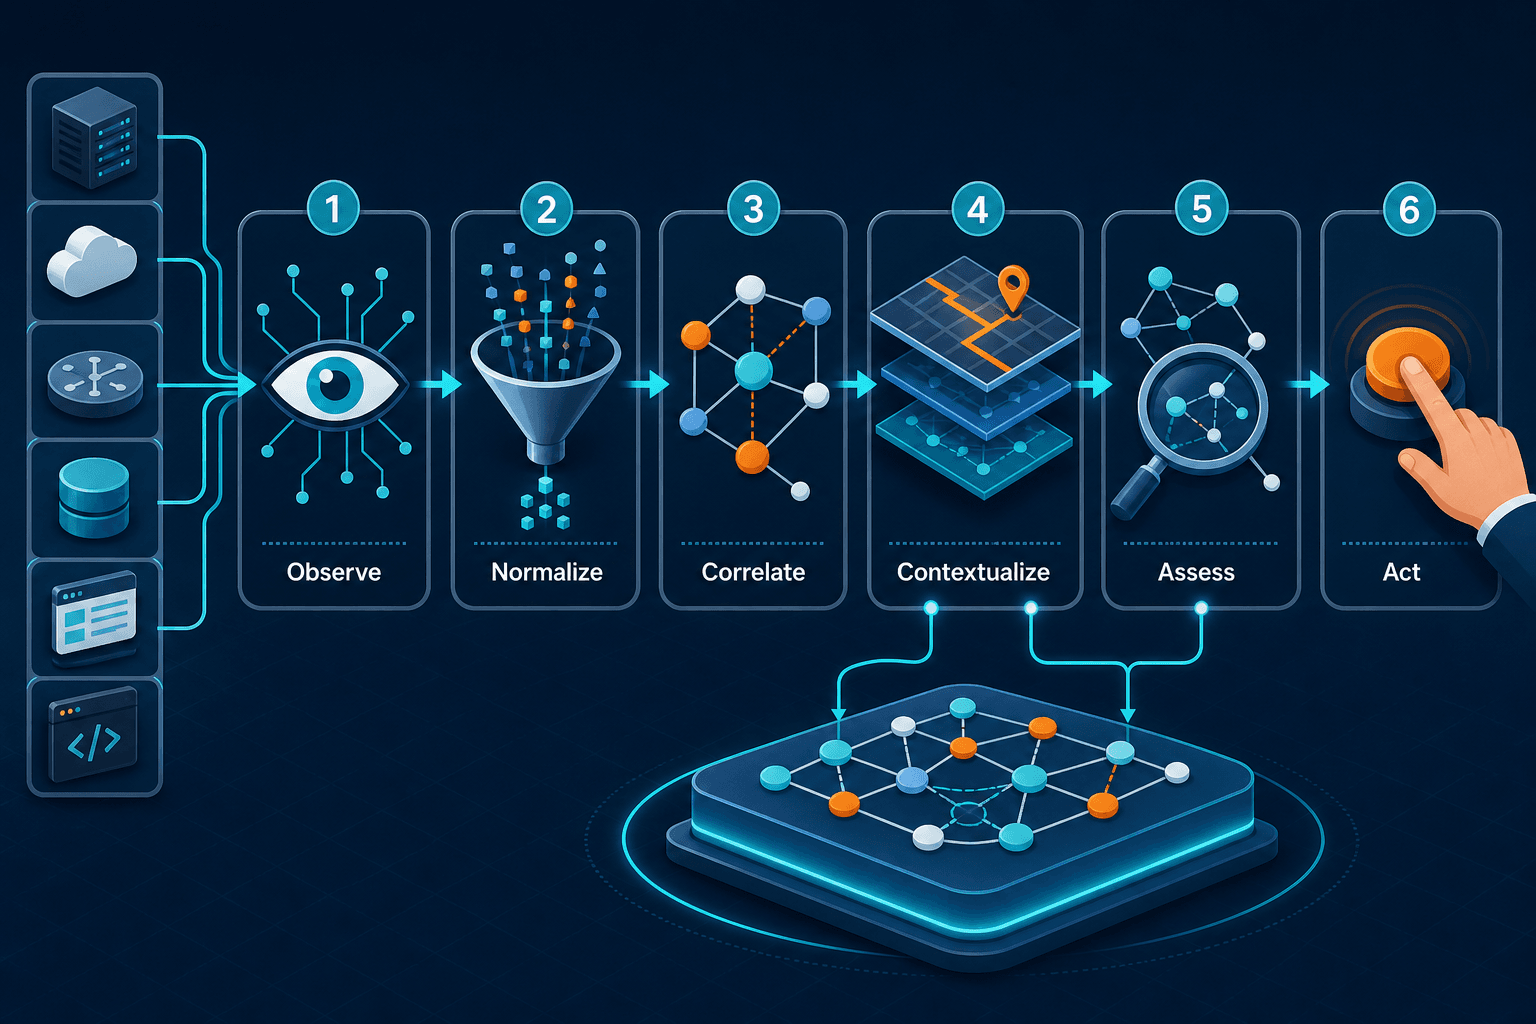
Observe → Normalize → Correlate → Contextualize → Assess → Act
Observe. Collect alerts and operational signals from the systems already running each domain.
Normalize. Bring useful event and CI identifiers into consistent records so the same resource is not five unrelated names across tools.
Correlate. Connect symptoms that may share infrastructure dependencies instead of treating every alarm as a new root cause.
Contextualize. Overlay topology, service maps, ownership, and recent changes on the correlated set.
Assess. Judge probable service impact and operational priority before the war room expands.
Act. Route incidents, investigate root cause, or trigger only approved workflows with known blast radius.
No single enterprise ITOM product performs every network-correlation function natively. The workflow still holds as an operating model. Domain tools observe. Shared context contextualizes. ITSM and runbooks act.
Where Virima Fits in Telecom IT Operations
Virima belongs near the end of this argument as an operational-context layer around existing monitoring, event-management, ITSM, discovery, and infrastructure tools. Virima’s IT operations management positioning is built to integrate with system monitoring and event-management tools rather than replace an entire telecom OSS stack.
Consider the operational moment that defines this problem. A service alert fires during a change window. The war room forms. Every domain tool still shows green for its slice. The question from across the table is: “What else does this affect?” That question needs a current service map, a list of shared dependencies, the last change logged against each of those CIs, and the name of the owner who can authorize the next action. Without a continuously updated dependency model, the answer is reconstruction from memory under SLA pressure. That is the gap Virima closes for the IT and service-supporting infrastructure layer, not by absorbing carrier telemetry, but by keeping the relationship, ownership, and change record current enough to answer the blast-radius question before it turns into a multi-hour incident.
Relevant Virima capabilities for the telecom IT and service-supporting estate include discovery-sourced CMDB population, infrastructure and application dependency mapping, ViVID service maps once service definitions are provided, event-management integrations, incident overlays, recent-change overlays, configuration history, ownership context, and impact-oriented root-cause support. Those maps can show active incidents, recent and pending changes, vulnerabilities, and service dependencies in one operational view when the service model is defined.
Boundary statement. Virima does not replace carrier-grade RAN, transport, core, or service-assurance platforms. Those systems remain responsible for collecting and analyzing domain-specific network telemetry. Virima can add shared configuration and dependency context around the enterprise and service-supporting infrastructure those systems monitor, and feed that context into existing ITSM and integration paths such as ServiceNow, Jira Service Management, Ivanti, HaloITSM, Xurrent, and Hornbill.
Telecom operators already have tools telling them when components become unhealthy. The harder task is connecting those signals to current infrastructure relationships, service dependencies, incidents, and recent changes. Virima provides that discovery-sourced operational context so teams can understand impact faster without replacing the monitoring and assurance systems already running each network domain.
Building Service-Aware ITOM Without Discarding Domain Assurance
ITOM in telecommunications succeeds when teams stop treating “more real-time dashboards” as the whole answer. The governing condition is simpler and harder. Operators need shared context that shows how signals from different network domains combine to affect one end-to-end service.
Start with the distinction between network health and service health. Keep specialized assurance tools where they earn depth. Invest in a current dependency model for the infrastructure and applications that carry customer-facing services. Join incidents and changes to that model before automation expands. Use an operational-context layer beside domain monitors, not instead of them.
That path does not invent a new monitoring category. It makes the monitoring you already paid for answer the service questions your customers already ask.
Request a demo to map how discovery-sourced CMDB and service context sit beside your current assurance stack.
Frequently Asked Questions
Why do customer services degrade when every domain monitor looks healthy?
End-to-end services cross access, transport, core, cloud, edge, and IT layers that report status separately. Each domain can meet local thresholds while the combined dependency path still fails the experience the customer consumes. Service health requires cross-domain correlation and dependency context, not only green domain KPIs.
What is the difference between network assurance and service assurance?
Network assurance focuses on infrastructure health, performance, and availability. Service assurance focuses on whether services meet SLA, quality, and customer-experience objectives. A resource alarm answers what looks broken. Service context answers which customer-facing offer that break affects and how wide the impact runs.
Does more telemetry automatically improve telecom service visibility?
No. Additional probes raise signal volume without improving clarity. Visibility improves when topology, inventory, ownership, and service dependencies connect those signals so teams can correlate symptoms to root cause and impact. Without that join, more alerts often increase noise rather than shorten resolution time.
Where does Virima fit beside carrier OSS and assurance tools?
Virima acts as a discovery-sourced operational context layer for CMDB relationships, service maps, incidents, changes, and ownership around service-supporting infrastructure. It integrates with monitoring and event tools and connects to ITSM platforms. It does not replace RAN, transport, core, or carrier service-assurance telemetry platforms.
Why is dependency context required before closed-loop automation?
ETSI’s Zero-touch Network and Service Management framework targets automated operations across domains and layers, and its 2026 work explicitly requires agents to coordinate cross-domain assurance. Without a current dependency map showing the affected service, shared resources, and blast radius, automated actions can resolve local symptoms while widening impact across connected domains.