45 IT Asset Management Statistics for 2026
IT asset management (ITAM) is the process of tracking, managing, and optimizing every hardware, software, and cloud asset across an organization’s IT environment. Most ITAM failures share a root cause: organizations are managing what they believe they own, not what actually exists. Software licenses stack up in procurement systems while half go unused in production. Hardware gets decommissioned off the books but keeps drawing power. Cloud resources spin up on demand and never spin down. Shadow IT runs at a scale most IT teams never see.
The IT asset management statistics below put numbers to that gap — across software licensing, hardware, shadow IT, cloud spend, and security — and show what organizations recover when they close it.
1. How Large Is the IT Asset Management Market?
Enterprise investment in ITAM is accelerating. That growth reflects how expensive undiscovered assets have become, and how visible that cost now is to finance and procurement leadership.
Stat 1. The IT asset management software market is valued at $2.22 billion in 2026 and is projected to reach $3.01 billion by 2031, at a CAGR of 6.28%. (Mordor Intelligence ITAM Market Report)
Stat 2. A separate market analysis puts ITAM software at $1.81 billion in 2024, expanding to $2.9 billion by 2032 at a 6.2% CAGR. (SNS Insider ITAM Market Report)
Stat 3. The hardware asset management market was valued at $30 billion in 2024 and is projected to reach $72.58 billion by 2032, growing at an 11.7% CAGR — nearly double the rate of ITAM software. (Credence Research, Hardware Asset Management Market)
Stat 4. Global IT spending is forecast to reach $6.15 trillion in 2026, up 10.8% from 2025. (Gartner, February 2026)
Stat 5. Software is forecast to be the fastest-growing IT spending category in 2026, with Gartner projecting 15.2% year-over-year growth. (Zylo 2026 SaaS Management Index, citing Gartner)
Stat 6. The average enterprise now spends $55.7 million annually on SaaS alone — a figure that grew 8% year over year despite application counts staying flat. (Zylo 2026 SaaS Management Index)
Scale matters here. Larger IT spend means larger exposure when visibility gaps exist. IT asset management programs built on discovery-sourced asset data give finance and IT operations a defensible baseline — not a spreadsheet approximation. For CFOs and procurement directors, these numbers also frame the audit risk and budget recovery opportunity that comes from getting asset data right.
The IT asset management software market is valued at $2.22 billion in 2026 and is projected to grow to $3.01 billion by 2031 at a CAGR of 6.28%, according to Mordor Intelligence. A separate SNS Insider analysis puts the ITAM software market at $2.9 billion by 2032. The hardware asset management market is growing faster — from $30 billion in 2024 to a projected $72.58 billion by 2032 at 11.7% CAGR.
2. Software License Waste Statistics: What Enterprises Overspend
Software is where ITAM waste is most measurable. The data from Flexera and Zylo puts the cost into numbers that finance teams cannot ignore.
Stat 7. Only 43% of enterprises report having complete visibility into their technology estate — down from 47% the prior year. Visibility is declining while IT complexity is growing. (Flexera 2025 State of ITAM Report)
Stat 8. Enterprises waste up to 30% of IT budgets on underutilized or redundant software licenses. With global software spending projected at $1.43 trillion in 2026, that waste runs to hundreds of billions. (Flexera 2025 State of ITAM Report)
Stat 9. 35% of respondents say SaaS waste increased over the past year — even as more teams actively track usage. (Flexera 2025 State of ITAM Report)
Stat 10. Managing software use rights is now the #1 concern for SAM teams — up from sixth place just a year earlier. The shift is driven primarily by cloud-based licensing complexity. (Flexera 2025 State of ITAM Report)
Stat 11. 45% of organizations spent more than $1 million on software audits over the past three years. (Flexera 2025 State of ITAM Report)
Stat 12. 23% of organizations spent more than $5 million on software audits in 2025 alone. (Flexera 2025 State of ITAM Report)
Stat 13. Microsoft audited 50% of surveyed organizations in the past three years, making it the most frequent enterprise software auditor on record. (Flexera 2025 State of ITAM Report)
Stat 14. IBM audited 37% and SAP audited 32% of surveyed organizations over the same period. Adobe audited 24%, ServiceNow 21%, and Salesforce 20%. (Flexera 2025 State of ITAM Report)
Stat 15. The average company manages 305 SaaS applications — each a potential license waste category or compliance gap. (Zylo 2026 SaaS Management Index)
Stat 16. 79% of IT leaders encountered price increases at SaaS renewal in the past 12 months. (Zylo 2026 SaaS Management Index)
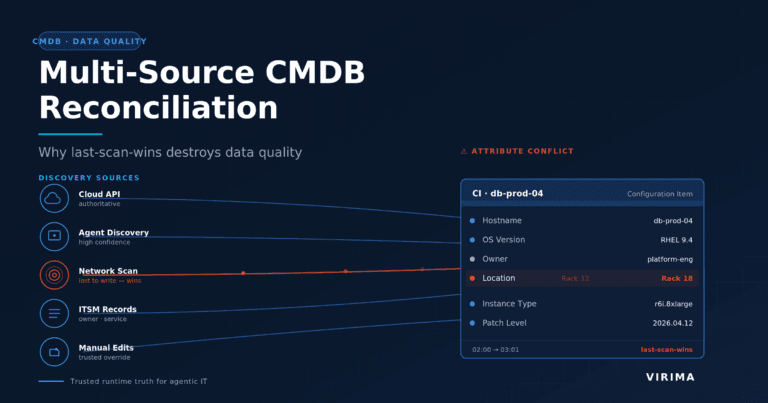
See how Virima builds IT asset management on discovery-sourced trusted runtime truth — so your license baseline reflects what is actually deployed, not what was last audited.
How much do enterprises waste on unused software licenses?
Enterprises waste up to 30% of IT budgets on underutilized or redundant software licenses, according to the Flexera 2025 State of ITAM Report. With global software spending projected at $1.43 trillion in 2026, that waste is measured in hundreds of billions. For individual organizations, average SaaS license waste sits at approximately $19.8 million per year even after utilization tracking improved year over year.
3. Shadow IT Statistics: The Hidden Asset Inventory
Shadow IT is an asset management problem before it is a governance problem. Every application deployed outside IT’s view is an asset without a lifecycle, a cost owner, or a security record.
Stat 17. Gartner research, cited repeatedly across industry reports since 2017, puts shadow IT at 30 to 40% of IT spending in large enterprises — a benchmark that has held steady as newer studies continue to confirm the range. (CIO.com, citing Gartner research)
Stat 18. Everest Group research puts shadow IT at 50% or more of IT spending at many organizations — suggesting that Gartner’s figure understates the problem. (Everest Group)
Stat 19. SaaS applications running on corporate networks average 3 times the number IT departments officially track. (Everest Group, via CIO.com)
Stat 20. When organizations deploy dedicated SaaS management, they discover 3 times more SaaS spend than they were previously tracking. (Zylo)
Stat 21. 61% of organizations cut projects or initiatives due to unplanned SaaS cost increases. (Zylo 2026 SaaS Management Index)
Stat 22. 77% of IT leaders experienced unexpected costs that surfaced only after a SaaS contract was signed. (Zylo 2026 SaaS Management Index)
What percentage of IT assets are typically unmanaged or shadow IT?
Between 30% and 50% of enterprise IT spending goes to shadow IT, depending on the organization. Gartner research cites 30-40% for large enterprises; Everest Group puts the figure at 50% or more. SaaS apps discovered on corporate networks typically run 3x the number IT officially tracks, meaning the visible inventory represents only a portion of what is actually running.
4. Hardware Asset Management Statistics: What Goes Untracked
Software sprawl draws the headlines, but hardware visibility gaps carry their own category of financial and security risk. Ghost hardware, zombie servers, and undiscovered endpoints drive ongoing costs that never appear in the budget.
Stat 23. Ghost assets — hardware reported in financial records that no longer physically exists — account for an estimated 12 to 25% of fixed assets in most organizations. (Re-Source Partners, citing industry ITAM audit data)
Stat 24. Industry estimates put zombie servers (powered on but performing no useful function) at up to 30% of total servers in enterprise data centers — consuming power, space, and support costs without producing output. (Nlyte Software, citing industry data)
The License and Cost Dimension of Hardware Sprawl
Stat 25. Despite year-over-year improvements in usage tracking, average license waste per organization still sits at $19.8 million annually as of 2025. (Zylo 2026 SaaS Management Index)
Stat 26. License utilization improved from 47% in 2024 to 54% in 2025 — a meaningful gain, but still: nearly half of all purchased licenses went unused. (Zylo 2026 SaaS Management Index)
Stat 27. 78% of IT leaders report unexpected charges tied to consumption-based pricing or AI-feature billing in the past year — a new asset cost category that most ITAM programs have not yet built governance around. (Zylo 2026 SaaS Management Index)
IT discovery removes hardware blind spots — scanning across network-connected, cloud-hosted, and remote devices to produce an inventory your CMDB can trust. For a direct comparison of discovery-based ITAM against simpler scanning approaches, see our Lansweeper comparison.
5. Cloud Asset Sprawl and FinOps
Cloud assets are the fastest-growing category of undiscovered spend. Provisioned in seconds and forgotten in days, cloud resources become a cost problem the moment they leave IT’s field of view.
Stat 28. Organizations waste an average of 27% of their cloud spend. This figure has held between 27% and 32% every year since 2019, appearing consistently across Flexera’s State of the Cloud, Harness’s Cloud Cost Management Report, and Datadog’s State of Cloud Costs. (Spendark, synthesizing Flexera, Harness, Datadog data — March 2026)
Stat 29. Cloud infrastructure spending crossed $675 billion globally in 2025. (Gartner, via Spendark 2026)
Stat 30. At 27% waste on $675 billion in total cloud spend, the industry lost roughly $182 billion to unused or idle cloud resources in 2025. [Derived calculation from Stats 28 and 29 — not a directly reported figure.] (Sources: Gartner cloud spend x Flexera waste rate)
Stat 31. 84% of organizations struggle to manage their cloud spend. (Flexera 2025 State of the Cloud Report)
Stat 32. Spending on AI-native SaaS applications increased 108% year over year — creating a new asset category that most ITAM programs are not yet equipped to track or govern. (Zylo 2026 SaaS Management Index)
Stat 33. 59% of SAM teams are now actively tracking SaaS usage, and 56% are rightsizing contracts and subscriptions to eliminate unnecessary spend. (Flexera 2025 State of ITAM Report)
Stat 34. ITAM-FinOps collaboration has grown to 38% of organizations — up year over year — as teams recognize that cloud cost control requires shared asset visibility. (Flexera 2025 State of ITAM Report)
Stat 35. ITAM-cloud team collaboration now stands at 44%, a sign that cloud cost ownership is moving out of IT silos and into shared cross-functional teams. (Flexera 2025 State of ITAM Report)
6. The Security Exposure of Untracked Assets
Every undiscovered asset is an unpatched asset. Every application outside IT’s view is an unmonitored attack surface. The security case for ITAM no longer needs to be argued — the breach data makes it.
Stat 36. 74% of cybersecurity incidents occur because of unknown or ungoverned assets — making asset visibility a primary security control, not a compliance checkbox. (Trend Micro, April 2025 — survey of 2,250 cybersecurity leaders)
Stat 37. Endpoints outside standard management — personal devices, contractor hardware, and third-party equipment — operate entirely outside patch management and incident response coverage. These entry points go undetected by standard controls. (CyberArk)
The financial impact is measurable: IBM’s 2025 Cost of a Data Breach Report found that organizations with high levels of shadow AI saw breach costs increase by $670,000 above the $4.44 million global average — while 63% of organizations studied lacked AI governance policies entirely. (IBM 2025 Cost of a Data Breach Report)
Stat 38. Complete IT visibility has declined 4 percentage points year over year — from 47% to 43% — meaning more assets are in the dark precisely when AI-driven operations are raising the stakes for data accuracy. (Flexera 2025 State of ITAM Report)
Stat 39. ServiceNow audited 21% of surveyed organizations in the past three years — with audit exposure growing as ServiceNow expands into AI tooling and new licensing structures. (Flexera 2025 State of ITAM Report)
Stat 40. Large enterprises with more than 10,000 employees spend between $123.5 million and $375.5 million annually on SaaS — making any visibility gap financially significant at an order of magnitude larger than mid-market organizations. (Zylo 2026 SaaS Management Index)
Accurate asset data, sourced from active IT discovery, gives security teams the intelligence to assess blast radius before incidents happen — not after. For organizations building a CMDB that feeds security workflows, discovery-sourced data is the difference between a real-time asset registry and a stale spreadsheet.
If these ITAM statistics describe your environment, the next step is seeing what is actually running in it. Explore how Virima IT discovery works — or schedule a 30-minute demo to see it against your environment.
7. ITAM ROI: What Better Visibility Actually Returns
ITAM’s financial case sits in three places: license recovery, audit avoidance, and the operational efficiency gains from having accurate data in the tools your teams already use.
Stat 41. Organizations using dedicated SaaS management achieve an average of 17% savings during software renewals. (Zylo 2026 SaaS Management Index)
Stat 42. Average license waste per organization declined 5.3% year over year — from $20.9 million to $19.8 million — as utilization tracking improved. (Zylo 2026 SaaS Management Index)
Stat 43. SaaS renewals account for 87% of total software spend across organizations — making renewal discipline one of the highest-impact activities in any ITAM program. (Zylo 2026 SaaS Management Index)
Stat 44. The average organization manages 211 SaaS renewals annually — each one a potential recovery opportunity if utilization data is available at negotiation time. (Zylo 2026 SaaS Management Index)
Stat 45. ITAM teams that collaborate with both FinOps and cloud teams — now 44% of organizations — show measurable improvements in cost control, driven by a shared view of asset deployment and consumption data. (Flexera 2025 State of ITAM Report)
What is the ROI of IT asset management?”
ITAM ROI appears in three areas: license recovery (average 17% savings on renewals per Zylo 2026), audit avoidance (45% of enterprises spent over $1 million on audits in three years per Flexera 2025), and cloud waste reduction (ITAM-FinOps collaboration drives measurable cost control in 38% of organizations). Organizations running active utilization programs cut license waste 5.3% year over year, converting visibility into direct budget recovery.
What These Statistics Have in Common
Every number in this list — from ghost hardware to cloud waste to software audit exposure — traces back to the same problem: organizations are managing what they believe they have, not what actually exists.
Shadow IT persists because IT does not know what was deployed. License waste stays high because usage data does not reach procurement before renewals. Audits hit hard because entitlement records do not reflect current deployments. Cloud costs compound because provisioned resources are never matched against consumption data.
IT asset management built on discovery-sourced data closes that gap. When asset inventory comes from active IT discovery — not manual entry, periodic scans, or fragmented procurement records — the picture is accurate enough to act on. That accuracy feeds the CMDB, ViVID service maps, and every downstream process that depends on knowing what exists.
If you are building the business case for ITAM investment, see how Virima’s IT discovery builds a defensible asset baseline. Ready to see it in your environment? Schedule a demo.
What is the average cost of unmanaged IT assets in an enterprise?”
Untracked IT assets create costs across multiple categories. Software waste from unused licenses averages $19.8 million per year per organization (Zylo 2026). Enterprise software audits cost over $1 million in a three-year window for 45% of organizations, and over $5 million for 23% (Flexera 2025). Cloud waste accounts for roughly 27% of total cloud spend — approximately $182 billion globally in 2025. Ghost hardware assets carrying active depreciation charges represent an estimated 12-25% of fixed asset records.
Frequently Asked Questions About ITAM Statistics
What is the average cost of unmanaged IT assets in an enterprise?
Undiscovered assets drive costs across software, hardware, and cloud simultaneously. Software license waste averages $19.8 million annually per organization (Zylo 2026). Software audit costs exceeded $1 million in three years for 45% of enterprises, and surpassed $5 million for 23% (Flexera 2025). Cloud waste accounts for approximately 27% of total cloud spend — roughly $182 billion lost globally in 2025. Ghost hardware assets carrying active depreciation charges represent an estimated 12-25% of fixed asset records in most organizations.
How much do organizations overspend on software licenses due to poor ITAM?
Flexera’s 2025 State of ITAM Report attributes up to 30% of IT budgets to underutilized or redundant software. With global software spending projected at $1.43 trillion in 2026, that waste runs to hundreds of billions across the industry. Per organization, average SaaS license waste sits at $19.8 million annually even after utilization tracking improved year over year. Active renewal management programs recover an average of 17% in savings at each renewal cycle (Zylo 2026).
Why is shadow IT still a major problem despite ITAM programs?
Shadow IT persists because most ITAM programs build inventory from procurement records rather than from discovery of what is actually deployed. Applications purchased by business units directly never appear in procurement logs. Gartner puts shadow IT at 30-40% of enterprise IT spend; Everest Group puts it higher. The only reliable way to catch shadow assets is to discover them from the network and application layer — not to rely on self-reporting or finance records.
How does Virima help organizations discover and track all IT assets?
Virima’s IT discovery engine scans network-connected, cloud-hosted, and remote assets to build an inventory from actual deployment data, not procurement assumptions. That discovery-sourced data feeds the CMDB, IT asset management module, and ViVID service maps — giving every team a shared view of what exists, what it connects to, and what it costs. Virima also integrates directly with ServiceNow and Jira to push accurate asset data into the tools your teams already use. Schedule a demo.
What makes discovery-sourced ITAM more accurate than manual auditing?
Manual audits capture a point-in-time snapshot that degrades immediately. Assets are deployed, decommissioned, and reconfigured between audit cycles. Discovery-sourced ITAM queries the environment directly and at high frequency, capturing changes as they happen. The accuracy gap is measurable: Flexera found that only 43% of enterprises have complete visibility at any given time — and that figure has declined year over year. Organizations that move from audit-based to discovery-based asset management recover license waste, reduce audit exposure, and give security teams a current picture of their attack surface.