The Cost of Unmanaged IT Assets for a Small Business Comes Due at Change Time

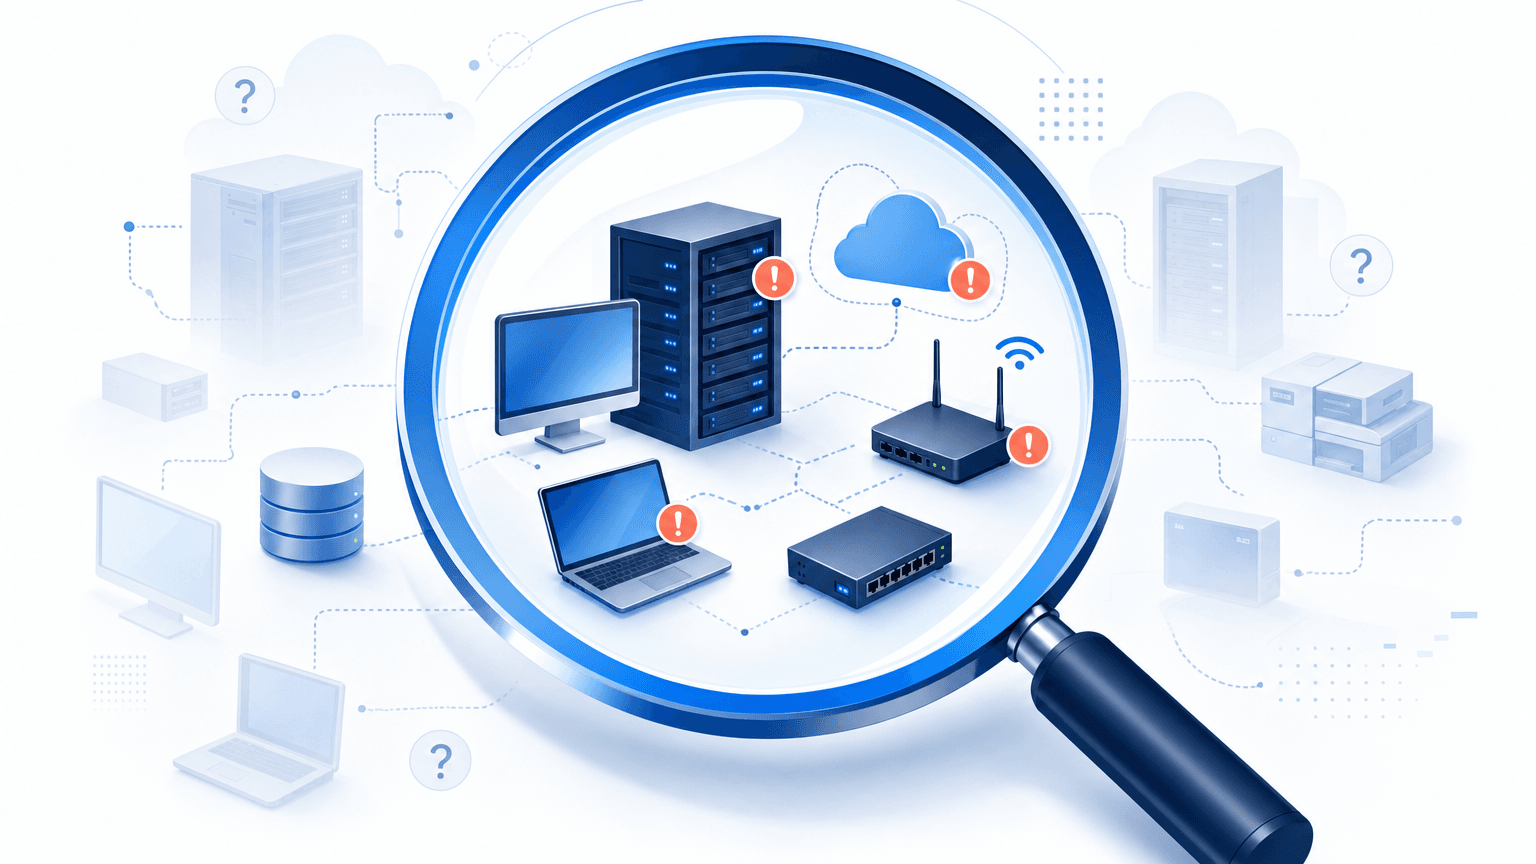
A small IT team has a change window on the calendar: a patch and a configuration change on a production server. The night before, someone runs a discovery scan, and it lists devices nobody wrote down. None of those devices have cost anything that shows on an invoice yet. The bill arrives when the window opens, when the list is incomplete, and when the team spends the scarce hours reconciling what should already have been known.
Every dollar and hour figure below traces to a named primary source. Where no credible small-business number exists, the page states that limit and shows the formula you can run with your own multipliers.
What Counts as Unmanaged, and Why a Change Window Exposes It
An unmanaged IT asset is a device, cloud resource, or software install that is missing from your inventory, or that sits outside your management tooling. CIS Control 1 treats the first kind as unauthorized assets and calls for a process to address unauthorized assets weekly. That weekly cadence is the baseline for keeping the register honest between change windows.
A change window is scarce time. It can only remediate what appears on the work list. The Verizon 2026 Data Breach Investigations Report found that exploitation of vulnerabilities is now the most common initial access vector at 31 percent of breaches. Only 26 percent of critical CISA Known Exploited Vulnerabilities were fully remediated in the study period, and median full resolution took 43 days. Those figures describe known assets in vulnerability-management data. A device that never enters the register never enters the queue. Inferring that unmanaged devices fare no better is reasonable; label that step as an inference until you have local rates.
The next section gives five sourced numbers for frequency and scale, and states what each number cannot tell a small team about its own probability.
Five Sourced Numbers and What Each One Can’t Tell You
Use this table as a ledger of published anchors. Each row names the source, the measurement, and the limit of that measurement.
| Number | Source and year | What it measures | What it does not |
|---|---|---|---|
| 74% of cybersecurity leaders reported incidents tied to unknown or unmanaged assets | Trend Micro, April 2025, global study of over 2,000 cybersecurity leaders | Leaders’ reports of incidents with an unmanaged-asset cause | A breach probability for your firm |
| Over 90% of attacks that reached the ransom stage used unmanaged devices for initial access or remote encryption | Microsoft Digital Defense Report 2024 insights | Attacks Microsoft observed that progressed to ransom | How often an attack reaches that stage in your environment |
| 31% of breaches begin with vulnerability exploitation; 26% of KEV vulnerabilities fully remediated; median 43 days to full resolution | Verizon 2026 Data Breach Investigations Report | Breach and vulnerability datasets from many contributors | Small-business-specific rates in isolation |
| $4.99 million global average cost of a data breach (record, up 12%) | IBM Cost of a Data Breach Report 2026 | Average across breached organizations in the study | A small-business forecast; treat as a ceiling |
| 48% audited in the past year; 44% spent more than $1 million on audits over three years | Flexera 2026 State of ITAM Report, 512 ITAM professionals | Software audit experience among ITAM respondents | A small firm’s audit bill; the sample skews larger |
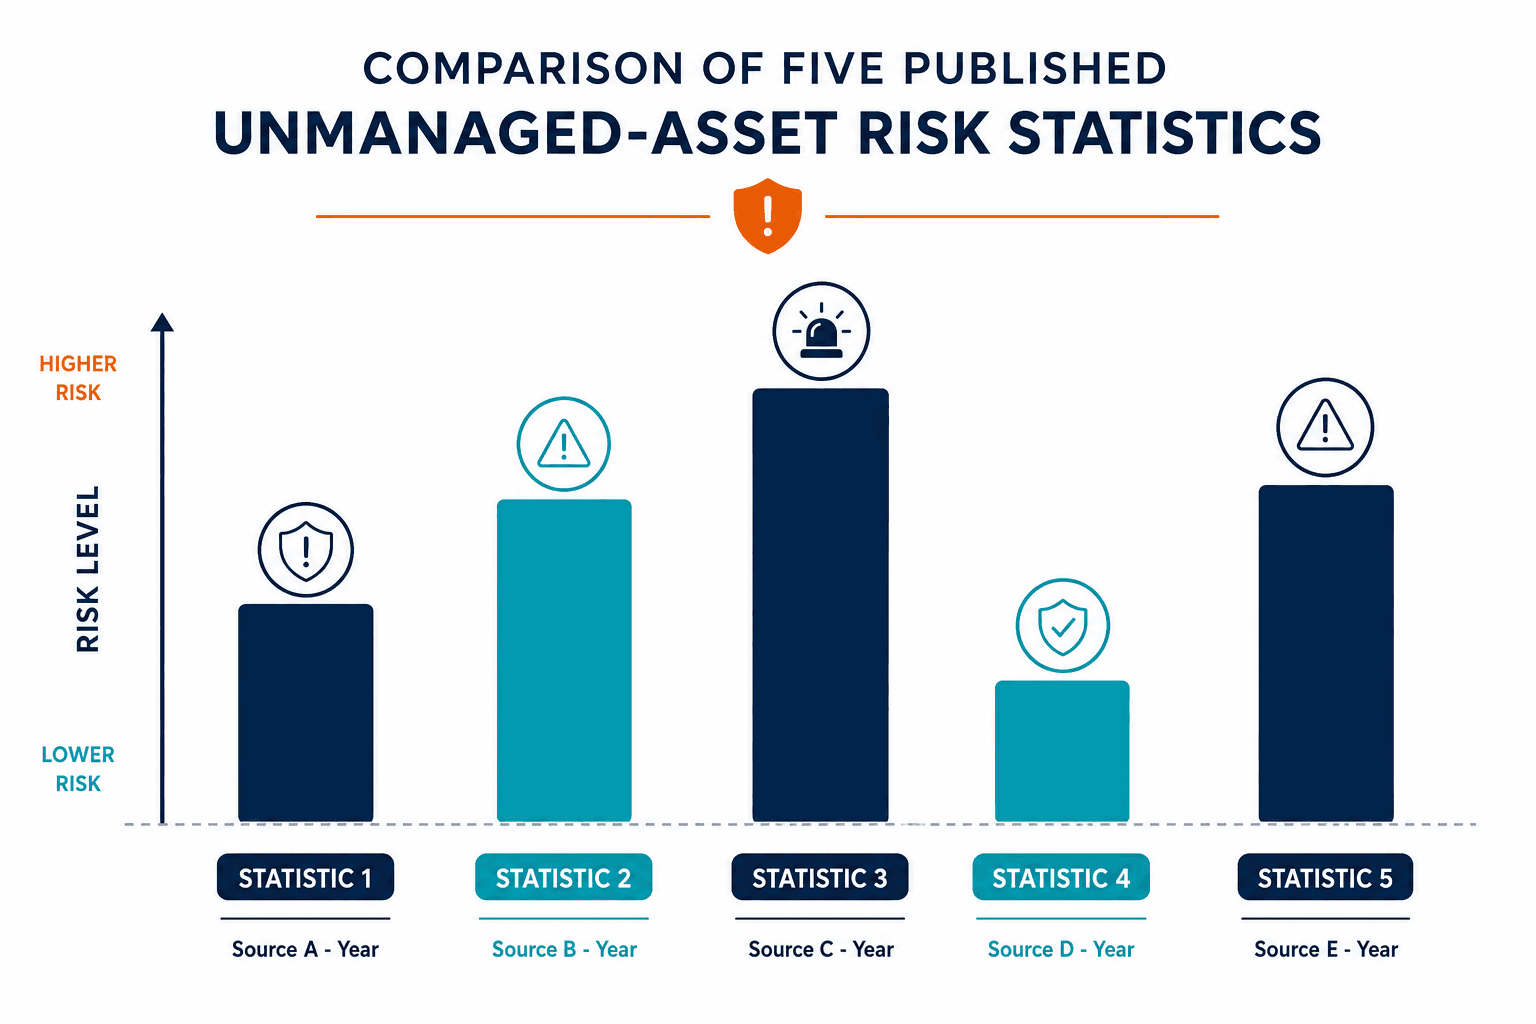
These five numbers answer how often and how large the problem looks across large samples. None of them supplies your own probability, hours, or revenue per hour. That is why the next section builds a worked ledger from unit costs and multipliers you control.
Microsoft’s 2024 Digital Defense Report insights also note that ransomware has heavily affected small and medium-sized organizations in prior reporting cycles. Use that as context for why unmanaged devices matter outside the largest enterprises. Keep your own headcount threshold out of the math until you have local data.
The Worked Example: One Change Window, Four Cost Lines
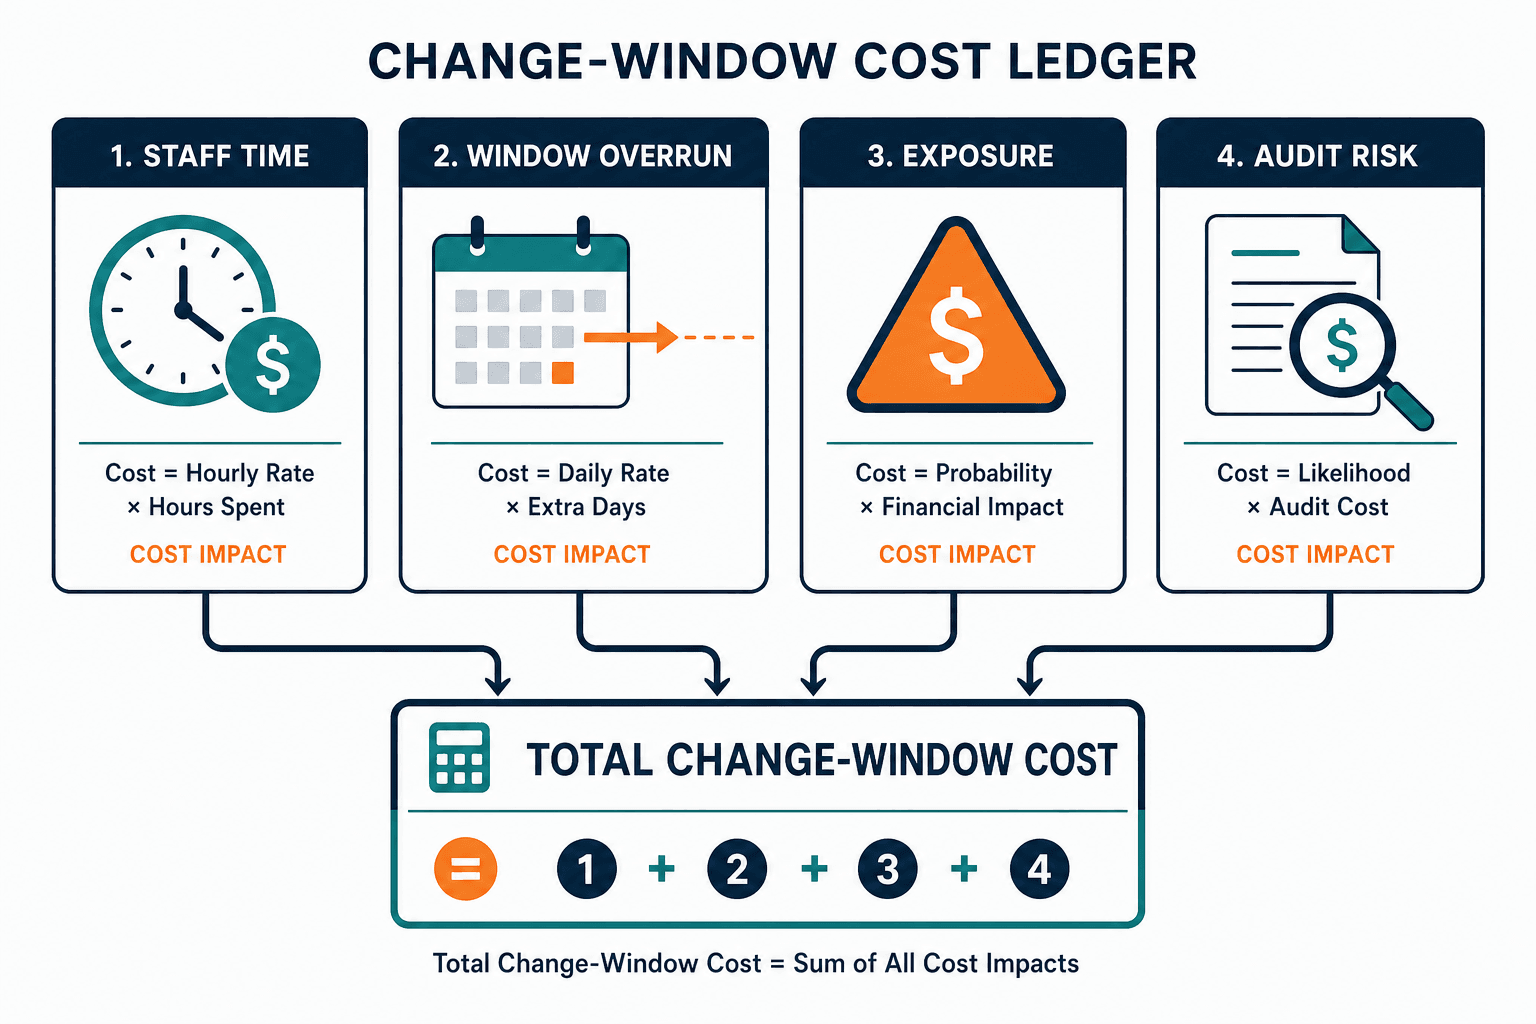
Return to the same change window and the same unmanaged devices. Each of the four cost lines carries a sourced unit cost where one exists, a multiplier you supply, and a formula you can recompute before the next window.
Line 1: Staff time reconciling by hand before the window
Unit cost: $47.66 per hour, the U.S. Bureau of Labor Statistics median hourly wage for network and computer systems administrators (May 2025 median annual pay $99,130). That BLS median covers wages alone and excludes benefits, overtime premiums, contractor markups, and opportunity cost of delayed project work, so it understates fully loaded cost on purpose.
Multiplier: hours your team spent on hand reconciliation across the last two change windows (H).
Staff-time cost equals H × $47.66 for those logged hours.
Line 2: The window that overruns
Unit cost: your revenue or contribution margin per operating hour. There is no credible published small-business downtime figure that is safe to borrow as a universal rate. The ITIC 2024 Hourly Cost of Downtime Report found that hourly downtime exceeds $300,000 for over 90 percent of mid-size and large enterprises, based on a survey of over 1,000 firms from November 2023 through mid-March 2024. That population is the one ITIC describes. Treat it as a scale reference for larger enterprises while you build your own hourly figure.
Multiplier: hours of overrun on your window (D).
Overrun cost equals D × your hourly revenue or contribution figure.
Line 3: Exposure through an unmanaged device
Use the anchors from the table as a planning range with clear floor and ceiling bounds. Floor: median ransom paid of $139,875 in the Verizon 2026 Data Breach Investigations Report, covering only cases where a ransom was paid (69 percent of ransomware victims did not pay). Ceiling: IBM’s $4.99 million global average cost of a data breach from the 2026 Cost of a Data Breach Report. Both figures sit in the source table above so you can open the same Verizon and IBM pages when you brief finance.
Multiplier: your own annual likelihood (P). No public study supplies P for your firm.
Exposure cost equals P × the range you choose inside that floor-to-ceiling band.
State plainly in any board paper that the sources do not supply P. Finance can set P from your incident history, cyber insurance questionnaire, or a conservative planning assumption.
Line 4: Audit and license exposure
Unit cost anchor: Flexera’s 2026 State of ITAM Report figures in the table above (48 percent audited in the past year among respondents; 44 percent spent more than $1 million on audit-related costs over three years). Those are sample statistics for ITAM professionals, often at larger firms, and they set the scale for how expensive software audits become when inventory and entitlement drift.
Multiplier for a small team: unlicensed installs without a matching entitlement, times list price, or the amount on an audit letter if you already have one.
Audit exposure equals unlicensed installs × list price (or the letter amount when it exists).
Total for one window, and the ROI formula
Cost of one window ≈ line 1 + line 2 + (P × line 3) + line 4.
ROI = (avoided cost − program cost) ÷ program cost, where program cost is your own number for tooling, implementation time, and ongoing ownership. This page leaves program cost and payback months to your finance model.
Conservative by design
Wages exclude benefits. Ransom medians exclude recovery, legal, and customer notification costs. IBM’s average sits as a ceiling for a small firm on day one of planning. Every choice errs low so a finance reader can trust the direction of the math.
What this ledger leaves out on purpose
Many articles recycle small-business downtime-per-hour and breach-cost averages that cannot be traced to a primary study, or that were measured on enterprise populations and then applied to firms of ten people. This ledger keeps those patterns out. If a figure cannot be opened to a named report with a clear scope, it stays out of the formulas.
Each Cost Line Maps to a Capability That Scales With Enterprise Depth
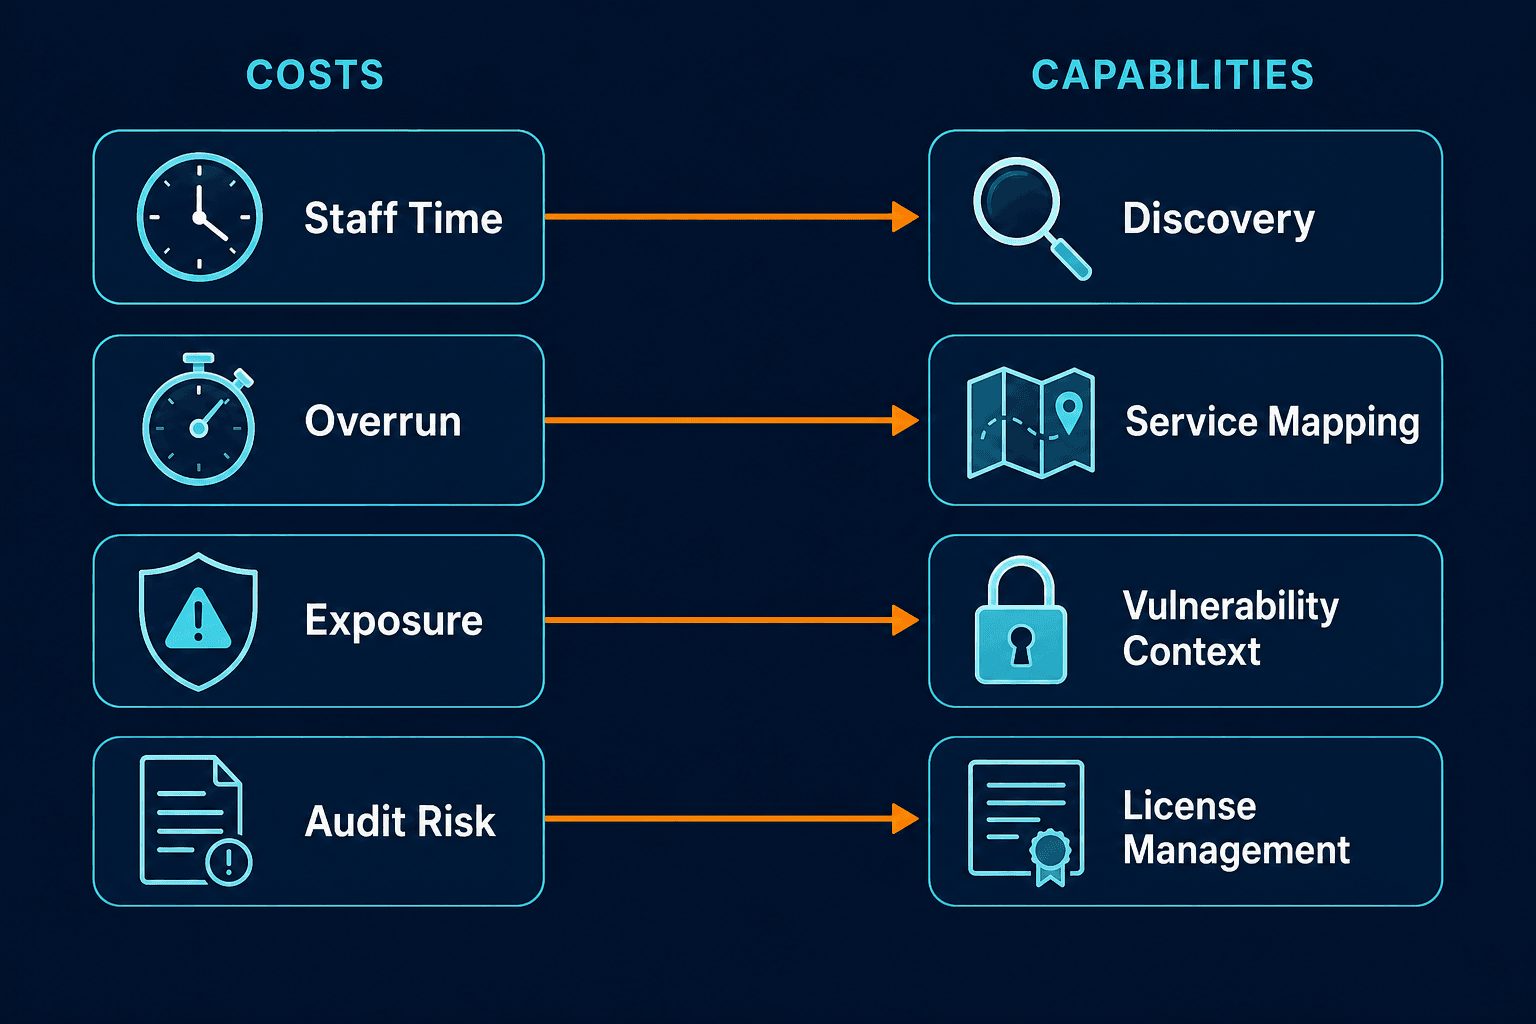
A common assumption says closing each of these gaps requires enterprise budget and enterprise tooling. The map below pairs each cost line with a capability that exists on the same platform path small teams use when they need discovery, service context, vulnerability context, and license control together.
Line 1, staff time. Discovery produces a reviewable list of devices that are not yet in the configuration management database (CMDB). Agent-based, agentless, and API-based discovery feeds a Discovered Items view that separates new findings from updates, so the unknown-device list comes from the scan cycle instead of spreadsheet archaeology. Duplicate remediation helps clean merges before the next window.
Line 2, overrun. ViVID™ service mapping includes blast-radius, incident and change impact, configuration-item-impacted, and host-down views, so the team sees what a change touches before the window starts. Services are defined by your team. Incident and change overlays need a supported IT service management platform. Those limits belong in the plan, because maps without service definitions and without ITSM linkage are incomplete for change impact.
Line 3, exposure. Vulnerability Insights, with NIST National Vulnerability Database and VulnCheck lookup, sits on the same map as the unmanaged-device list. Discovery covers network-connected infrastructure and cloud or SaaS accounts, plus off-network machines through agents. A device that never touches a scanned network and has no agent stays invisible. Say that limit out loud when you brief leadership.
Line 4, audit. IT asset management covers license management, contract management, and software usage metering, so entitlement and install data can meet in one place before a vendor letter arrives.
These capabilities match the same discovery, CMDB, ViVID™, ITAM, and Vulnerability Insights depth available on the enterprise path. Licensing model, asset limits, discovery app installations, and support level differ. The capability set for closing the four cost lines is the same sophistication small teams need when change windows, audits, and exposure share one calendar.
No tool removes the cost of unmanaged assets by magic. It moves each line from guessing to measuring. Keep percentage reduction claims out of the business case. Use the unit costs above as the inputs a future calculator would multiply, which is why the ledger sits before any product conversation.
When you want a longer shortlist of evaluation criteria for discovery coverage on lean teams, the companion guide on IT discovery tools for small and mid-size IT teams stays on selection criteria for this evaluation path.
Before the Next Window: Six Steps That Put a Number on Your Own Gap
- Run discovery across every network segment and cloud account before the window.
- Pull the list of devices that are absent from the register, and treat that list as the unauthorized-asset queue CIS expects you to work weekly.
- Time-log hand reconciliation for two windows so H is measured from real work.
- Check patch status on every device from step 2 before you freeze the change list.
- Define the services the change touches so overlays and maps mean something during impact review.
- Rerun discovery after the window and compare the two lists so the next cycle starts from a known delta.
Keep the steps tool-neutral until you choose a platform. The prior section already named where Virima fits each cost line. If you need a completeness check on the register itself, a completeness formula helps structure the before-and-after comparison without inventing a health percentage for your environment.
For teams building toward discovery-sourced operational truth across assets, services, and change context, start with how trusted runtime truth frames what must be true before the next window opens.
Put a Number on the Gap Before the Next Window
The cost of unmanaged IT assets for a small business comes due line by line when the change window opens. A sourced ledger with your multipliers beats a borrowed average every time. Build H, D, P, and the license gap from your own last two windows, then decide what program cost is worth avoiding the next overrun.
Want to see your own unmanaged-device list before the next window? Review what Business Pro includes for discovery-led inventory.
FAQ
What does it cost a small business to leave IT assets unmanaged?
No single credible figure covers every firm. The cost lands in four lines: staff time, window overruns, exposure, and audits. Each line uses a sourced unit cost and a multiplier you measure from your own windows.
What counts as an unmanaged IT asset?
Anything missing from your inventory or outside your management tooling counts, including devices, cloud resources, and software installs that never entered the register or the patch queue.
Why do unmanaged devices matter before a change window?
A window can only fix what appears on the work list. Devices off the list miss the patch queue, absorb hand reconciliation hours, and raise the chance the window overruns into production time.
Are published breach-cost averages realistic for a small business?
Treat global averages such as IBM’s $4.99 million figure as ceilings from larger samples when you build a small-firm range. Apply your own likelihood and keep recovery costs separate from ransom medians when you plan.
How do I estimate my own cost of unmanaged IT assets?
Time-log reconciliation hours for two windows, compute revenue or contribution per operating hour, set a likelihood for exposure, total unlicensed installs at list price, then sum the four ledger lines.