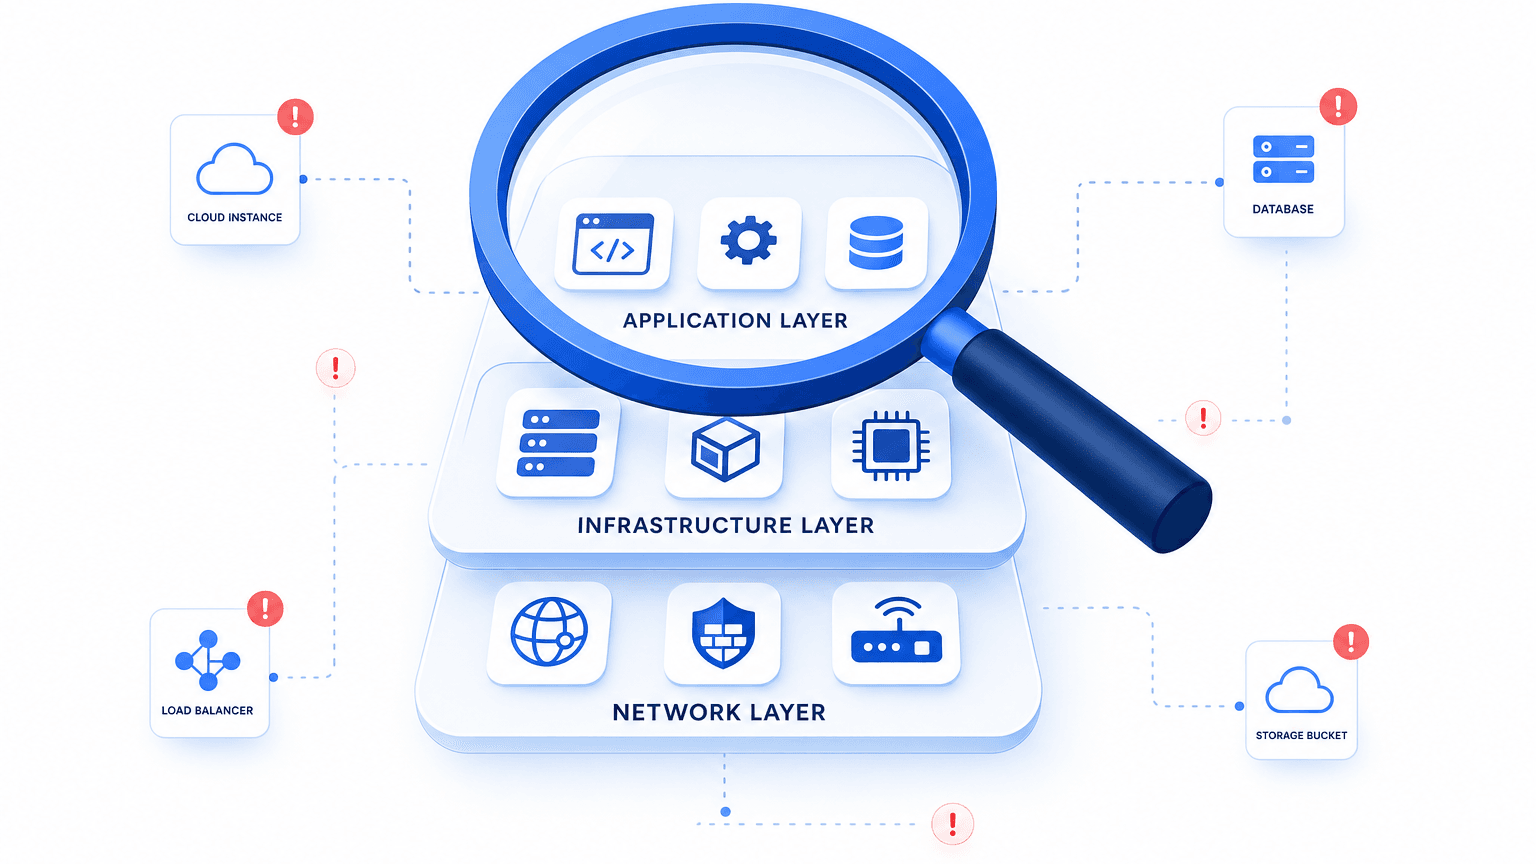
Site reliability engineering: why observability fails without authoritative infrastructure context

A distributed checkout service breaches its error budget within three minutes of a container deployment. The telemetry platform fires twenty distinct anomaly alerts across CPU saturation, database connection pools, and downstream API timeouts. Dashboards flash red, yet the on-call engineer spends the first twenty minutes of the incident asking basic questions: Which Kubernetes worker node hosts the affected pods? Did an unannounced network configuration change land upstream? Who owns the database read replica?
In the foundational Google Site Reliability Engineering Book, the discipline is described as applying software engineering principles to operations problems to maximize service reliability. Modern SRE practices embrace service level indicators (SLIs), service level objectives (SLOs), and error budgets to balance rapid release velocity with operational resilience. Telemetry tools capture metrics, logs, and traces at staggering volume, but telemetry only flags symptoms. This is the observability-context gap in site reliability engineering: the platform detects the symptom but can’t place it in infrastructure reality. When an incident threatens uptime, telemetry alone cannot reconstruct the physical and virtual dependency chains that underpin modern digital services.
Google’s DORA research program has repeatedly found that high-performing technical organizations achieve faster mean time to restore (MTTR) by maintaining clear visibility into system changes and operational context. When observability tools operate in an architectural vacuum disconnected from infrastructure reality, SRE teams spend scarce engineering cycles playing digital detective rather than solving systemic failures.
The telemetry paradox in modern SRE
Site reliability engineering teams invest heavily in full-stack observability. Distributed traces follow user requests across microservices, while APM agents record microsecond latency spikes. Despite this abundance of instrumentation, critical incident resolution times frequently stagnate.
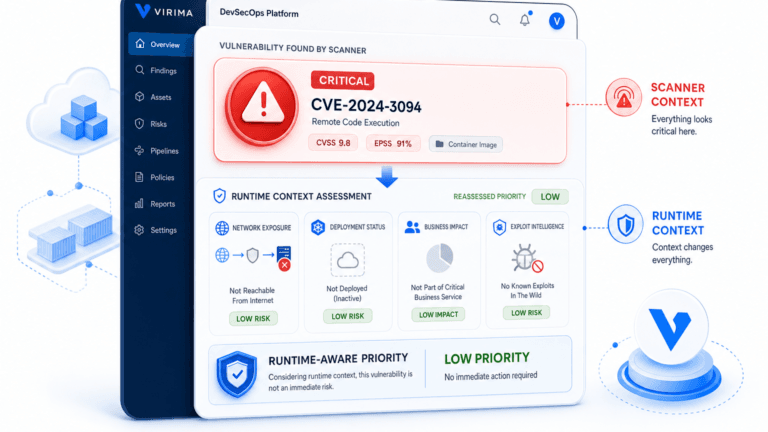
This disconnect is the telemetry paradox: observability tools excel at identifying that a software service is degrading, but they do not record the underlying infrastructure state. A trace shows that an API call stalled, but it does not record whether the underlying virtual machine underwent an unrecorded patch, or whether a physical switch dropped packets.
Observability tools capture transient application behavior. They do not store an authoritative, configuration-managed record of what hardware, hypervisors, cloud instances, and network links compose that application. When symptoms appear without that structural baseline, triage becomes an exercise in manual correlation across fragmented dashboards.
Site reliability engineers often describe this state as drowning in data while starving for context. When an alert storms in from multiple microservices simultaneously, the monitoring engine shows that ten services are unhealthy — but it does not identify which one is the primary failure point and which nine are downstream victims responding to the initial outage.
Why does telemetry alone fall short for site reliability engineering teams?
Telemetry tools identify that an application is failing by capturing metrics and traces, but they lack visibility into the underlying infrastructure configuration. Without authoritative topology and dependency context, engineers waste critical triage time manually investigating whether outages stem from code, cloud instances, network changes, or shared infrastructure.
What breaks when SRE lacks dependency topology
When distributed microservices run atop hybrid cloud environments, services rarely fail in isolation. An outage in one cluster cascades through shared message brokers, proxy layers, and storage arrays.
Without an authoritative operational context layer, site reliability engineering workflows break down across three predictable operational stages:
Incident triage paralysis
Responders receive dozens of correlated alerts from downstream services. Without a unified service dependency map, engineers cannot pinpoint whether the root cause sits in the database layer, the underlying virtualization cluster, or an unmanaged API gateway. The first fifteen minutes of an incident are consumed establishing basic architectural facts. The same pattern shows up in CMDB relationship data gaps that slow incident triage: incomplete dependency records add minutes to every P2 ticket, not only the ones SRE teams own.
Blast radius blindness
Blast radius is the set of downstream services affected if a specific infrastructure change fails. Site reliability engineers calculating error budgets need to evaluate the downstream impact of planned architectural changes. If configuration records remain siloed across disparate cloud consoles, calculating that blast radius becomes guesswork — the same blind spot that turns change advisory board blast-radius estimates into an educated guess rather than a verified fact. Teams release changes without knowing which upstream services depend on the modified configuration items.
Change attribution deficits
Four in five respondents to Uptime Institute’s 2024 annual outage analysis said their most recent serious outage could have been prevented with better management, process, or configuration control. That gap shows up at the worst moment. When telemetry flags a performance cliff, SREs lack immediate visibility into recent change advisory board records, emergency configuration updates, or unrecorded drift on supporting CIs. Responders treat configuration-driven incidents as software bugs and extend remediation cycles — the exact pattern behind a firewall change that looked low-risk until it took down seven business services.
Closing this gap requires continuous, verified knowledge of what infrastructure exists and how it connects across technology tiers.
The cognitive load of siloed operational tools
In many engineering organizations, site reliability engineers must navigate four or five disconnected consoles during a major outage. The APM dashboard shows application response times. The cloud console lists virtual instances and autoscaling groups. The network monitoring tool tracks interface packet loss, while the IT service management system contains change tickets.
None of these tools present an integrated view of runtime truth — so engineers end up mentally context-switching under pressure. They manually cross-reference hostnames, IP addresses, and container IDs across platforms, attempting to synthesize a complete mental model of the failing system. That manual correlation is pure toil: repetitive, avoidable work that doesn’t reduce risk; it just consumes on-call hours a dependency model could return instead.
This cognitive burden directly degrades team performance. Investigating repetitive, ambiguous alerts is a well-documented driver of alert fatigue and on-call burnout. Over time, on-call responders begin ignoring warning signals because the effort required to diagnose underlying infrastructure causes feels overwhelming.
A verified context layer relieves this cognitive load. By automatically joining telemetry signals to structural dependency models, engineering organizations give responders immediate situational awareness for fast, decisive triage.
Observability data versus infrastructure runtime truth
The table below contrasts what application performance monitoring tools observe against what discovery-sourced runtime context provides.
| Operational Dimension | What Observability Tools Capture | What Authoritative Runtime Truth Adds | The Impact on SRE Incident Workflows |
|---|---|---|---|
| Service Health & Symptoms | Microsecond latency, error rates, traces, and CPU spikes | Physical host identity, hypervisor layer, cloud region, and network path | Isolates whether performance degradations stem from noisy neighbors, host failures, or application code defects |
| Dependency Architecture | Dynamic application-to-application network call graphs | Multi-tier CI mapping connecting software components to database instances, storage, and networking | Exposes hidden single points of failure across shared hardware and virtualization clusters |
| Change & Ownership Context | Deployment markers and commit hashes in CI/CD pipelines | Authoritative CI ownership, maintenance schedules, change history, and upstream business dependencies | Directs incident response to the responsible engineering team and immediately links alerts to recent infrastructure modifications |
Grounding SRE in discovery-sourced operational context
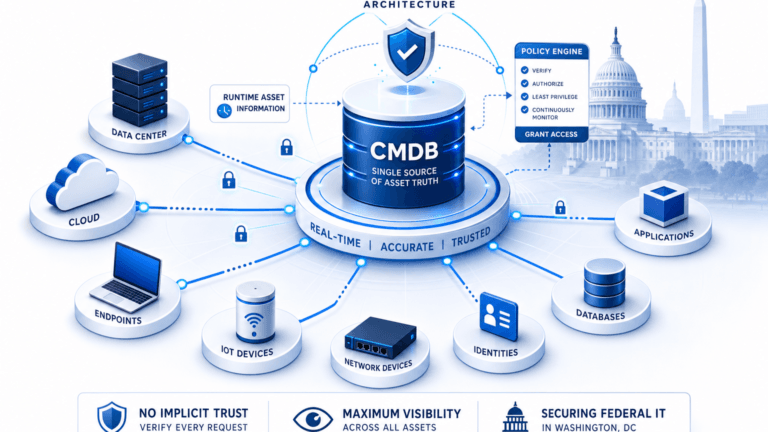
To eliminate triage friction, site reliability engineering teams require a verified data layer beneath their monitoring stack. High-frequency discovery cycles refresh infrastructure state across on-premises data centers, private clouds, and multi-cloud environments. This process captures transient assets, virtual appliances, and network interconnects before drift occurs.
When service definitions are established, dynamic service mapping binds individual configuration items into complete application topologies. This gives SREs a clear view of service dependencies, so teams can correlate application telemetry with underlying server health, storage utilization, and network integrity.
Modern SRE teams use this contextual layer to redefine post-incident reviews. Instead of debating timeline discrepancies across disconnected log aggregators, post-mortems center on verified dependency records and change histories. Teams identify structural vulnerabilities in system architecture, enabling engineering leadership to direct reliability investments where they generate the greatest resilience.
Virima delivers this discovery-sourced truth directly into enterprise workflows. Through hybrid agent-based and agentless discovery, Virima populates a current CMDB and generates dynamic ViVID™ service maps once service definitions are supplied. SREs gain full visibility into what hardware, cloud instances, and dependencies power each production workload. Virima integrates with ServiceNow, Jira, Ivanti, and other major ITSM platforms (see the full integrations list). That means engineering teams can access current asset context inside the incident management tools they already use.
Equipped with verified infrastructure topology, site reliability engineers transform observability alarms into actionable remediation paths, reducing MTTR and protecting service error budgets.
How does a modern CMDB support site reliability engineering practices?
A modern, discovery-sourced CMDB provides SREs with a current baseline of infrastructure assets, configuration states, and service dependencies. By linking application telemetry to physical servers, cloud workloads, and CI ownership, SRE teams can rapidly isolate root causes, assess change blast radius, and reduce incident MTTR.
Equip your site reliability engineering team with discovery-sourced dependency mapping and live configuration context so telemetry alerts resolve into fast, confident incident remediation.
Accelerating SRE remediation through authoritative context
Site reliability engineering requires more than raw telemetry streams; it demands structural context — the piece that explains how the surrounding infrastructure contributed to a failure, not just that the failure happened.
When SRE teams combine performance metrics with discovery-sourced asset truth, dependency mapping, and change governance, they build resilient systems capable of rapid recovery. Incident commanders no longer guess which shared service failed or which team owns a degraded node, and engineering organizations protect error budgets while scaling safely across complex hybrid clouds.
Schedule a demo to see how Virima discovery and ViVID™ service mapping bring verified infrastructure context to your site reliability engineering workflows.
Frequently Asked Questions
Can site reliability engineering rely entirely on APM and telemetry tools?
No. APM and telemetry platforms track application traces and runtime errors, but they do not maintain an authoritative record of physical, virtual, and network infrastructure dependencies. Without this underlying infrastructure context, engineers struggle to identify whether outages originate from code bugs, network switch failures, or noisy neighbors.
How does service mapping improve SRE incident management and MTTR?
Service mapping links individual software services to their underlying hardware, virtual machines, cloud components, and network links. During an outage, service maps allow SREs to visualize cascade paths instantly, understand blast radius, and identify the exact failing configuration item without manual correlation.
Does Virima’s CMDB integrate with existing APM and ITSM tools used by SRE teams?
Yes. Virima integrates with ServiceNow, Jira, Ivanti, and other major ITSM platforms, so discovery-sourced CMDB and ViVID™ service map data surface directly inside the incident and change tools SRE teams already use, without requiring a separate console for infrastructure context.