Service Maps vs Observability Traces for Change and Incident Decisions

The change manager has the CAB packet open. A load balancer patch is on the agenda. The APM dashboard shows the dependency graph: API gateway to auth service to product database. Clean. The change manager approves. The change window runs at midnight. By 12:40 AM, three business services are offline. The load balancer sat between the application tier and a storage cluster that no span ever crossed. The APM map showed everything it knew. Everything it knew was incomplete.
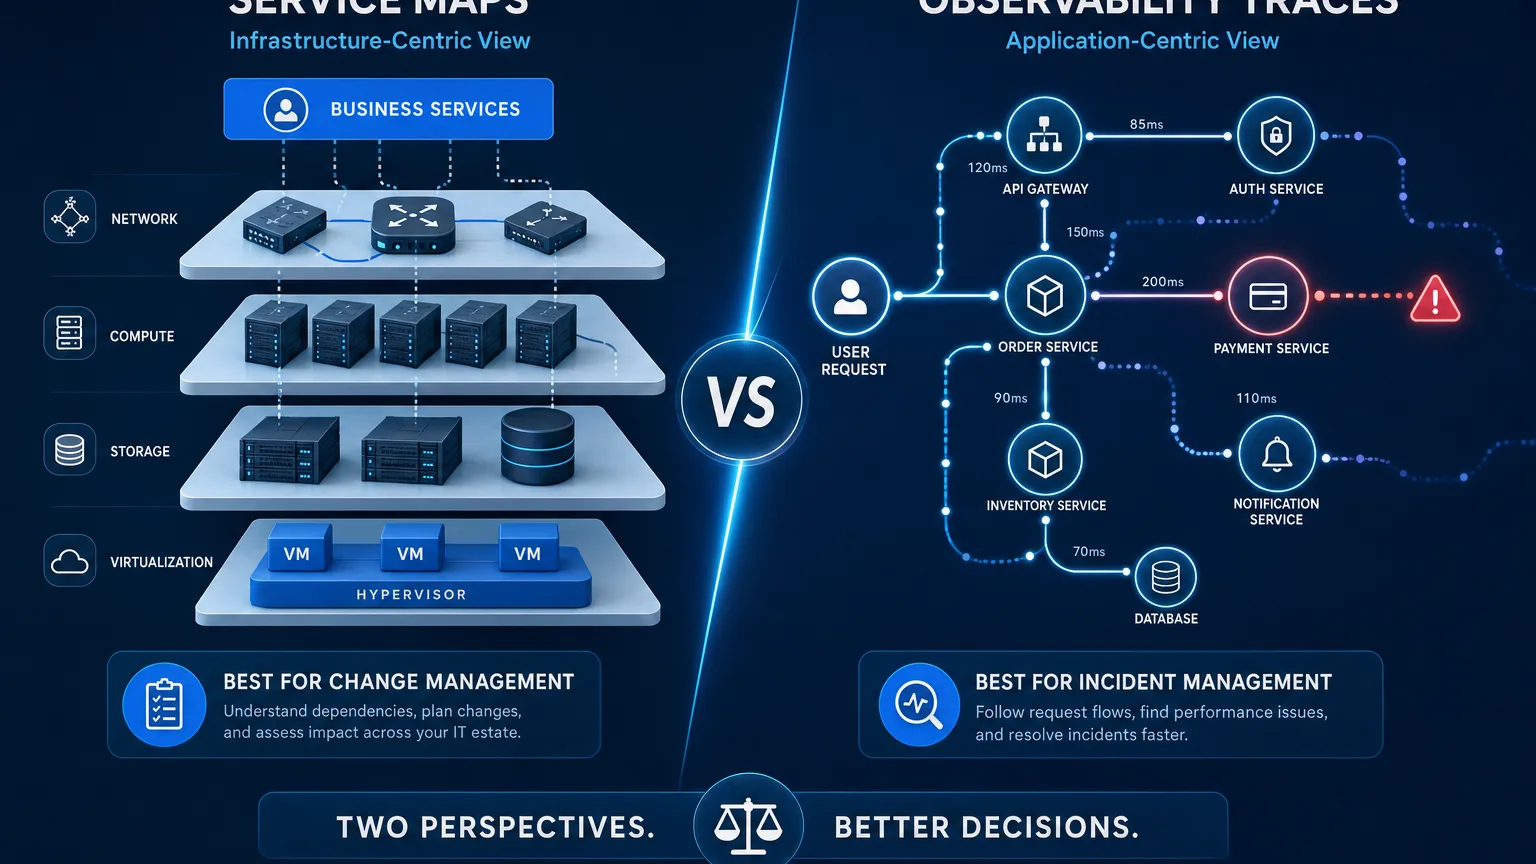
Enterprise IT teams now operate with two fundamentally different dependency lenses. Discovery-backed service maps build their picture from infrastructure probes, SNMP, WMI, SSH, and APIs interrogating actual devices across the estate. Observability traces build theirs from application instrumentation, OpenTelemetry spans and vendor agents following request paths through code. Both views are accurate for what they cover. They cover different things, update on different cadences, and live in different organizational budgets.
This article is a head-to-head for two specific decisions: pre-change blast radius assessment and incident root cause isolation. Background on what application dependency mapping covers broadly is handled there; that ground isn’t repeated here. What follows is the comparison practitioners need when someone in the room asks, “can’t we just use the APM service map for CAB review?” and needs a structured answer.
The comparison framework
What estate segments do observability traces miss that discovery-backed service maps cover?
Observability traces only cover instrumented application services. Network switches, storage arrays, hypervisors, operational technology (OT) devices, and any host without an agent or Software Development Kit (SDK) produce no spans. Discovery-backed service maps built from SNMP, WMI, and SSH probes cover those segments directly, the two tools are looking at different halves of the same estate, not the same half twice.
The stakes are already measured. The Uptime Institute’s 2026 Annual Outage Analysis Report found that 29% of significant outages trace to insufficient blast-radius controls, and 42% link to deployment or configuration changes that lacked adequate safeguards, exactly the gap a change-versus-incident dependency framework needs to close.
Seven dimensions separate these two lenses for change and incident work, comparing what each surfaces about discovery-backed service maps and observability traces side by side. The table below is the anchor for what follows, build your team’s decision criteria against it.
| Dimension | Discovery-Backed Service Maps | Observability Traces |
|---|---|---|
| Data source | Infrastructure probes (SNMP, WMI, SSH, APIs) and CMDB enrichment | Application instrumentation (OpenTelemetry, vendor agents, SDK) |
| What it maps | Infrastructure-to-business-service dependencies: servers, network gear, storage, VMs, cloud resources, and the services they compose | Request-path dependencies: service A calls service B calls database C, with latency and error rates per hop |
| Estate coverage | Full infrastructure including network gear, storage arrays, hypervisors, OT/IoT, and unmonitored hosts | Only instrumented application services, network gear, storage arrays, hypervisors, and uninstrumented legacy apps are invisible |
| Pre-change blast radius | Strong, shows all downstream services and infrastructure affected by a proposed change before execution; feeds CAB review | Weak, traces show historical call patterns, not which components would fail from a specific future change |
| Incident root cause | Shows infrastructure-layer dependencies (switch port, VM host, storage LUN) that traces cannot reach; correlates recent changes to impacted CIs | Strong for application-layer root cause, pinpoints slow spans, error-throwing services, latency waterfall; weak below the application layer |
| Data freshness model | Scan-cycle-based (minutes to hours depending on probe frequency); staleness is schedulable and controllable | Near-real-time for actively trafficked paths; blind to paths not exercised during the observation window |
| Failure mode | Misses dependencies unreachable by discovery probes; stale if scan schedules lag | Drops visibility when spans are lost, services are uninstrumented, or traffic patterns shift after deployment |

Change decisions: blast radius assessment before the CAB review
Consider a database migration in a Thursday CAB slot. The change manager pulls the Dynatrace call graph, which shows the order management service, the inventory API, and the reporting service as declared dependents on the database. Dependencies look accounted for, and the migration looks bounded.
What the call graph misses
The database VM shares a hypervisor host with two other production workloads, and its storage volume sits on the same LUN as one of those co-tenants. The migration resizes the database volume, and during the window that resize competes for IOPS with the co-tenant workload. The result: storage contention and intermittent timeouts on both services, with no APM alert to predict it, no application span ever crossed from the database tier into the hypervisor or storage fabric.
A “service map” in Datadog, Dynatrace, or Jaeger visualizes trace-derived call relationships: which instrumented services called each other during a recent observation window. Traces record what happened. Change impact asks a conditional question, which components would fail if this specific change executes as planned, and traces cannot answer it.
How a discovery-sourced map closes the gap
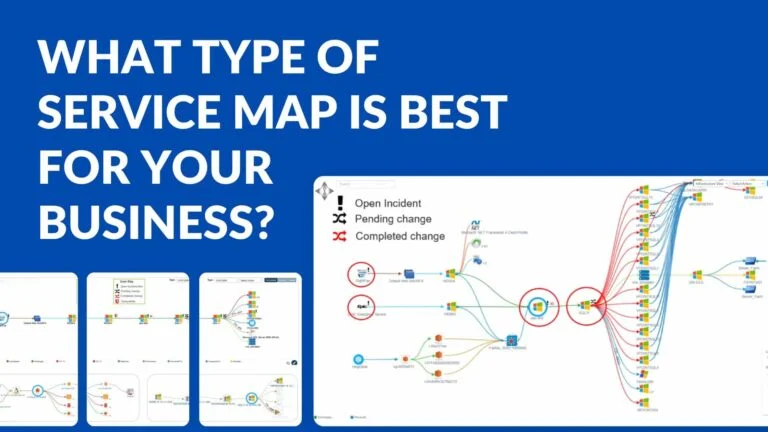
Virima’s ViVID™ service maps show the layer the call graph omits: the hypervisor host, the co-tenant VMs, the shared storage LUN, and the business services dependent on it. The map overlays pending changes, recent modifications, and open incidents on the same infrastructure graph, so the CAB reviewer sees the full blast radius before the change window opens.

Discovery-backed maps run on a scan schedule, and a four-hour scan interval may not reflect a dependency introduced three hours ago. That freshness gap is real but manageable: probe frequency can be increased before a change window, narrowing the staleness window for critical pre-change checks. A structural trace blind spot over uninstrumented infrastructure sits in a different category. It cannot be closed by adjusting scan frequency, because no scan reaches that layer at all.
How can change managers determine whether observability traces provide sufficient blast radius coverage for a proposed change?
The test is whether the component being changed sits within the instrumented application tier or at a layer boundary below it. If the change touches a load balancer, network segment, storage resource, or hypervisor, application traces cover zero of its infrastructure blast radius, no instrumented span ever crosses those boundaries. Blast radius assessment for any change at or below that boundary requires a discovery-sourced service map.
Incident decisions: where each lens takes over
An alert fires at 2:14 AM. A customer-facing checkout API returns 500 errors on 31% of requests. The incident commander opens Jaeger. The trace waterfall shows the API gateway timing out on calls to the payment service, which calls a pricing database with 8.4-second call latency. Root cause candidate identified in under four minutes. The on-call engineer finds a missing index introduced in the previous deployment, applies a fix, and closes the incident in 22 minutes.
This is distributed tracing working as designed: request-path granularity, latency isolation at the span level, and fast root cause for application-layer failures. Jaeger, Datadog APM, and Dynatrace PurePath handle this well.
When traces go blank
The scenario changes when all application spans read clean and the service-level symptom continues. The payment service returns 200s internally, database query times are normal, but the API gateway is still timing out on connections to the payment service host. The payment service VM runs on a memory-overcommitted hypervisor that is paging, and the VM pauses during garbage collection exceed the gateway’s connection timeout threshold.
No OpenTelemetry agent reports from a hypervisor, and no SDK runs on a storage controller, the trace goes blank at the application-infrastructure boundary. Federal guidance such as CISA Binding Operational Directive 23-01 treats complete asset visibility, including devices that never emit application spans, as a baseline control for vulnerability and incident response. The incident commander now needs network topology discovery data: which hypervisor host runs the VM, its memory allocation, and what its swap activity shows. A discovery-sourced service map built from hypervisor interrogation and multi-protocol infrastructure probes covers that layer, SNMP and WMI return host-level resource data the application trace never reached.
Traces take the incident from alert to application-layer root cause. When spans are clean but the symptom persists, root cause has crossed the application-infrastructure boundary, and the service map picks up there. Teams that treat these tools as a handoff sequence, not competitors, close infrastructure-layer incidents faster, because they know when to switch lenses.

When do observability traces stop being useful during a major incident investigation?
Traces reach their limit when all application spans report within normal latency and error bounds, but the service-level symptom continues. Clean spans with degraded service output indicate root cause sits below the instrumentation boundary, in a hypervisor, storage fabric, or network layer where no agent or SDK reports. At that signal, a discovery-sourced infrastructure service map is the correct next tool.
The gap between service maps and observability traces
These tools don’t connect to each other in most enterprise environments, for reasons that are both organizational and technical.
Organizational
Observability stacks sit in SRE and DevOps budgets; discovery-backed service maps sit in ITSM and IT operations budgets. SRE and IT ops often report to different VPs, and the tooling reflects the org chart: CAB reviews use the ITSM stack, incident war rooms use the observability stack, and the two groups rarely share a common dependency data model. Middleware’s 2026 State of Observability Report found 46.7% of organizations run two to three observability tools in parallel, and only 7.4% rely on a single unified platform, fragmentation that compounds when the CMDB and the trace store never talk to each other.
Technical
Traces are structured around spans: service name, operation, duration, parent span. CMDB configuration items (CIs) use a different model: CI class, attributes, relationship type, last-discovered timestamp. There is no native join key between a Datadog service entity and a CMDB CI. Building one requires a shared naming convention across teams, rare in practice, or a discovery platform that reconciles application-layer identifiers against infrastructure CIs under a common identity model.
How can enterprises bridge the gap between CMDB service maps and observability traces?
Bridging the CMDB-observability gap requires a shared identity model, not a shared tool. A discovery platform that reconciles application-service identifiers against infrastructure CIs under authority-rule reconciliation lets a trace span and a CI resolve to the same dependency record, without requiring SRE and ITSM teams to adopt each other’s stack.
Update cadence
Traces reflect active request paths near-real-time. Discovery maps run on a scan schedule, and for environments with frequent change, container workloads, ephemeral cloud resources, auto-scaling groups, scan cadence determines how current the infrastructure map stays. Multi-source discovery with authority-rule reconciliation addresses this: when multiple probes report on the same CI, the most authoritative source for each attribute wins, and probe frequency can be tuned per device class.
ViVID™ maps integrate with ServiceNow, Jira Service Management, Ivanti, and other ITSM platforms through the Virima integrations hub, so the service map surfaces inside the ITSM workflow instead of a separate console, cutting the context-switching cost during CAB review. The same practices that make that possible, consistent CI identity, authority-rule reconciliation, scheduled high-frequency probes for critical device classes, are the foundation of a trustworthy CMDB that can serve as a join layer between observability data and infrastructure maps.
Decision framework: when to use which
The practical question facing change managers and incident commanders: given the use case in front of you right now, which lens do you reach for first, and when do you switch? The table below compares discovery-backed service maps against observability traces across six common change and incident scenarios.
| Use Case | Primary Lens | Why | Switch Trigger |
|---|---|---|---|
| Pre-change CAB review | Discovery-backed service map | Shows full blast radius including infrastructure below the application tier | Supplement with trace call graph if change scope is application-tier-only with no infrastructure dependencies |
| Production incident triage (application layer) | Observability traces | Span-level root cause isolation is faster than map traversal for application latency | Switch to service map when all application spans are clean but the symptom persists |
| Infrastructure-layer root cause | Discovery-backed service map | Covers storage, network gear, and hypervisors invisible to instrumentation | Confirm application-layer recovery using traces once infrastructure root cause is resolved |
| Post-incident review | Both | Traces reconstruct the request-path timeline; service maps show what infrastructure was in scope | Combine both timelines in one postmortem packet before assigning ownership actions |
| Change risk scoring for automation | Discovery-backed service map | Provides the dependency graph for pre-change policy evaluation | Trace data supplements for high-frequency pure-application changes |
| SRE SLO breach investigation | Observability traces | SLO calculation derives from trace-based latency and error rate data | Switch to service map when the breach traces to infrastructure capacity or a co-tenant workload |
Top application dependency mapping tools evaluated across these use cases is further reading for teams building this into a tooling review. The real question most teams face isn’t service maps versus traces, it’s whether both lenses are maintained, and whether the handoff between them has a named owner on each side of the ITSM-observability divide.
The lens you don’t have is the one that burns you
Most organizations relying on observability traces for change impact assessment carry an implicit assumption: the instrumented application tier covers the relevant blast radius. For changes contained within that tier, the assumption holds. For changes that touch load balancers, network segments, storage resources, or hypervisor layers, it doesn’t, and the gap surfaces only after the change window closes.
Virima’s ViVID™ service maps provide the infrastructure-layer dependency context that observability stacks don’t reach: which infrastructure CIs sit in the blast radius of a proposed change. Pending changes, recent modifications, and open incidents map to the same view, so CAB reviewers see operational context alongside dependency scope in one place, before the change window opens.
The decision framework above is the checklist your next CAB review needs. See how ViVID™ closes that gap before your next change window opens: Explore Trusted Runtime Truth
Frequently Asked Questions
What is the difference between a CMDB service map and an APM trace-derived service map?
A CMDB service map is built from infrastructure discovery probes, SNMP, WMI, SSH, and APIs, that interrogate actual devices across the estate regardless of whether those devices generate application traffic. An APM trace-derived service map is built from instrumented request paths and only covers services that produce spans. In practice, network gear, storage arrays, hypervisors, and unmonitored hosts appear in CMDB service maps but are invisible to trace-derived maps. The coverage gap matters most when the component being changed or the incident root cause sits below the application tier.
Why can’t APM service maps replace discovery-backed service maps for change advisory board decisions?
APM service maps record which instrumented services called each other during a recent observation window. Change advisory board (CAB) decisions require knowing which components would be affected by a proposed change that has not yet run. Traces answer a historical question; CAB review requires a conditional one, what would break if this specific change executes as planned. Discovery-backed service maps cover the full infrastructure blast radius, including components that generate no spans, before the change window opens.
When do observability traces become insufficient during a major incident investigation?
Traces become insufficient when all application spans report within normal latency and error bounds, but the service-level symptom continues. That pattern, clean spans alongside degraded service output, indicates root cause has crossed the application-infrastructure boundary into a hypervisor, storage fabric, or network layer where no instrumentation agent runs. At that signal, a discovery-sourced infrastructure service map is the correct tool to continue the investigation, not additional trace analysis.
How does Virima ViVID™ complement distributed tracing tools like Datadog or Dynatrace during incidents?
Virima ViVID™ service maps cover the infrastructure layer that distributed tracing tools don’t reach: hypervisors, storage arrays, network gear, and unmonitored hosts discovered through SNMP, WMI, and agentless probes. When distributed traces identify an application-layer root cause clearly, ViVID™ is not needed for that stage. When traces go blank, clean spans with a degraded service, ViVID™ provides the infrastructure-layer dependency view that shows what sits below the instrumentation boundary and which business services it affects.
What does ViVID™ show during a CAB review that observability traces cannot?
ViVID™ shows infrastructure dependencies below the application tier, storage LUNs, hypervisor hosts, network segments, and co-tenant workloads that a proposed change might affect but that no application span ever touches. It also overlays pending changes, recent modifications from the prior change window, and open incidents on the same dependency map. CAB reviewers get a combined blast radius and operational context view in one screen, including infrastructure segments that trace-derived service maps have no data for.