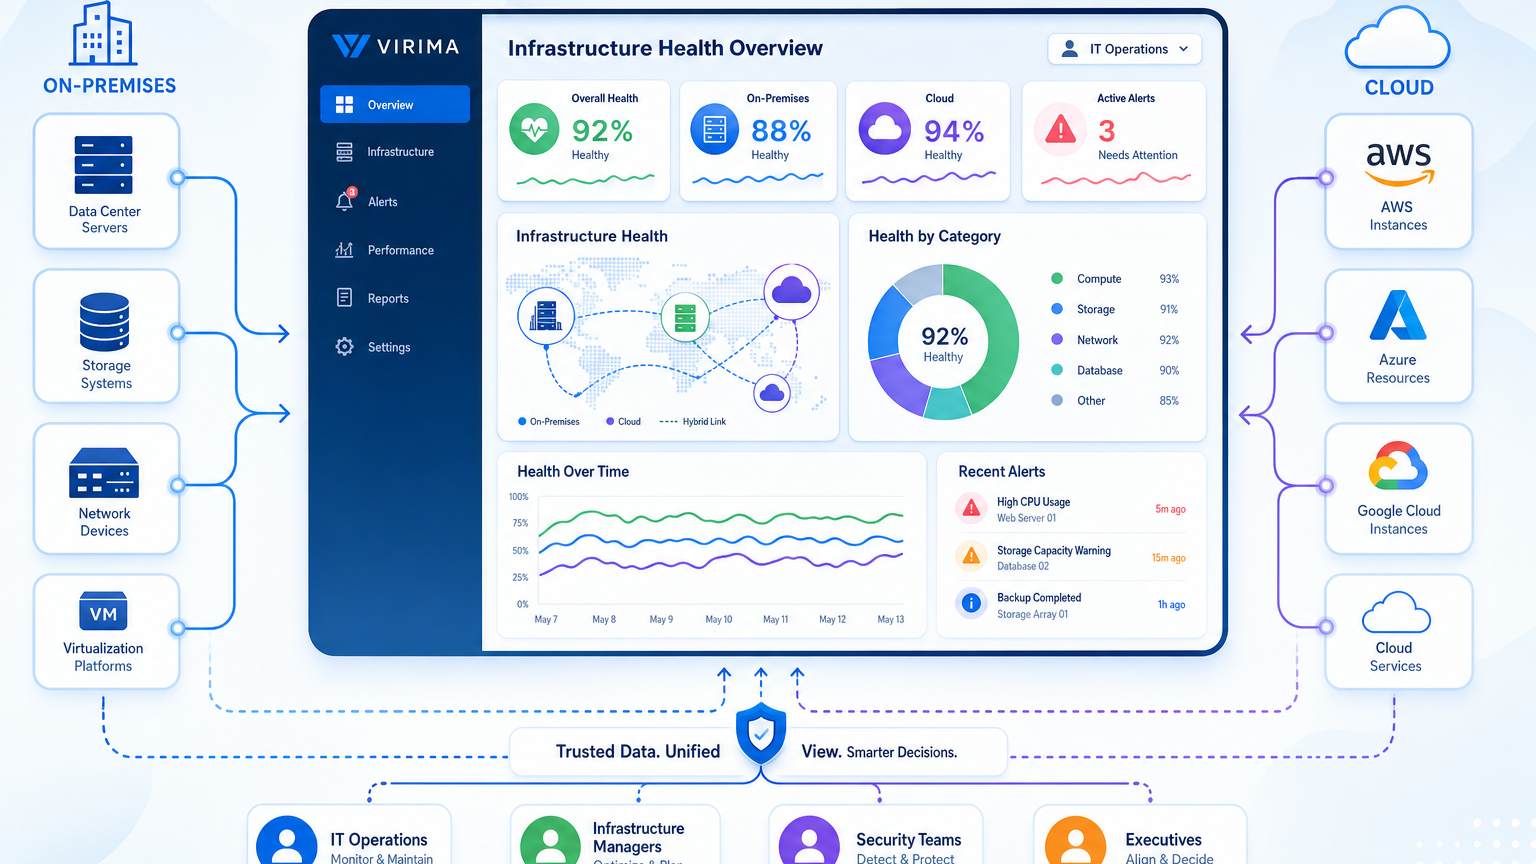
Can Role-Based Dashboards Show Infrastructure Health Across On-Prem and Cloud From Trusted Data?

An infrastructure dashboard can show green while its inventory omits a cloud instance or retains a retired server. That gap can distort an infrastructure director’s incident priorities and change decisions. A dashboard summary alone cannot show whether its underlying sources cover the intended environment.
Yes, role-based dashboards can show infrastructure health across on-premises and cloud environments. The view depends on current, reconciled records and suitable operational signals.
Virima supports role-based dashboards and consolidated infrastructure views. Its discovery and configuration management database (CMDB) capabilities provide asset and relationship information for those views. Teams should evaluate monitoring coverage and dashboard configuration against their own requirements.
What makes infrastructure dashboard data trustworthy?
A current inventory can identify a server and its recorded configuration. A monitoring signal may show whether that server is responding. Both inputs need enough coverage and currency for the decision they support.
In Flexera’s 2025 ITAM survey, complete visibility across the technology stack fell to 43%, from 47% the previous year. The report drew on responses from 506 global IT professionals. The finding concerns overall technology visibility, rather than dashboard accuracy specifically.
The Cybersecurity and Infrastructure Security Agency’s guide recommends maintaining an inventory of IT assets, including cloud-based assets. Teams can use that inventory to define the assets their operational views should cover. IT asset inventory management: A complete guide
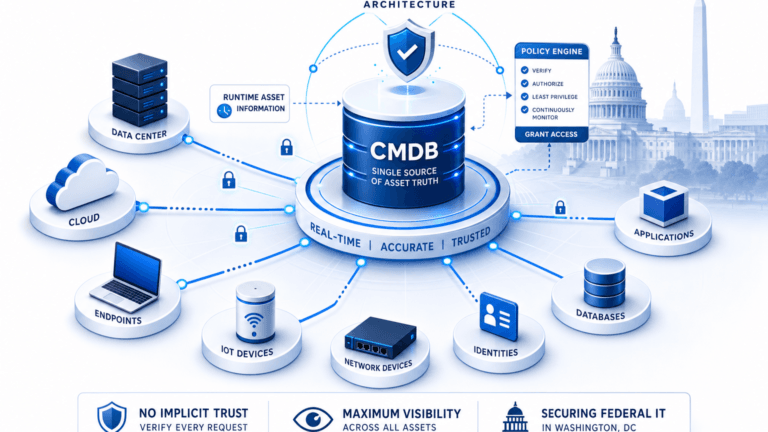
Virima’s Trusted Runtime Truth connects discovery-sourced records with information about assets and their relationships. It also supports questions about what changed, what could be affected, and who owns the relevant assets.
Explore Trusted Runtime Truth for infrastructure decisions.
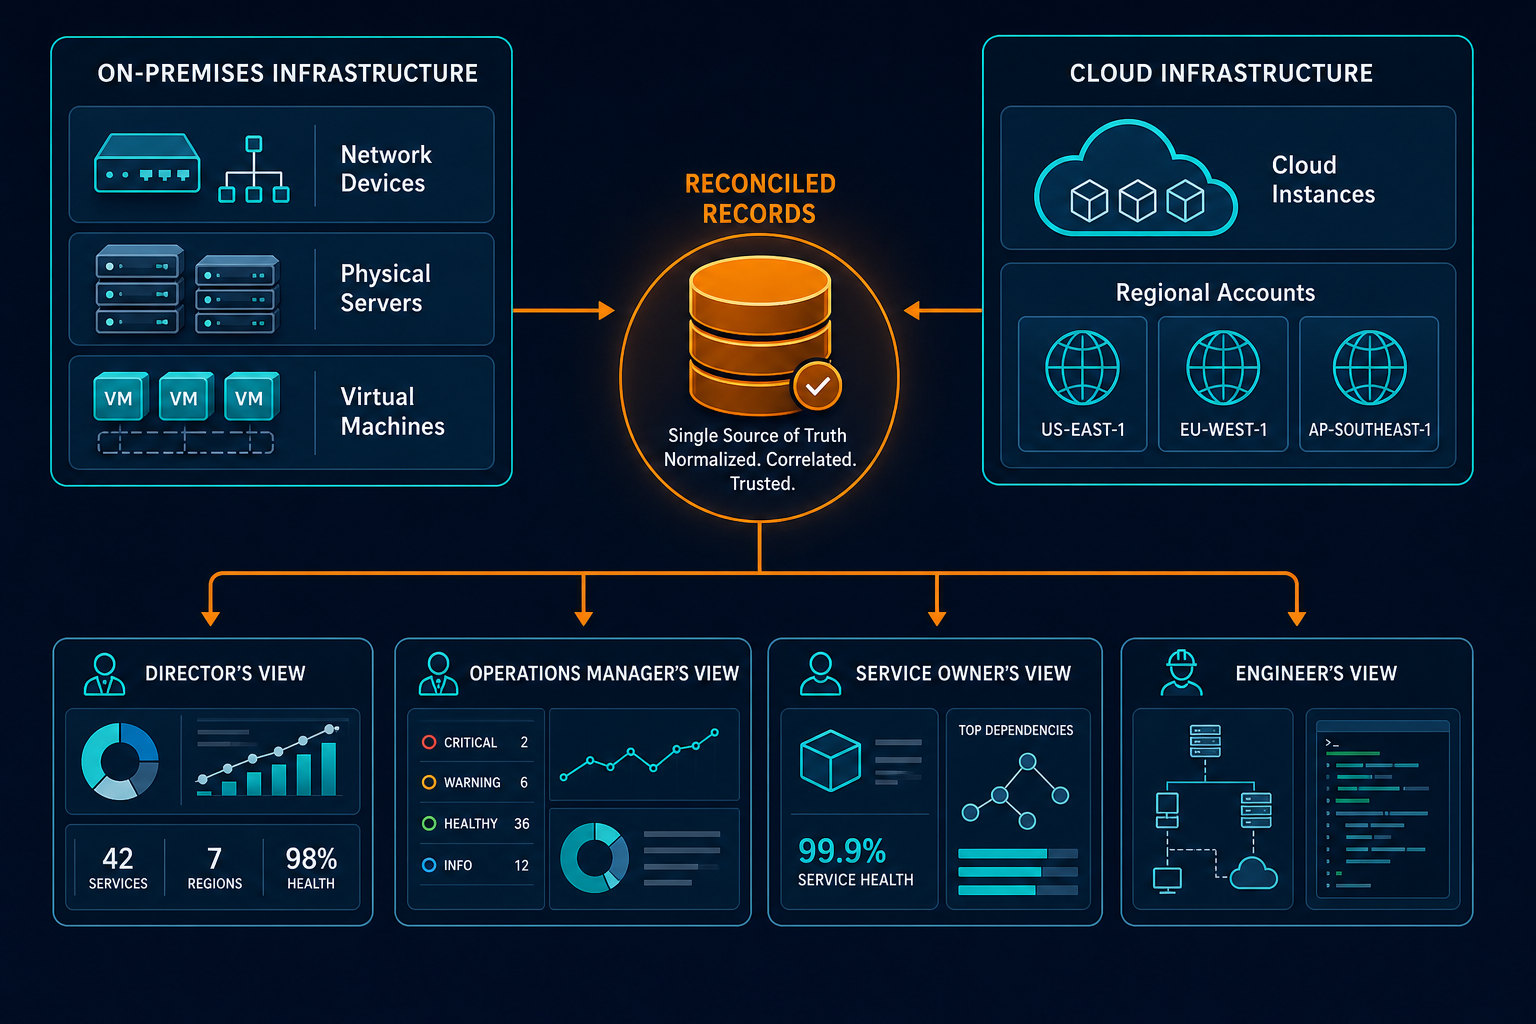
Which infrastructure questions should each role be able to answer?
A useful dashboard gives each role a view suited to its decisions. The following table provides evaluation criteria for a vendor demonstration.
| Role | Decision question | Information to evaluate |
|---|---|---|
| Infrastructure director | Where could issues affect important services? | Service dependencies, infrastructure coverage, ownership, and unresolved risks. |
| IT operations manager | Which issues need investigation or escalation? | Operational signals, affected configuration items, and incident details. |
| Service owner | Which components support my business service? | Service dependencies, named owners, and associated infrastructure records. |
| Infrastructure engineer | What should I inspect before a change? | Asset configuration, relationships, recent changes, and relevant monitoring data. |
An infrastructure director needs blast-radius and ownership context to prioritize risk. An IT operations manager needs active incidents and affected configuration items to decide what to escalate. A service owner needs the mapping between a named business service and its components. An infrastructure engineer needs pre-change configuration detail and relationship history. The same underlying records support all four views — only the framing changes.
Ask vendors to demonstrate these views using the same sample asset. Both a director’s and an engineer’s view should trace back to consistent records.
Check which users can view, change, or export sensitive infrastructure information. Confirm those permissions during a demonstration. Dashboard personalization and access control should be evaluated separately.
Why can two infrastructure dashboards show different results?
Infrastructure dashboards can disagree when their underlying sources or reporting rules differ. For example, one view may count open incidents while another counts affected assets. Compare metric definitions, filters, and reporting periods before deciding which result answers the operational question.
How can a dashboard cover on-premises and cloud infrastructure?
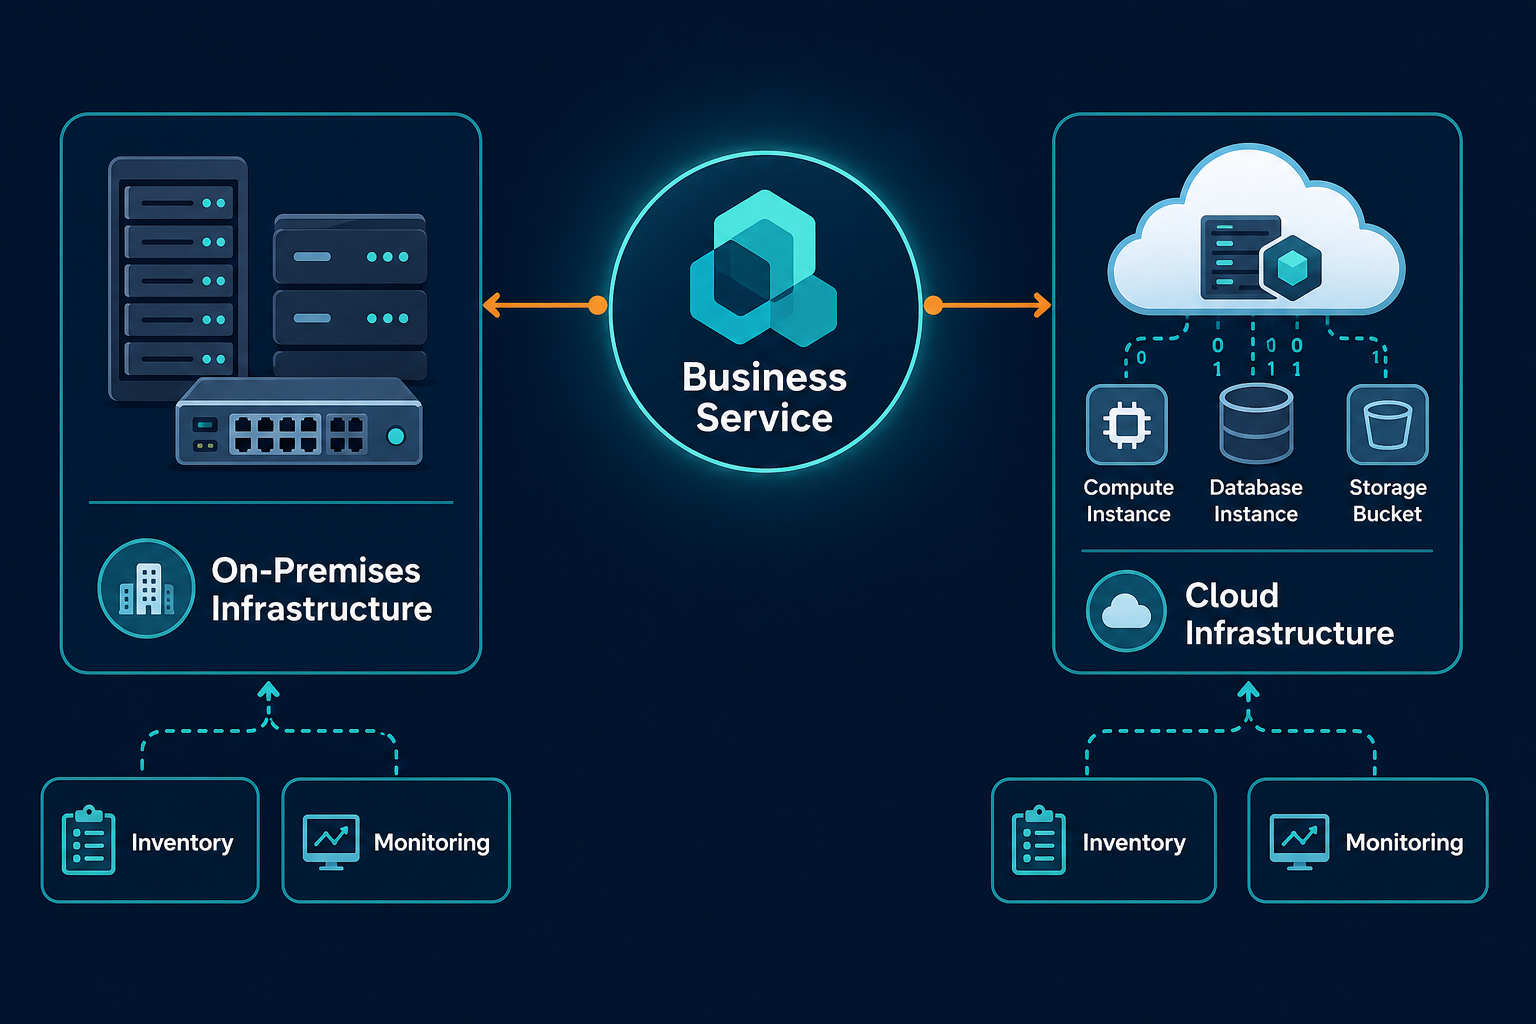
A hybrid infrastructure dashboard is only as complete as its discovery scope: on-premises discovery typically covers network devices, physical servers, and virtual machines, while cloud discovery depends on which accounts, regions, and permissions are configured. An asset outside that scope will not appear in inventory-based views, regardless of whether a separate monitoring tool still reports on it.
That coverage gap matters because multivendor hybrid and multicloud environments are already linked to slower fixes. A 2025 NETSCOUT survey of 319 IT professionals involved in problem resolution found that complexity across vendors, combined with no on-site staff at remote locations, drives resolution times higher.
Virima’s IT discovery supports AWS and Azure, plus virtual machine inventory across VMware and Hyper-V. Scheduled discovery cycles update discovered records according to the configured scope.
Records from multiple sources also need reliable matching. A cloud instance ID can identify an instance within its appropriate cloud scope. A hardware serial number can help identify a physical device. A hostname alone should not serve as the durable join key. Multi-Source CMDB Reconciliation: Why Last-Scan-Wins Destroys Data Quality
Review excluded networks, inaccessible accounts, and failed collection attempts with the teams responsible for each source.
What happens when two sources describe the same asset differently?
Conflicting asset attributes require a decision about which source supplies each value. For example, a discovery tool may supply hardware details while an inventory owner maintains business ownership. Review unresolved conflicts with the responsible teams before using those attributes for reporting or change assessment.
How does service context improve an infrastructure view?
Infrastructure teams need to understand which services depend on a component before prioritizing an incident. Those relationships also help reviewers examine possible effects before approving a change.
Virima’s ViVID™ service maps build dependency views after customers provide their service definitions. Definitions can be supplied manually, through spreadsheet import, or through supported service management integrations. The resulting map helps teams examine infrastructure associated with a defined service. Improve your incident response process with service mapping
Teams evaluating this capability without a platform replacement should note that Virima’s discovery, CMDB, and service mapping work alongside existing ITSM platforms rather than requiring a switch — a lighter-weight path to reconciled infrastructure data than consolidating onto a single enterprise suite, and one that keeps a neutral record for organizations running more than one ITSM tool.
Ask the vendor to show how a user moves from an infrastructure record to its dependencies. Then check who maintains the service definition and how the team reviews changes to it.
Can a service map establish that an application is healthy?
A service map shows recorded relationships between a defined service and its supporting components. Application health also depends on monitoring signals and thresholds suited to that application. Check whether the monitoring source covers the relevant components before using its status to assess the service.
Run a dashboard trust test before selecting a tool
Choose one business service and a small group of its supporting assets. Include an on-premises component and a cloud instance where possible. Ask the vendor to demonstrate these checks:
- Trace the record: Identify the source and most recent available collection time for each selected asset.
- Compare inventory: Check records against the relevant cloud account and on-premises inventory.
- Inspect a match: Show how the platform handles an asset observed by more than one source.
- Review the service: Show how selected assets relate to the customer-defined service.
- Follow an issue: Identify which monitoring or incident source supplies the health signal.
- Switch roles: Confirm what the director, operations manager, and engineer can view or change.
Assign an owner to each gap found during the demonstration. Record whether the gap needs a configuration change, a source correction, or a product decision.
Evaluate hybrid infrastructure visibility with your own data
A dashboard should help infrastructure leaders examine the records and operational signals behind a summary. Your evaluation should use the environments and business services your team manages.
Schedule an infrastructure demo and bring a sample business service — see what your infrastructure director, IT operations manager, service owner, and engineer would each see, using the same checks from the dashboard trust test above.
Frequently Asked Questions
What data should a hybrid infrastructure dashboard include?
A hybrid infrastructure dashboard should combine relevant asset records with operational signals for the environments being assessed. Service relationships and ownership information help teams interpret the potential business effect.
Why can a dashboard show healthy infrastructure when inventory is incomplete?
A health indicator reflects the assets and signals included in its calculation. Missing accounts or inaccessible networks can leave infrastructure outside that view.
How often should infrastructure dashboard data be refreshed?
Refresh requirements depend on the data source and the decision it supports. Inventory data from scheduled discovery cycles can reasonably refresh daily or weekly for most environments, while operational monitoring signals typically need near-real-time updates. Set a tighter interval for any asset involved in an active change.
Can Virima show infrastructure information for different roles?
Virima supports role-based operational dashboards and role-based access controls. Teams should validate the views and permissions required for their users during evaluation.
How does Virima connect infrastructure records to business services?
Customers provide service definitions, and Virima builds ViVID™ dependency maps from those inputs. Teams can examine relationships between defined services and supporting infrastructure.