ITOM in Continuous Deployment Environments: Monitoring Service Health and Change

Continuous deployment environments change production faster than most operational models update. A deployment introduces new services, changed dependencies, or configuration shifts. Monitoring detects the resulting degradation accurately. What it cannot supply on its own is the configuration and dependency context teams need to determine which change caused the problem and how far the impact extends.
That gap defines the ITOM challenge in continuous delivery. Detecting degradation is table stakes. The harder problem is placing that signal in current context, against the infrastructure, dependencies, and changes that existed when the symptom appeared.
Continuous Delivery Makes Production Intentionally Non-Static
Production in a continuous delivery organization is designed to change frequently. DORA’s software delivery research tracks deployment frequency as a throughput measure and change failure rate as a separate stability metric, because deployments themselves can generate the failures that require recovery. More deployments do not automatically mean fewer failures.
The production environment changes through code releases, infrastructure-as-code updates, container versions, autoscaling events, cloud resource allocation, and service configuration. Each change is intentional. Each change also modifies the system that operations is responsible for monitoring. Monitoring that does not account for those changes operates against a system it has not fully mapped.
More Telemetry Does Not Automatically Create More Context
A mature SaaS engineering organization may already collect logs, metrics, distributed traces, deployment notifications, Kubernetes telemetry, cloud monitoring data, and infrastructure alerts. Each source describes something real. The difficulty is connecting those signals into a coherent explanation.
The chain operations needs runs from signal to CI to dependency to service to recent change. A CPU metric identifies a host. It does not identify which service runs on that host, which other services depend on that host, or what changed on that host in the past hour. Telemetry volume does not build that chain automatically.
The Topology That Mattered Yesterday May Not Exist Today
Traditional operations often assumed relatively stable infrastructure relationships. Continuous deployment weakens that assumption systematically. A service can move hosts, scale horizontally across new instances, acquire a new dependency, change database endpoints, shift cloud regions, or alter its API routing between documentation updates.
The monitoring signal can remain current while the dependency model drifts into inaccuracy. An alert placed on an outdated map of service relationships identifies that something went wrong. It does not identify which component of a no-longer-accurate topology is responsible. Monitoring freshness and topology freshness are separate operational problems, and they degrade at different rates in continuous deployment environments.
Why does continuous deployment make ITOM harder than traditional monitoring?
Continuous deployment changes service configurations, dependencies, and infrastructure between monitoring cycles. Traditional monitoring detects degradation but relies on accurate topology context to explain it. When production changes faster than the operational model updates, teams can see that something broke without a reliable map of what changed and which services depend on it.
Deployment Events Should Become Part of Incident Context
When service health changes after a deployment, the deployment event is diagnostic context that operations needs alongside the monitoring data. DORA specifically tracks failed deployment recovery time as a performance metric because production deployments regularly generate failures that require immediate intervention. Recovery speed depends on how quickly teams can connect the symptom to the change.
A useful operational view for post-deployment incidents answers questions in sequence: What changed recently? Which CI changed? Which service contains that CI? Which dependencies surround it? Did alerts begin before or after the change? Which downstream services are affected? A recent change is diagnostic context, not proof of root cause. The distinction matters, but the context cannot appear in isolation from health data.
Service Health Should Be Understood Through Dependencies
A SaaS application may report increased latency while its own infrastructure appears healthy. The problem can sit in a database it queries, a network path it crosses, a DNS resolution it relies on, an authentication service it calls, a storage volume it writes to, or a microservice deeper in the call chain.
Service maps give monitoring data an operational structure. The question shifts from “which instance is unhealthy?” to “which component is unhealthy, what service relies on it, and what else shares that dependency?” That framing converts an individual alert into a service-impact question. It also tells the response team where to look next rather than requiring them to identify which downstream team owns the problem.
Explore Virima’s Trusted Runtime Truth to see how discovery-sourced operational context keeps pace with the environments your teams are continuously changing.
Fast Recovery Depends on Reconstructing the Current System Quickly
During incidents, engineering teams frequently need to reconstruct three overlapping datasets simultaneously: current topology, recent changes, and current symptoms. When those datasets live in separate tools with no shared context layer, diagnosis requires manual correlation under time pressure. Each engineer brings a partial view, and the team assembles the full picture through conversation rather than instrumentation.
DORA treats mean time to restore as a stability metric alongside change failure rate because recovery speed reflects operational readiness, not technical luck. A mature ITOM model reduces the reconstruction work by keeping topology, changes, and symptoms in closer proximity. The goal is not to eliminate engineering judgment. It is to give engineers a current system model to reason against instead of rebuilding one mid-incident.
Continuous Deployment Increases the Cost of Stale CMDB Data
A CMDB updated on a quarterly manual cycle may have served adequately when infrastructure changed quarterly. It becomes less useful when cloud instances provision and deprovision within hours, container relationships shift between deployments, application dependencies change with each release, and services gain and lose connectivity regularly.
The problem is not a lack of good CMDB practices. The update frequency of the operational model no longer matches the update frequency of production. Deployment velocity creates a minimum acceptable velocity for operational truth. A configuration record accurate before a major release can misrepresent service relationships for every investigation that follows it. Discovery running against production on a scheduled cycle can surface those changes without relying on manual update processes that cannot keep pace with continuous delivery cadences.
How does continuous deployment affect CMDB accuracy?
Continuous deployment introduces infrastructure changes, new dependencies, container shifts, and configuration changes between CMDB update cycles. A CMDB refreshed manually cannot match the pace of modern SaaS delivery. Discovery-sourced CMDB updates keep configuration and relationship records current by running scheduled discovery scans against the live environment rather than relying on human-initiated updates.
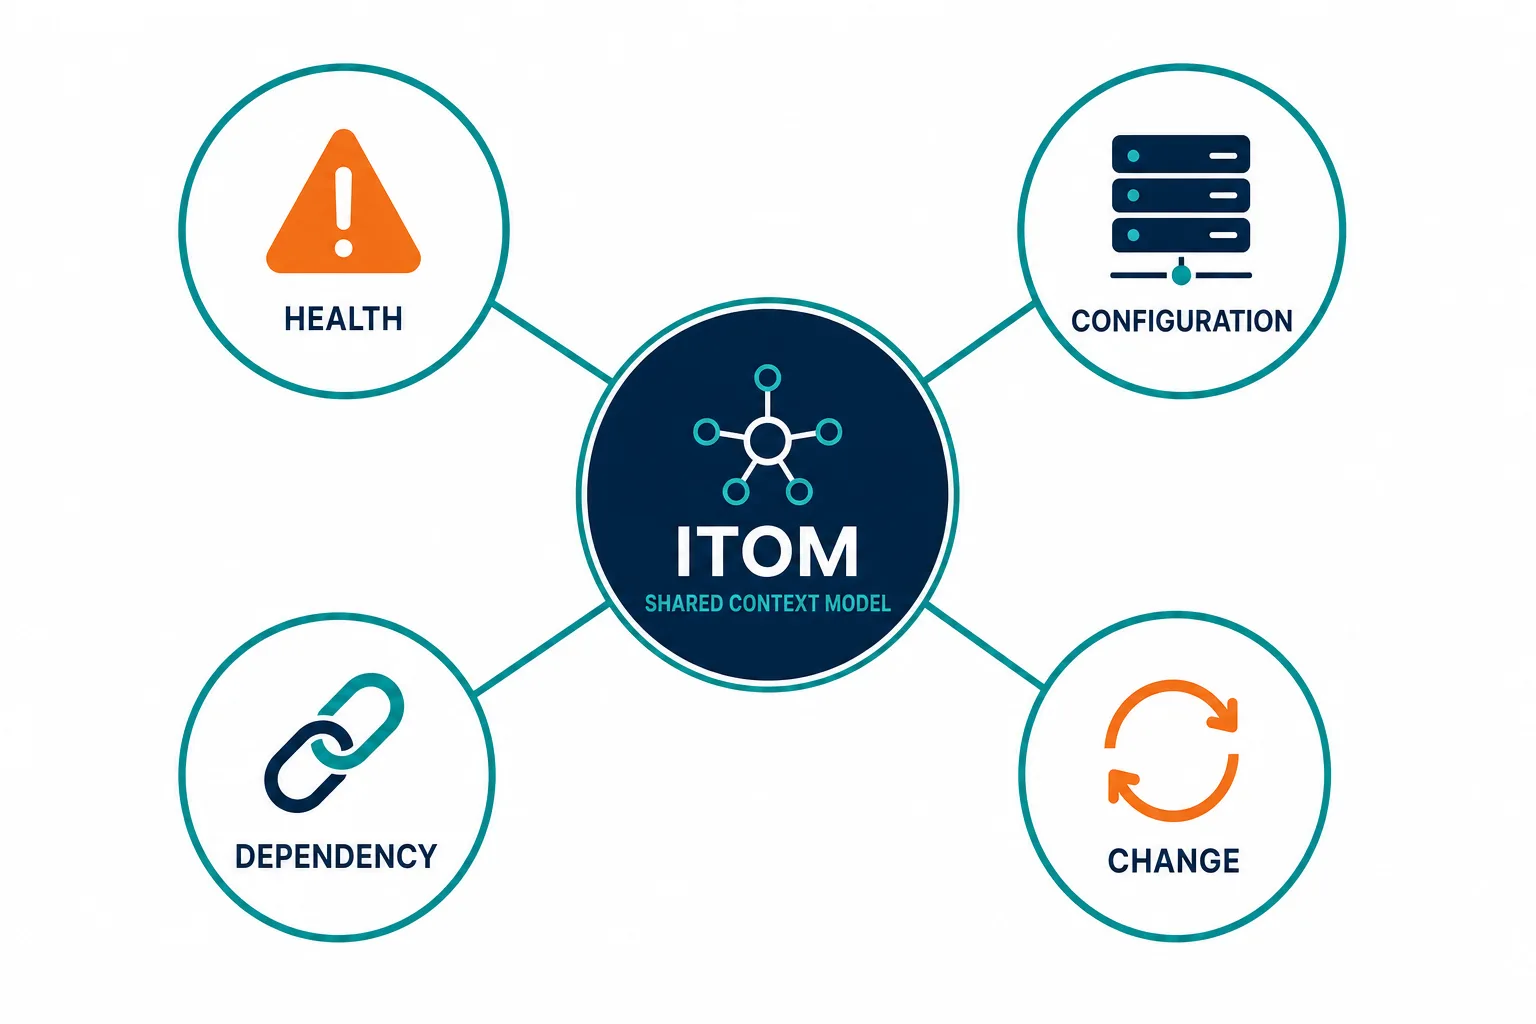
ITOM Should Connect Four Operational Views
No single operational view is sufficient on its own. Health signals without dependency context identify symptoms but not source. Dependency maps without current configuration become stale between deployments. Recent-change data without health signals lacks impact. Configuration records without service context are inventory.
| Operational view | What it explains | What it lacks alone |
|---|---|---|
| Health | Alerts, incidents, performance symptoms | No context for which CI or service is responsible |
| Configuration | What infrastructure currently exists | No indication of what depends on each CI |
| Dependency | What supports each application or service | Becomes stale as production changes |
| Change | What changed recently in production | No link to affected services or downstream symptoms |
ITOM connects those views. The goal is to make each piece of data interpretable through the others, so a health signal can be examined in the context of current configuration, current dependencies, and recent changes simultaneously.
Monitoring and ITOM Are Not the Same Thing
SaaS engineering teams typically already own monitoring platforms. Datadog, Dynatrace, New Relic, Prometheus, cloud-native monitoring tools, and LogicMonitor each produce health signals against infrastructure. Those platforms are not the gap ITOM addresses.
Monitoring platforms generate health signals. ITOM adds the configuration, dependency, and change context those signals need for diagnosis. An ITOM layer that integrates with existing monitoring platforms can ingest their alerts and place them alongside the CI, service, and change context those platforms do not maintain. The engineering team keeps its observability investment. The operations function gains the context layer that converts signals into service-impact explanations.
What is the difference between ITOM and monitoring for SaaS companies?
Monitoring platforms generate health signals: metrics, logs, traces, and alerts. ITOM (IT Operations Management) adds configuration records, service dependency maps, and recent-change context around those signals. For SaaS companies in continuous deployment, ITOM connects health data to the current infrastructure and service topology, enabling faster diagnosis without replacing existing monitoring tools.
A Practical Operating Model for Continuous Deployment
A practical ITOM sequence for continuous delivery environments follows this progression:
Discover → Map → Observe → Correlate → Assess → Update
Discover. Run scheduled discovery scans against production infrastructure to identify current configuration, instances, containers, software, and relationships.
Map. Connect infrastructure components into service dependency models based on discovered relationships and provided service definitions.
Observe. Ingest monitoring signals, alerts, incidents, and deployment notifications from existing tooling.
Correlate. Place current symptoms alongside recent configuration changes and service dependencies. Surface change events that preceded degradation.
Assess. Determine which services depend on the affected component and which teams should be engaged.
Update. Refresh discovery as production changes again through the next deployment cycle.
No discovery or correlation tool reconstructs root cause automatically. Engineering judgment remains central. The model reduces the manual reconstruction work that precedes that judgment.
Where Virima Fits in SaaS IT Operations
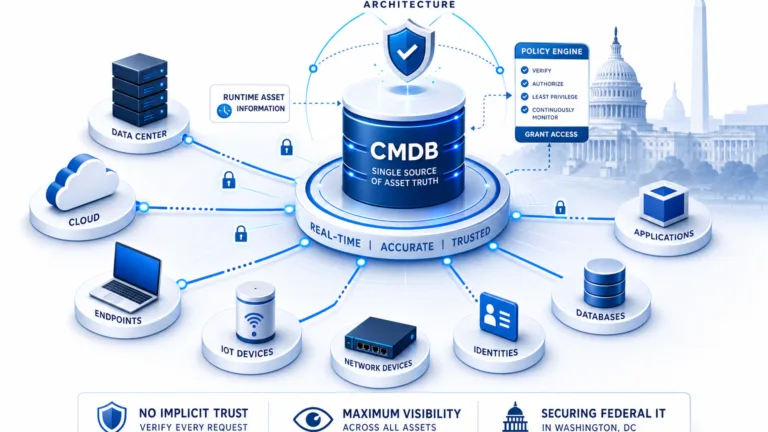
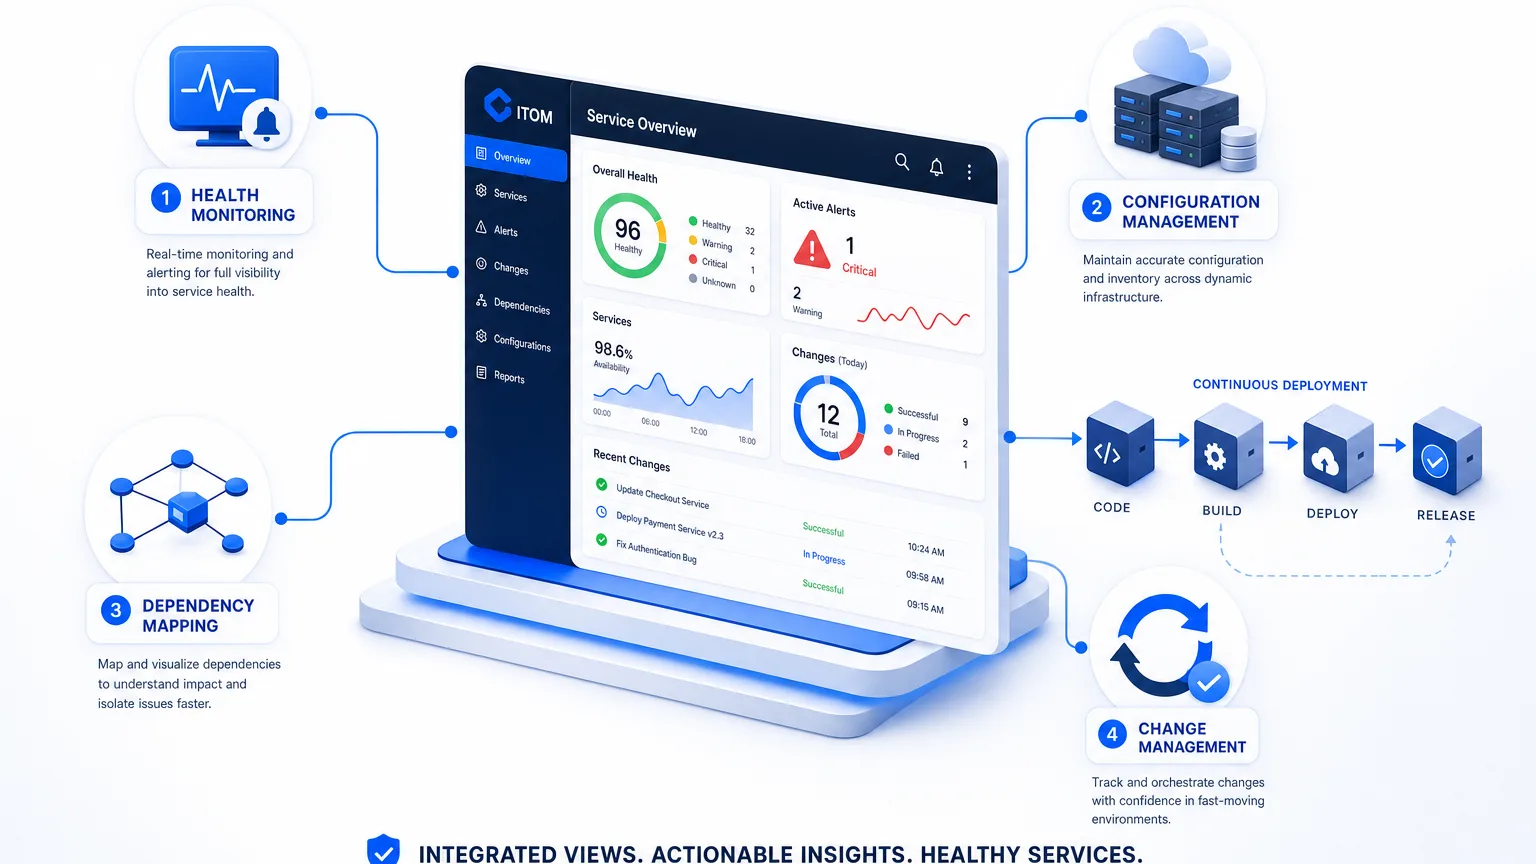
Technology and SaaS teams already operate monitoring, observability, and ITSM platforms. Virima’s ITOM function provides the runtime context layer that surrounds those platforms, combining discovery-sourced CMDB, service dependency mapping, CI change history, incident overlays, and alert integrations so that configuration, dependency, and change context stay connected as production evolves.
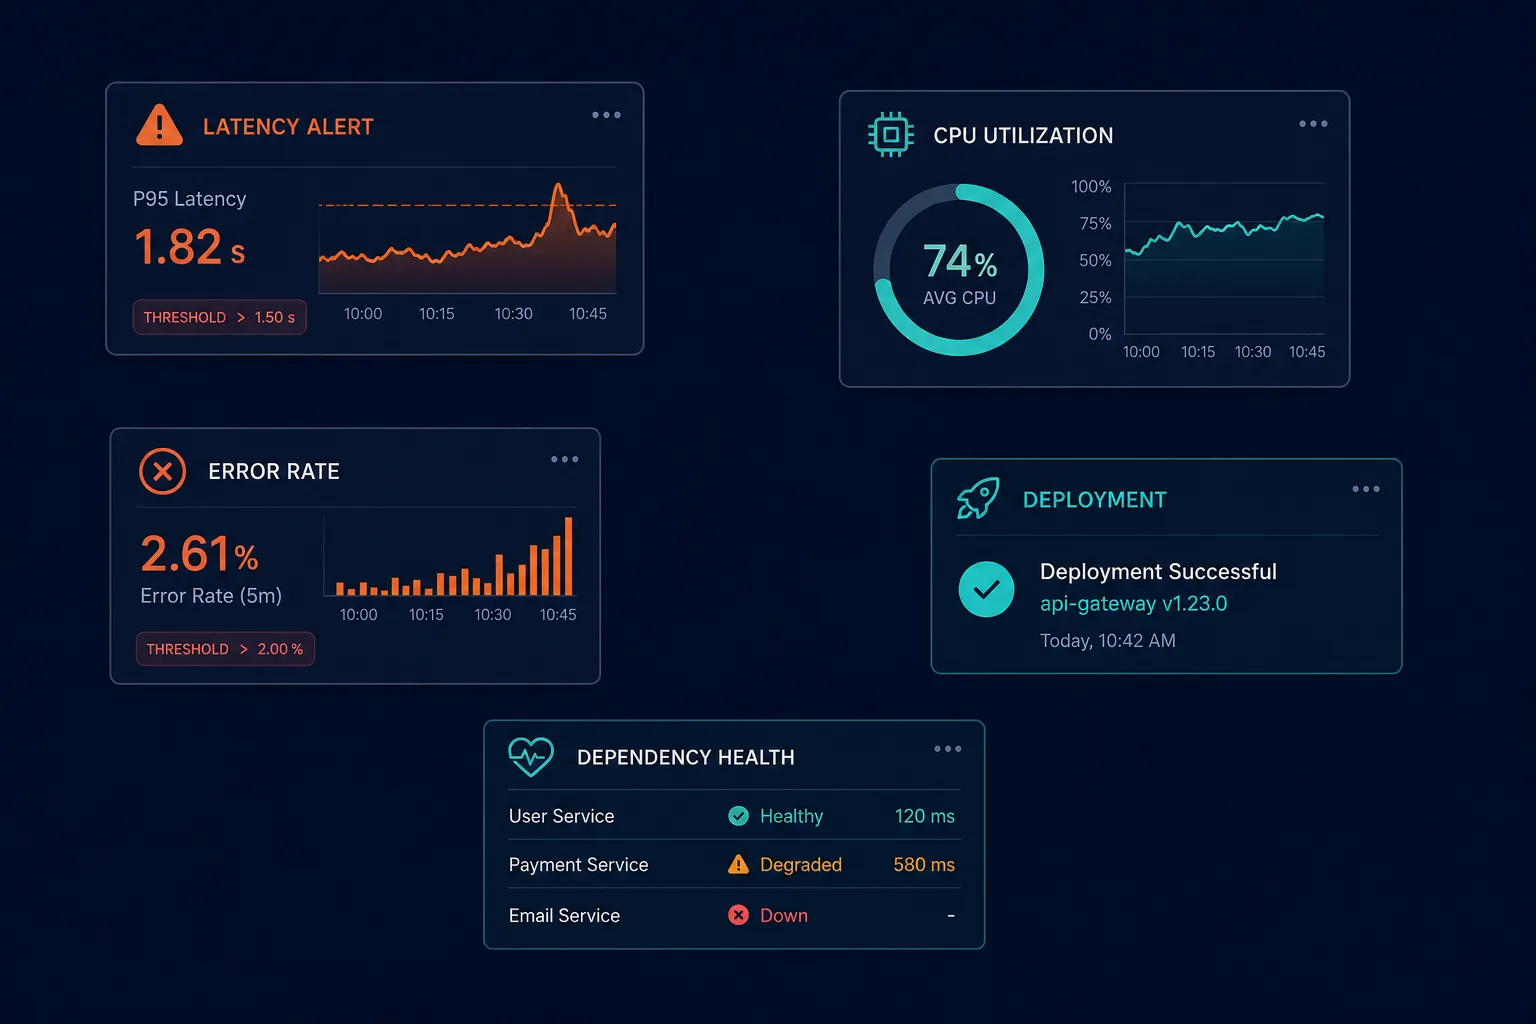
The gap Virima addresses is the one that appears when a SaaS incident demands answers monitoring alone cannot provide. A latency alert tells the team something degraded. It does not tell the team which CI changed before the alert fired, which service depends on that CI, which other services share the dependency, or what the system looked like during the last successful deployment. Virima keeps that context current through high-frequency discovery cycles and service mapping, so investigation begins with a current system model rather than a reconstruction exercise.
Capability alignment for continuous deployment environments:
- Rapid infrastructure change → scheduled discovery scans that update configuration records between deployments
- Changing service dependencies → dynamic service maps reflecting current dependency relationships
- Monitoring alerts → event and monitoring integrations placing alerts beside CI and service context
- Recent deployments or configuration changes → change overlays alongside health and dependency data
- Incident investigation → service-impact context identifying affected downstream services
- Existing ITSM stack → bi-directional ITSM integrations with ServiceNow, Jira Service Management, Ivanti, HaloITSM, Xurrent, and Hornbill
Boundary statement. Virima does not replace the monitoring or observability platforms SaaS teams use. Its role is to add current configuration, dependency, and change context around the signals those platforms generate.
Continuous deployment makes production change faster than static documentation can follow. Request a demo to see how Virima ITOM fits alongside your existing monitoring and ITSM platforms.
Frequently Asked Questions
Why does continuous deployment create operational context problems for IT teams?
Continuous deployment changes production infrastructure, dependencies, and service configurations faster than manual operational records can update. Monitoring platforms detect that something degraded, but diagnosis requires knowing what changed, which CI is involved, and which services depend on it. When the operational model does not reflect the current production environment, investigation begins with reconstruction instead of current context.
What does ITOM add that monitoring platforms do not already provide?
Monitoring platforms generate health signals including metrics, logs, traces, and alerts. ITOM adds the configuration records, service dependency maps, and recent-change context those signals need for diagnosis. An ITOM layer integrates with existing monitoring tools and places their alerts alongside current CI and service topology data rather than requiring those platforms to be replaced.
How do DORA metrics relate to IT operations management in continuous delivery?
DORA measures software delivery through deployment frequency and lead time as throughput metrics, and change failure rate alongside failed deployment recovery time as stability metrics. Recovery time is directly relevant to ITOM because it reflects how quickly operations can diagnose and resolve failures that deployments introduce. Operational context quality directly affects that recovery speed.
How often should a team run infrastructure discovery for its CMDB in a continuous deployment environment?
Discovery frequency should reflect deployment frequency. Organizations running multiple daily deployments that introduce new instances, containers, or dependencies benefit from high-frequency discovery cycles that can surface configuration changes between release events. Quarterly or monthly manual CMDB updates cannot match that pace, leaving teams with configuration records that describe a prior production state rather than the current one.
Does Virima replace Datadog, Dynatrace, or other monitoring platforms?
Virima does not replace monitoring or observability platforms. Its role is to provide the configuration, service dependency, and change context layer that surrounds the signals those platforms generate. Virima ITOM integrates with monitoring and event management systems to place their alerts alongside current CI and service topology data, supporting faster diagnosis without displacing existing tooling.