Unit-Cost Showback Breaks When Infrastructure Has No Business-Service Owner

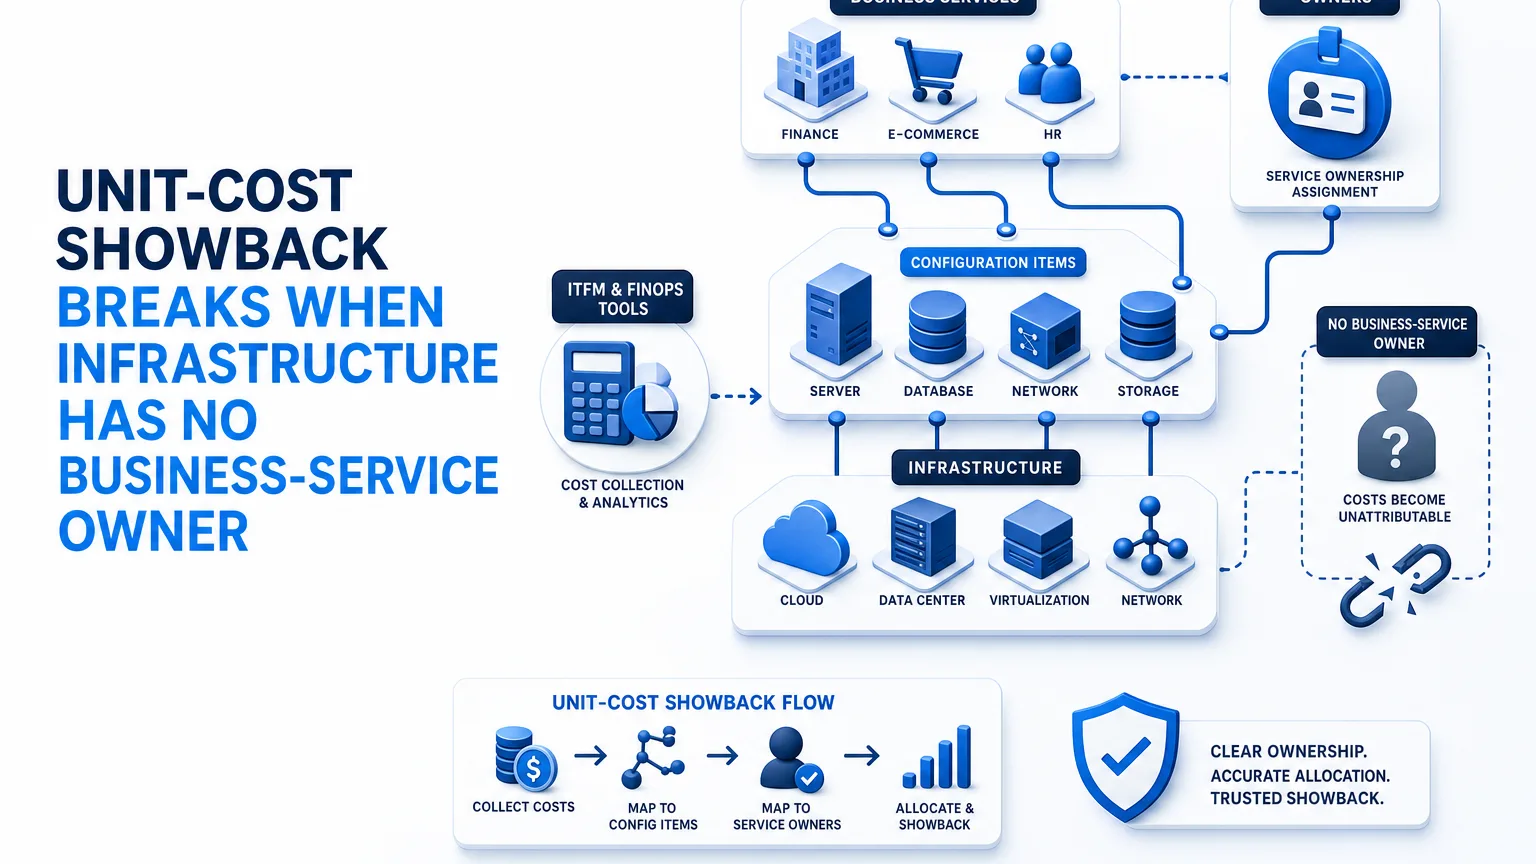
Finance publishes the quarterly showback pack. Three service owners reject the same shared-platform line. Finance defends the rate card and the invoice total. Ops says the cluster is multi-tenant, the owner field is wrong, and half the hosts in the model were retired last month.
Nobody is inventing numbers for sport. The spend is real. The dispute is about who consumed what, under which owned business service, on which infrastructure. Until that chain is solid, unit-cost showback stays a negotiation, not a report.
Chargeback and Showback Share One Mapping Problem
Showback makes cost visible to owners without always moving money. Chargeback bills cost back to a cost center or service. Both need the same foundation: a stable cost object (business service, product, or application) tied to the infrastructure that supports it.
Unit cost also needs a denominator finance and ops both accept: a named service, seats, transactions, or a defined CI set. A raw cloud invoice total is not enough. It tells you what was spent. It does not tell you which owned service should carry the line.
Rate design, markup, and GL posting live in IT financial management and FinOps tooling. Who the line belongs to is a service-ownership and mapping problem before it is a pricing problem.
From Spend to an Owned Service Line
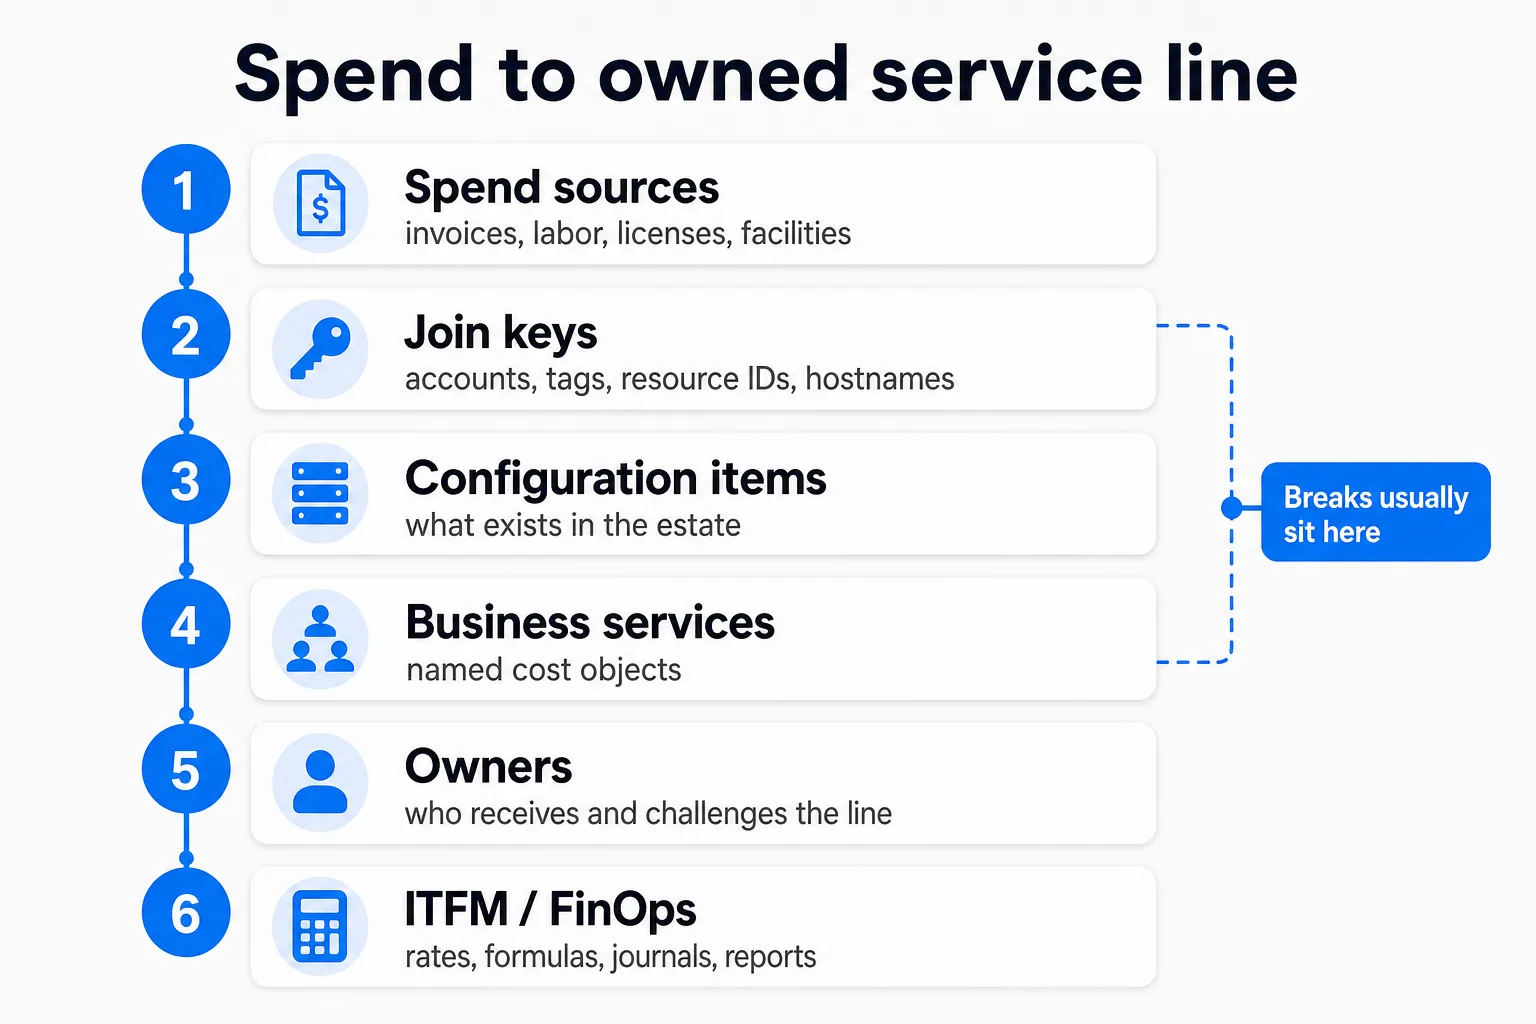
Allocation is a chain, not a single export.
Spend sources arrive as cloud and vendor invoices, labor, licenses, and facilities.
Join keys on those bills are accounts, subscriptions, resource IDs, tags, serials, and hostnames.
Configuration items are what exists in the estate.
Business services are the named cost objects the organization defines.
Owners are who receives the line and who can challenge it.
ITFM and FinOps systems then apply rates, allocation formulas, journals, and reports.
Breaks cluster between join keys and owned services. The spreadsheet math can be precise and still wrong if the join path is incomplete.
The FinOps Foundation’s allocation capability frames allocation as apportioning cost to those responsible for each component, including shared elements. Responsibility only sticks when the org can name the service, the owner, and the infrastructure behind the spend.
What Allocation Needs from the CMDB and Service Maps
These are cost mechanics, not a generic inventory checklist.
Cost object identity
Finance needs durable service and product names quarter over quarter. If the cost object renames every cycle, unit-cost trends stop meaning anything. The CMDB (with service definitions the org supplies) is where those names stabilize and stay consistent for reporting.
Consumption and share basis
Showback needs a basis for the split: which CIs sit under each service, and what share of a shared platform each service used. CI-to-service links and dependency maps answer who consumed what. Without that, shared platforms default into one central bucket.
Owner of record for the bill line
Contested showback is often an ownership fight. CI and service owner fields decide who receives the line, who can dispute it, and who acts on rightsizing. Empty or wrong owners produce rejected packs even when the dollar math is correct.
Tag and invoice join keys
Cloud bills and vendor invoices arrive on accounts, subscriptions, resource IDs, and tags. Those keys become service-level cost only when they join to CMDB configuration items, then to services. Discovery keeps the joinable estate current so last quarter’s tag scheme does not silently misroute spend.
Estate change versus rate-card change
Unit cost moves for two different reasons. Finance changed a rate, or the estate changed (new hosts, retired kit, service sprawl). CMDB lifecycle data and discovery explain estate-driven swings. That stops finance from “fixing” a rate when inventory drift is the real driver.
Shared-service and platform pools
Platform teams need pool definitions (shared data platform, common network, multi-tenant cluster) and a consumer list. Service maps name the consumers. ITFM holds the distribution formula and the rates. Maps without formulas leave politics. Formulas without maps leave averages.
ITFM systems hold catalogs, rates, journals, and chargeback policy. They inherit cost objects, joins, owners, and consumer lists from CMDB records, discovery, and service maps.
Why Shared Platforms Blow Up Unit Cost Without Dependency Context
Shared platforms are where showback trust dies first.
A Kubernetes cluster, shared database tier, network fabric, identity stack, or logging platform serves many services. Tags on individual resources help. They still leave gaps when the bill sits at the pool layer or when multi-tenant capacity cannot be tagged per consumer cleanly.
The FinOps work on managing shared cloud costs treats shared cost as a first-class allocation problem, with methods that depend on knowing what is shared and how to distribute it. Dependency context is what turns “shared” into a consumer list instead of a political average.
Service maps only help after business services are defined (manually, by import, or via enterprise-architecture input). Map building then connects those definitions to discovered infrastructure. Treating maps as a substitute for service definition produces diagrams finance cannot bill against.
Outcome to aim for: pool cost distributed to consuming services with a documented basis. Outcome to avoid: one “central IT” line that every owner rejects.
Why Finance and Ops Argue Past Each Other on the Same Invoice
Finance reads the invoice for accuracy, rate logic, and GL fit. Ops reads the same pack for “that host is not ours,” “that cluster is multi-tenant,” and “the owner field is stale.”
Both can be right on their own terms. They lack a shared, service-owned graph of the estate.
Common symptoms:
- Duplicate cost objects for the same service under different names
- Services renamed every quarter with no continuity key
- Orphan CIs still in the allocation model
- Retired kit still absorbing cost
- Platform pools with no consumer list, only a lump sum
Fixing the meeting culture does not fix missing joins and owners. Fixing joins and owners changes what the meeting is about.
Build the Allocation Base Before the Rate Card
Work the cost base in this order.
- Name and freeze business services the org will use as cost objects.
- Discover and reconcile configuration items into the CMDB.
- Bind join keys (tags, account IDs, resource IDs, serials) to those CIs.
- Assign service owners and platform-pool owners.
- Map dependencies so shared pools have a consumer list.
- Hand cost objects, CI sets, and owners into ITFM or FinOps tooling.
- Then set rates, showback cadence, and chargeback policy.
Precise rates on a broken join path still produce precise wrong bills.
What Bad Mapping Costs the Finance Calendar
Weak ownership and join data show up on the calendar, not only in a slide deck.
- Mid-quarter restatements and side spreadsheets next to the “official” pack
- Unowned platform cost stuck in central IT
- Unit economics that cannot support build-versus-buy or rightsizing debates
- Service owners who stop opening showback packs because every cycle is a fight
Each cycle spent re-arguing ownership is a cycle not spent on rate design or waste reduction.
Discovery-Sourced CMDB and Service Maps as the Allocation Base
Allocation improves when the estate that carries cost stays aligned to what is running, who owns it, and which services it supports.
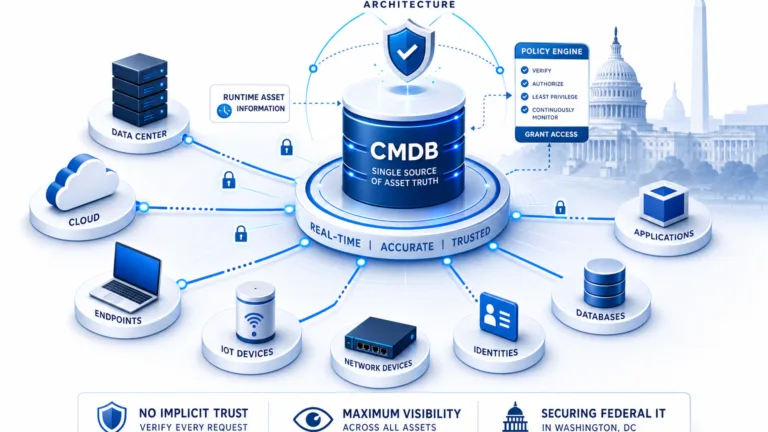
Virima supplies discovery-sourced configuration data into the CMDB layer: agent and agentless discovery, cloud and network coverage, CI relationships, ownership and lifecycle fields, and service maps once service definitions are provided.
For chargeback and showback programs, that data supports the allocation base in concrete ways:
- Joinable CI inventory so invoice and tag keys can attach to real systems
- Owner and lifecycle fields so bill lines and decommissioned kit stay honest
- Dependency context so shared pools have consumers, not only a lump sum
- Stable cost-object hooks once services are named and mapped
- Integration paths into common ITSM and CMDB platforms (ServiceNow, Jira Service Management, Ivanti, HaloITSM, Xurrent, and Hornbill) so the same inventory can feed operational workflows. Full list: Virima integrations
Discovery runs on a schedule. It is not continuous event-stream cost sync. Asset financial fields can carry cost and lifecycle attributes that finance models use as inputs. Rates, journals, showback packs, and chargeback policy still run in ITFM and FinOps systems that consume the service and CI graph.
When disputed lines keep tracing to missing owners, broken tags, or unmapped shared platforms, the gap sits in how the allocation base is built and maintained.
When you want that base tied to discovery rather than annual spreadsheet rebuilds, request a demo.
What Improves When the Allocation Base Is Solid
Teams that stabilize cost objects, joins, owners, and pool consumers typically see:
- Fewer disputed showback lines
- Faster agreement on shared-platform splits
- Unit costs that move with estate reality, not only with rate edits
- Cleaner handoffs among finance, platform teams, and service owners
The win is fewer restatements and clearer unit economics, not a claim that pricing automation is finished.
Put Owned Services and Join Keys Before Showback Math
Unit-cost showback and chargeback only hold when spend can join to owned business services and the infrastructure behind them. Freeze service names. Discover and reconcile CIs. Bind invoice and tag keys. Assign owners. Map shared pools to consumers. Then apply rates and publish showback in ITFM.
Ready to ground service-owned cost objects in discovery-sourced CMDB data? See Trusted Runtime Truth or book a demo.
Frequently Asked Questions
Why do IT showback reports get disputed even when the invoice is correct?
Invoice totals can be accurate while ownership and consumption mapping are wrong. Service owners reject lines when hosts are mis-tagged, pools have no consumer list, or owner fields are empty. The fight is usually the join path to an owned business service, not the vendor bill amount.
What data does chargeback need beyond cloud billing tags?
Tags and account IDs are join keys. Chargeback also needs durable cost objects (named services), configuration items those keys attach to, owners of record, and dependency context for shared platforms. Without that graph, tags still leave multi-tenant and untagged pool cost in a central bucket.
How do service maps support shared infrastructure cost allocation?
After business services are defined, service maps show which services consume a shared platform, database, or network pool. That consumer list is what allocation formulas distribute against. Maps without service definitions, or formulas without consumers, both fail in different ways.
How does discovery support IT financial management workflows?
Discovery refreshes the configuration items that invoice and tag keys must join to. It also surfaces estate change (new and retired systems) so unit-cost swings are not blamed only on rate cards. ITFM still owns rates and journals; discovery feeds the inventory those models allocate against.
How do teams use Virima CMDB and service map data in showback programs?
Teams use discovery-sourced CIs, owners, relationships, and service maps (after service definitions exist) as the allocation base: join keys, cost objects, and shared-pool consumers. That graph is handed to ITFM or FinOps tools that apply rates and publish showback or chargeback.