Application Dependency Mapping in Excel vs. Discovery-Driven Mapping: What IT Teams Need to Know
| What is application dependency mapping in Excel? Application dependency mapping in Excel means manually documenting how applications, servers, databases, and services connect to each other in a spreadsheet. Teams list systems, IP addresses, and connection types in rows and columns. The result is a static snapshot that reflects your environment at the time it was written, not its current state. |
What Is Application Dependency Mapping in Excel?
Application dependency mapping in Excel means documenting every application, server, database, and service relationship in a spreadsheet. You list dependencies row by row, columns for system names, IPs, and connection types. It gives your team a picture of what connects to what, at the moment you wrote it down.
Here is how a typical Excel-based process works:
- Identify your applications and their dependencies, such as databases, servers, and services
- Create a table with columns like Application Name, Dependency, Connection Type, and Owner
- Map the connections using a matrix or additional columns to show how each application links to others
- Build simple diagrams using Excel shapes or a linked tool
- Return periodically to update the spreadsheet as systems change
What Excel Does Well for Dependency Mapping
Excel earns its place in small IT environments because it removes barriers. Here are the main advantages:
- Cost: Excel is part of the Microsoft 365 license most organizations already hold. No additional tool to procure.
- Familiarity: Most IT professionals know how to use it. Training is minimal, and teams can start mapping on day one.
- Flexibility: You can build any column structure you need. Teams can create a custom layout that fits their specific environment without vendor constraints.
- Shareability: Cloud-hosted Excel files on OneDrive or SharePoint let multiple team members view and edit the same file. Coordination is straightforward in small teams.
For organizations with fewer than 50 applications and stable infrastructure, Excel gives you a workable start.
| When does Excel-based dependency mapping fail? Excel-based application dependency mapping fails when your environment grows faster than your team can update the spreadsheet. Manual entry does not catch new dependencies automatically. Shadow IT adds systems that no one documents. Changes happen between update cycles. The result is a map that looks complete but describes an environment that no longer exists. |
Where Excel-Based Dependency Mapping Breaks Down
Excel’s core problem is that it captures a moment in time. IT environments change constantly. Here is where the cracks appear:
- Manual entry at scale: Every new server, application, or cloud resource requires a manual update. In large or fast-moving environments, that burden becomes unsustainable.
- No discovery capability: Excel cannot detect new dependencies. If someone spins up a workload or connects a new service, the spreadsheet does not know. Your map drifts from reality without warning.
- Scalability limits: Beyond a few hundred dependencies, Excel becomes difficult to navigate and nearly impossible to maintain accurately. Cross-referencing hundreds of rows for a change impact analysis takes hours.
- No live service view: When an incident fires, your team needs to know what is affected right now. A spreadsheet that was last updated three weeks ago cannot answer that question reliably.
- No integration: Excel stays in a file. It does not push relationship data to your ITSM platform, so incident and change management teams work from two different pictures of the same environment.
When to Move Away from Excel-Based Dependency Mapping
There is no single trigger point, but these signals tell you the spreadsheet has reached its limit:
- Growing IT complexity: Your application count has grown beyond what one or two people can track manually. Mistakes in the map now cause problems in incident response and change approval.
- Frequent errors or delays: Your team spends time reconciling the spreadsheet with reality before every change window. That reconciliation effort is the cost of a stale map.
- Missed dependencies: An incident reveals a dependency no one had documented. The postmortem identifies the spreadsheet as the gap.
- Pressure on change management: Your change advisory board is asking for dependency evidence before approvals, and Excel cannot produce it reliably.
- Audit or compliance requirements: Your organization needs to show accurate, traceable records of service dependencies. A manually maintained spreadsheet does not meet that bar.
| How does discovery-driven dependency mapping differ from Excel? Discovery-driven mapping collects relationship data directly from your infrastructure through scheduled scans. Instead of a person documenting each connection, the tool interrogates devices and services and builds the dependency map from what it finds. The map stays accurate as long as discovery runs, without manual update cycles. |
How Virima Replaces Excel for Application Dependency Mapping
Virima replaces the manual spreadsheet process with discovery-driven mapping. Instead of someone entering relationships row by row, Virima’s IT discovery interrogates your infrastructure through high-frequency discovery cycles. The result is a dependency map built from what your environment actually contains, not what someone remembered to write down.
High-Frequency Discovery Cycles, Not Manual Updates
Virima’s discovery engine runs on a schedule your team configures. Each cycle scans devices, applications, servers, and cloud resources, then records the relationships it finds in your CMDB. When something changes, the next discovery cycle captures it. You do not wait for someone to update a spreadsheet. You wait for the next scan.
This approach removes the two biggest risks in Excel-based mapping: human forgetting and change velocity outpacing documentation.
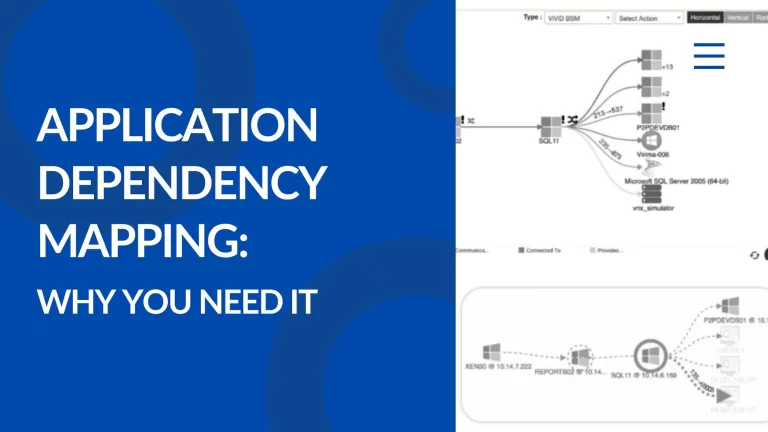
ViVID Service Maps: Visualize the Relationships
Virima’s ViVID service mapping layer converts the relationship data in your CMDB into interactive, filterable topology maps. Where Excel gives you a grid of rows, ViVID gives you a visual layout of how services depend on each other. You can see at a glance which applications share a database, which servers sit upstream of a business-critical service, and what the blast radius of a change looks like before you approve it.
ViVID service maps do not auto-discover the definition of each service. Your team provides or imports the service definitions, and Virima builds the dependency map from those inputs, combined with what discovery finds. This keeps the maps accurate and tied to your actual service model.
| See how discovery-driven dependency mapping works in your environment. Schedule a demo to explore ViVID service maps and Virima’s IT discovery capabilities. |
Change and Incident Management with Accurate Maps
When your team integrates Virima with your ITSM platform, dependency data flows directly into change management and incident response workflows. Change approvers see affected services before a ticket is approved. Incident teams see the topology of the affected system without navigating rows in a spreadsheet.
Virima integrates bidirectionally with the main ITSM platforms, including ServiceNow, Ivanti, Halo, Xurrent, and Jira Service Management. Relationship data flows in both directions, so the CMDB and the ITSM tool stay aligned.
Resource Visibility Across On-Premises and Cloud
Excel becomes especially difficult to maintain in hybrid environments where workloads move between on-premises systems, AWS, and Azure. Virima’s discovery covers on-premises infrastructure and AWS and Azure resources through API-based discovery. The dependency map reflects your full environment, not just the portion someone documented in a spreadsheet.
Excel vs. Discovery-Driven Mapping: Side-by-Side
Here is how the two approaches compare on the capabilities that matter most:
| Capability | Excel | Discovery-Driven Mapping (Virima) |
| Dependency data source | Manual entry — someone must collect it | Discovery scans pull relationship data directly from devices and services |
| Map accuracy over time | Degrades as teams miss updates | Stays current through high-frequency discovery cycles |
| Scale | Breaks down beyond a few hundred dependencies | Handles enterprise-scale environments across on-premises, cloud, and hybrid |
| Change impact analysis | Requires manual cross-referencing of rows | ViVID service maps show blast radius and affected services visually |
| Incident support | No live view — outdated by the time an incident fires | Maps reflect the current state, so teams can trace the root cause faster |
| ITSM integration | None — data stays in a file | Bidirectional sync with ServiceNow, Ivanti, Halo, Xurrent, and Jira Service Management |
| Effort to maintain | High — every change needs a manual update | Low — discovery cycles handle relationship refresh automatically |
| Audit readiness | Difficult to prove accuracy or recency | Discovery-sourced data is traceable to its source at collection time |
| Is application dependency mapping in Excel ever appropriate? Yes. Excel is a reasonable starting point for small environments with stable infrastructure and fewer than 50 applications. It becomes inappropriate when your change velocity outpaces your documentation cycles, when shadow IT introduces undocumented dependencies, or when your team needs to provide accurate impact analysis for change approvals. |
Five Business Benefits of Moving to Discovery-Driven Mapping
Application dependency mapping that runs on discovery cycles rather than spreadsheets delivers measurable operational improvements:
- Faster incident resolution: Teams trace the root cause through a visual map instead of cross-referencing spreadsheet rows during a live outage.
- More confident change approvals: Change approvers see affected services and potential blast radius before a change fires, not after.
- Reduced CMDB drift: High-frequency discovery cycles keep relationship data current without manual update effort.
- Better audit evidence: Discovery-sourced data is traceable to its collection point. You can show auditors when each relationship was confirmed and how.
Proactive risk management: Virima surfaces dependency risks before they cause outages. Learn more in our guide to the 5 key business benefits of IT service mapping.
| What should you look for when moving beyond Excel for dependency mapping? Look for a tool that discovers relationships directly from your infrastructure rather than relying on manual input, builds visual service maps that connect to your ITSM platform, covers your full environment including on-premises and cloud, and scales without requiring a dedicated team to maintain the data. |
Discovery-Driven Mapping Delivers What Excel Cannot Scale To
Application dependency mapping in Excel works as a starting point. It does not work as a long-term practice in environments that change, grow, or carry compliance requirements. When your team is spending more time reconciling the spreadsheet than acting on the information in it, the spreadsheet has become the problem.
Virima replaces that manual cycle with discovery-driven mapping and ViVID service maps that reflect what your environment actually contains. Your change approvals get better data. Your incident response gets a live topology view. And your team stops maintaining a spreadsheet that is always slightly behind.
| Ready to replace Excel-based dependency mapping with discovery-driven service maps? Schedule a demo and see how Virima keeps your CMDB and service maps accurate. |
Frequently Asked Questions
What are the main limitations of application dependency mapping in Excel for enterprise environments?
Excel cannot discover dependencies automatically, scale to hundreds or thousands of application relationships, or update in response to infrastructure changes. In enterprise environments, these limitations mean the map drifts from reality quickly. Teams end up maintaining two pictures of their environment: the spreadsheet and the actual state of the infrastructure.
How often should dependency maps be updated?
Map accuracy depends on how fast your environment changes. For most IT environments, discovery cycles every few hours to once daily strike the right balance between accuracy and resource use. Manually maintained Excel maps typically fall behind within days of a significant infrastructure change.
Does Virima require manual dependency entry to build its maps?
Virima’s discovery engine collects relationship data directly from your devices and services through high-frequency discovery cycles. Service definitions, meaning which applications make up a given service, are provided by your team or imported from a source like Lean IX. Virima then builds the dependency map from those definitions, combined with what discovery finds.
What ITSM platforms does Virima integrate with for dependency mapping?
Virima integrates bidirectionally with ServiceNow, Ivanti, Halo, Xurrent, and Jira Service Management. Dependency data flows from the CMDB into your ITSM platform, so change and incident management workflows have accurate relationship data without requiring a separate import step.
Is discovery-driven mapping suitable for hybrid IT environments?
Yes. Virima’s discovery covers on-premises infrastructure alongside AWS and Azure resources through API-based discovery. The resulting service maps reflect your full hybrid environment, which Excel-based mapping cannot do without significant manual effort.