Audit-Ready Asset Management Dashboards With Continuous Discovery
At 9:12 a.m., you get an audit email. It asks for proof that your asset list is current. In regulated environments, this isn’t paperwork theater.
IBM reports the average cost of a data breach reached $ 4.88M in 2024, so “unknown assets” quickly becomes a business-risk problem. You open your dashboard, and everything looks green.
However, you click into the details. A “current” laptop has not checked in for 47 days. A “retired” server is still online.
Some devices have no owner listed. Meanwhile, a SaaS renewal is next week, and no one can prove real use. That’s how waste sneaks in Zylo’s SaaS Management Index reports organizations waste $18M annually on unused licenses on average.
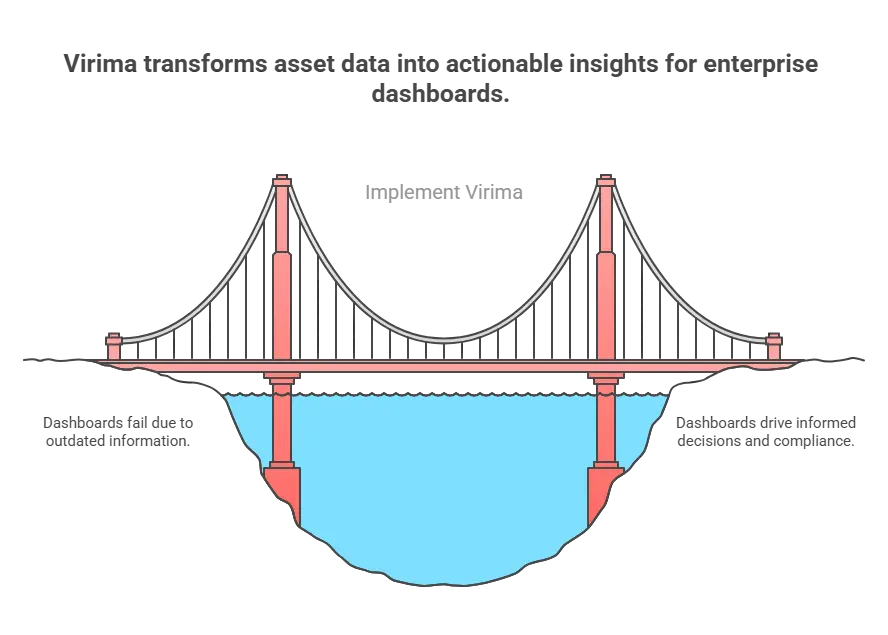
So, you learn a key lesson. Dashboards do not fail because they lack charts. Instead, they fail when the data gets stale, especially when your asset management dashboard depends on manual updates. When you rely on exports and spreadsheets, mistakes grow fast.
That is why a Virima-first approach matters. It keeps discovery running and data accurate. As a result, your asset management dashboard shows what is truly in your environment in near real time.
In this blog, we’ll cover:
| What an asset management dashboard should include Real example dashboards you can copy Platforms and tools you can use to build dashboards How to customize dashboards for specific assets (medical devices, OT/IoT, cloud VMs, etc.) Plus a separate section: “How Virima fits into an enterprise dashboard strategy. |
What is an asset management dashboard, and why does it matter in audit season?
An asset management dashboard gives you a clear view of your assets in one place. It pulls data about hardware, software, SaaS, and cloud assets from connected data sources.
Then it shows simple KPIs and details you can click into. This helps you spot issues faster and stay in control.
With a dashboard, you can monitor:
- Asset status and ownership
- Lifecycle and refresh risk
- License posture and renewal exposure
- Compliance and security exceptions
The value isn’t the charts. The value is that dashboards help you answer high-stakes questions fast—especially when risk and cost are real (IBM’s 2024 breach analysis covered 604 organizations globally, so the stakes aren’t theoretical).
- “Show me all devices not scanned in 30 days.”
- “Which endpoints are out of policy for encryption or patching?”
- “Where are we overspending on unused licenses?”
- “Do we have proof that our CMDB is current?”
And that is why discovery matters so much. You cannot rely on manual imports to keep your CMDB current. Updates done by hand often fall behind very fast. Because of this, gaps appear without warning.
Virima makes this point very clear. It uses continuous scanning to find new assets as they appear. It also tracks changes as they happen. As a result, your CMDB software stays accurate and ready to trust.
What should an effective IT asset dashboard include?
A good dashboard is not one page with everything. Instead, it shows what each person needs to see. It starts with the decisions you must make every day. Then it gives you only the data that supports those decisions.
Because of role-based views, nothing feels crowded or confusing. Each stakeholder gets clear and useful insight. As a result, you act faster and with more confidence.
1) Inventory coverage and composition
You should see, at a glance, in your asset management dashboard:
- Total asset counts by type (laptops, servers, VMs, network, SaaS)
- Assets by location/business unit
- Ownership coverage (% assigned to user/department)
- “Last seen” health (assets not scanned recently)
If you need ideas for chart designs, you can look at Atlassian for inspiration. They show clear and simple examples. For instance, donut charts display total hardware by type. Other charts break down hardware by status.
These patterns make data easy to read. They also help you spot trends fast. As a result, you understand your assets without extra effort.
2) Lifecycle and refresh risk
Your dashboard should highlight:
- Age bands (0–2 yrs, 2–4 yrs, 4+ yrs)
- Warranty/lease expirations within 60/90 days
- End-of-life / end-of-support exposure
- Repair and spare pools
3) Compliance and security exception visibility (the enterprise differentiator)
For regulated environments, the asset management dashboard must show:
- Exceptions by policy (e.g., encryption required, patch SLA required)
- Devices not scanned recently (visibility gaps)
- Unauthorized or risky configurations (where you track baselines)
- Audit-evidence readiness: timestamps and traceability
4) Software, SaaS, and licensing risk
You want:
- Purchased vs. used licenses (because research cited by CFO Dive found companies use about half of the SaaS licenses they purchase, on average)
- Renewals coming up (and actual usage trends)
- Unused licenses by department/cost center
- Compliance exposure indicators
5) Spend and chargeback views
Finance-aligned metrics:
- Spend composition (hardware vs software)
- Spend by department
- Assets by cost center
Atlassian even includes “IT Cost Management” example charts, like spend composition and spend over time.
Asset management dashboard examples you can copy (with KPIs)
Below are practical examples built for real enterprise needs. They focus on what you deal with every day. This includes hybrid visibility across environments. It also covers configuration accuracy, audit readiness, and lower risk.
These are the areas Virima customers care about most. They help you stay in control and avoid surprises. As a result, you can make smarter and safer decisions.
Example 1: Hardware fleet control dashboard (IT Ops)
Purpose: Stop “missing device” surprises and improve lifecycle planning.
Widgets to include:
- Total devices by type (donut)
- Device status distribution: active/spare/in repair/retired
- Devices “not seen in 14/30 days” + owner
- Warranty/lease expiration list (next 90 days)
- Oldest device models + refresh candidates
- Location heatmap (site/country)
Why this works: It turns your inventory into action. You spot visibility gaps before they grow. You reduce support risk early. And you plan asset refresh with confidence.
Example 2: Audit readiness & compliance dashboard (security + GRC + ITAM)
Purpose: Make audits predictable.
Widgets to include:
- “Inventory freshness” (how many assets were scanned in the last X days)
- Exceptions by policy (encryption, EDR, patch SLA, etc.)
- “Unowned assets” (no assigned business owner)
- “High-risk configuration drift” list (for whatever baselines you track)
- Evidence view: exportable report widgets + timestamps
Why this works: Auditors do not want slides. They want proof you can trust. So, your dashboard becomes your control center. It helps you show clear evidence, fast.
Example 3: Software & SaaS optimization dashboard (ITAM + finance)
Purpose: Reduce waste and manage renewal risk.
Widgets to include:
- Top SaaS apps by spend
- Utilization % vs purchased
- Unused licenses by department
- Renewals in the next 60/90 days with the owner & action
- Exceptions: unapproved tools / duplicate apps
Why this works: It turns “we think we’re overspending” into “here’s exactly where.”
Example 4: Cloud & virtual asset visibility dashboard (hybrid IT reality)
Purpose: Stop orphaned resources and unknown ownership costs.
Widgets:
- Cloud resources by account/subscription/project
- Tagging/owner coverage %
- Orphaned resources list
- High-cost resources with a missing owner
- Lifecycle: Resources running past the intended window
How to choose your asset dashboard platform
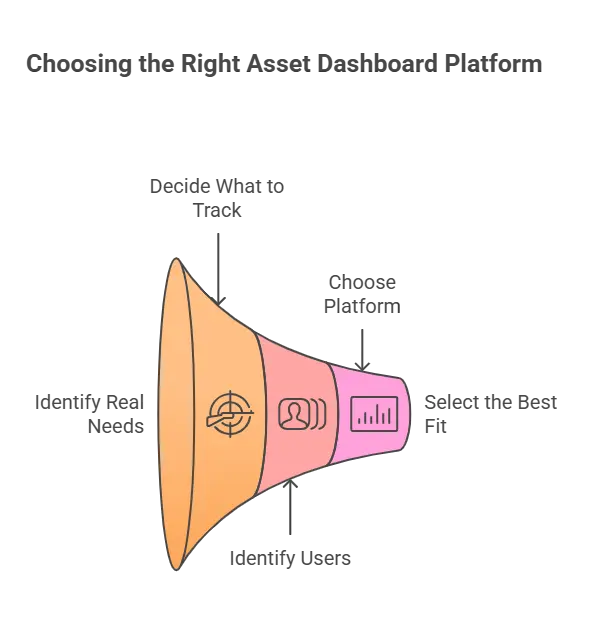
Not every dashboard platform solves the same problem. So, you should start with your real needs. First, decide what you want to track.
Next, think about who will use the data. Then, choose a dashboard that supports those goals.
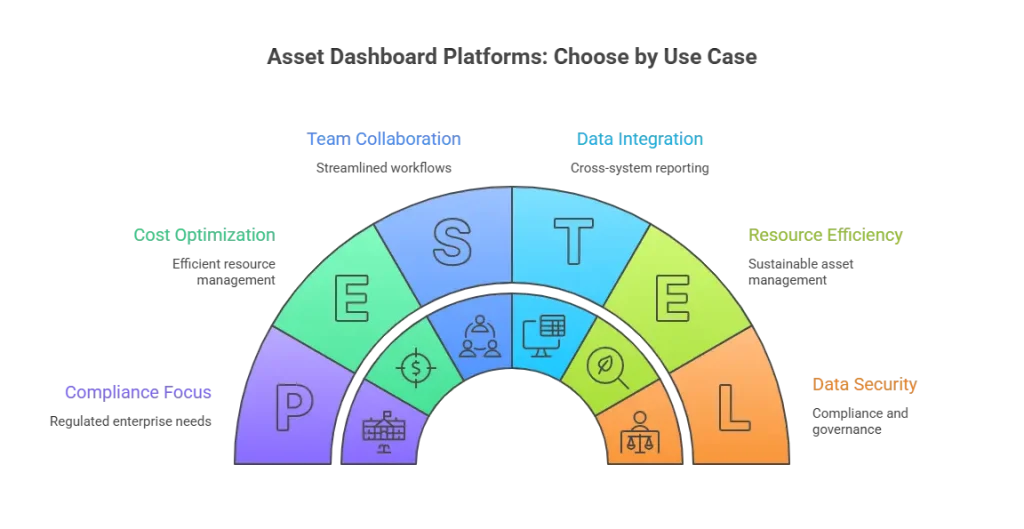
- If you only need visualization: Choose a BI tool (Power BI/Tableau) once your asset data is already clean and consistent.
- If you need visibility + continuous discovery: Choose an ITAM platform with built-in discovery and lifecycle controls.
- If you need audit-ready reporting: Prioritize platforms that support evidence, traceability, ownership, and compliance views, not just charts.
Then, map your needs to the tool categories below. This step keeps your choice simple. It also helps you avoid tools you do not need. As a result, you pick a solution that fits your goals.
Platform A: ITAM platforms with built-in dashboards (best for regulated enterprise)
This is the best fit when you need:
- Discovery and continuous updates
- Lifecycle and ownership controls
- Compliance/audit reporting
- Dashboards that reflect operational reality
Virima fits this model very well. In fact, it focuses on IT asset management tools with strong discovery and accurate configuration data. As a result, you get flexible discovery options that work across your environment.
In addition, Virima highlights agentless discovery and scheduled rescans. Because of this, your data stays fresh, trusted, and ready to use.
Other tools in this bucket:
- ServiceNow HAM (deep lifecycle + workflow automation at enterprise scale)
- Jira Service Management Assets (good when you live in Atlassian; strong chart/dashboard examples exist)
- Lansweeper (commonly used for inventory visibility; often paired with BI)
Platform B: BI tools (Power BI, Tableau) — strong for reporting, not for fixing inventory gaps
BI tools are best when:
- You already have clean, reliable asset data
- If you want exec reporting combining Finance/Security/ITAM
- You have internal analytics skills to maintain models
But BI won’t fix incomplete inventory. It will just chart it.
Platform C: Low-code/internal app builders
Useful when:
- If you want a custom interface on top of a clean database
- You have internal engineering bandwidth
- If you don’t need full ITAM workflows inside the tool itself
What are the best tools for creating an asset management dashboard?
Here is the honest answer. The best tool is not about flashy charts. It is the one that keeps your asset data current at all times. It also shows the right KPIs for each role.
When a tool does both, you can trust what you see. You make better decisions with less effort. That is what truly matters.
| Audit-ready ITAM dashboards (regulated enterprise) Virima — Hybrid discovery + ITAM visibility, designed to keep CMDB data current via scheduled rescans. ServiceNow — Strong for large-scale lifecycle governance and workflow integration. Inventory-first visibility (ops-led) Lansweeper — Widely used for inventory visibility; commonly paired with BI for reporting. Atlassian-standard teams Jira Service Management Assets — Strong templates/chart patterns and flexible customization. Executive reporting across systems Power BI / Tableau — Best when asset data is already trustworthy and consistent. |
How can I customize an asset dashboard to track specific assets?
This is where most template articles fail. They treat dashboards as a layout problem. In reality, customization depends on your data and model. It also depends on how the dashboard uses that data.
When the data is wrong, no template helps. When the model is weak, charts mislead you. A good dashboard fixes the data first, then the view.
Here is a simple and repeatable approach you can use. It works in Virima and other enterprise ITAM setups. Moreover, the steps are easy to follow, reuse, and help you build dashboards you can trust.
Step 1: Define your “asset type contract”
For your special assets (medical devices, lab systems, OT/IoT, cloud VMs), define:
- Identifiers (serial, hostname, resource ID)
- Wwner model (primary owner + department + cost center)
- Location (site + room/rack where relevant)
- Lifecycle fields (purchase date, warranty, EOL/EOS)
- Compliance controls (what must be true)
- Risk signals (what counts as “exception”)
Step 2: Ensure the data is continuously collected
Customization fails when fields stay empty. When data is missing, dashboards break. That is why Virima stresses scheduled rescans. It treats discovery as a continuous process, not a one-time task.
Frequent scans keep the fields filled. Your data stays fresh and reliable. As a result, your dashboards keep working as expected.
Step 3: Add fields and normalize the attributes
Make sure those key attributes exist across your “special asset” class so you can:
- Segment by location/owner/status
- Calculate compliance %
- Surface exceptions with accountable owners
Step 4: Build “role dashboards,” not one big board
Create distinct views for:
- Ops (availability, not-seen assets, lifecycle refresh)
- Security/Compliance (exceptions, coverage, evidence exports)
- Finance (renewals, utilization, spend by department)
Step 5: Use a standard widget kit
For any special asset group, always include:
- Coverage: How many exist and how many are in-scope
- Freshness: Last seen/last scan distribution
- Compliance: % meeting required controls
- Exceptions: List with owner + SLA
- Lifecycle: EOL/warranty expirations
- Cost: spend/renewals (if applicable)
How Virima supports an enterprise asset dashboard strategy
This section is Virima-specific on purpose and ties directly to the blog topic. Specifically, you are learning how to build dashboards you can trust. This matters most in hybrid and regulated environments.
1) Virima focuses on the hardest part: Keeping asset data current
Dashboards fail when your asset inventory gets stale. When data is old, your charts can mislead you. That is why Virima focuses on continuous discovery. Its IT Discovery includes both agent-based and agentless scans and is built to rescan your environment often.
It captures new assets and configuration changes as they happen. Virima also makes this clear: you cannot depend on manual imports and updates to keep your CMDB (CMDB definition) current.
Why this matters for dashboards:
A “single pane of glass” only helps when it shows the truth. It must reflect what is really on your network. It also needs to match what runs in all your environments. Without fresh data, that view loses value fast.
2) Virima connects dashboard outcomes to ITAM + audit needs
Virima positions its ITAM as “best-in-class” with flexible discovery options. In simple terms, the dashboard is not an add-on. It sits on top of an inventory that stays current all the time. Because discovery keeps the data fresh, you can trust what the dashboard shows.
How to use this in your blog narrative:
When you show compliance widgets, the data must be real. This includes missing scans, unowned assets, and policy exceptions.
You can tie these widgets to Virima’s approach with confidence. First, discovery keeps asset data accurate. Then, the dashboard reports on that trusted data.
3) Virima’s “visual” layer is a differentiator for stakeholder alignment
Many sources describe Virima as a visual platform. For example, they often mention ViVID, the Visual Impact Display. As a result, this interface shows how assets connect and helps you see dependencies clearly.
Because of this view, you gain better visibility. You also understand risk and compliance faster. As a result, you can act before small issues grow.
Why this matters for dashboards:
In regulated companies, your dashboard is not only for ITAM. It is also for Security, Risk, Compliance, and leaders. So, the view must support real decisions, not just counts.
Visual dependency context helps a lot. It shows how systems connect and what might break. As a result, your dashboard becomes a decision tool, not just a counter.
4) Suggested Virima dashboard packs (copy/paste into your blog as “Virima templates”)
To make the blog feel unmistakably Virima-authored, include “Virima dashboard packs” like these:
Virima dashboard pack A — audit readiness
- Inventory freshness (last scan distribution)
- Unowned assets (no owner/cost center)
- Exceptions by policy group
- “Changes since last audit window” report widget
Virima dashboard pack B — hybrid visibility
- On-prem vs cloud vs edge asset counts
- New assets discovered this week
- Configuration change hotspots (where most drift occurs)
- Assets not seen in 30 days (segmented by environment)
Virima dashboard pack C — lifecycle & spend control
- Warranty/lease expirations in 90 days
- Aging fleet breakdown
- refresh candidates by department
- renewal calendar for software/SaaS (where tracked)
This kind of “Virima-native playbook” section keeps your blog grounded. It adds product context without sounding like a brochure. You show how the ideas work in real life. At the same time, you keep the focus on the reader’s problems.
Build dashboards you can defend
If your dashboard plan starts with “let’s build a Power BI report,” pause first. Instead, ask the real question: Do you trust the asset data behind it? Otherwise, weak data will make the report wrong.
In regulated environments, dashboards are not decoration. They help you prevent surprises before they hurt you. And there’s a straightforward business case: a Ponemon/GlobalSCAPE study is commonly cited for showing non-compliance costs can be 2.71× the cost of compliance.
For example, you can catch missing devices and stale CMDB (CMDB benefits) records. You can also spot evidence gaps before an audit. Finally, you can reduce renewal waste that shows up too late.
The strongest approach is simple. Use continuous discovery to keep data fresh. Then build an accurate inventory you can trust.
Next, show role-based dashboards for each team. Finally, export audit proof when you need it.
When these pieces work together, audits feel routine. You stop reacting at the last minute. Instead, you stay ready every day.
If you want to see how this looks in Virima, book a free demo. You can view inventory freshness, ownership gaps, policy exceptions, lifecycle risk, and renewals in one place. We will show you how teams use continuous discovery and reporting. As a result, you build dashboards you can defend with proof.
FAQs
1) What is an asset management dashboard?
An asset management dashboard provides a single view of asset status, ownership, lifecycle, compliance, and cost signals. It helps teams spot issues fast and prove control during audits.
2) Why do asset dashboards fail during audits?
Most fail because the data is stale or incomplete (missed scans, wrong statuses, missing owners, outdated imports). The charts look fine, but the details don’t hold up when auditors ask for proof.
3) What does “inventory freshness” mean?
It’s how recently assets were discovered or scanned (for example, “seen in the last 7/14/30 days”). Freshness is a core audit KPI because it proves your asset list is current.
4) How often should assets be scanned to stay audit-ready?
Common targets are 7–30 days, depending on asset risk and environment. In particular, regulated teams often enforce tighter windows for endpoints, servers, and sensitive systems.