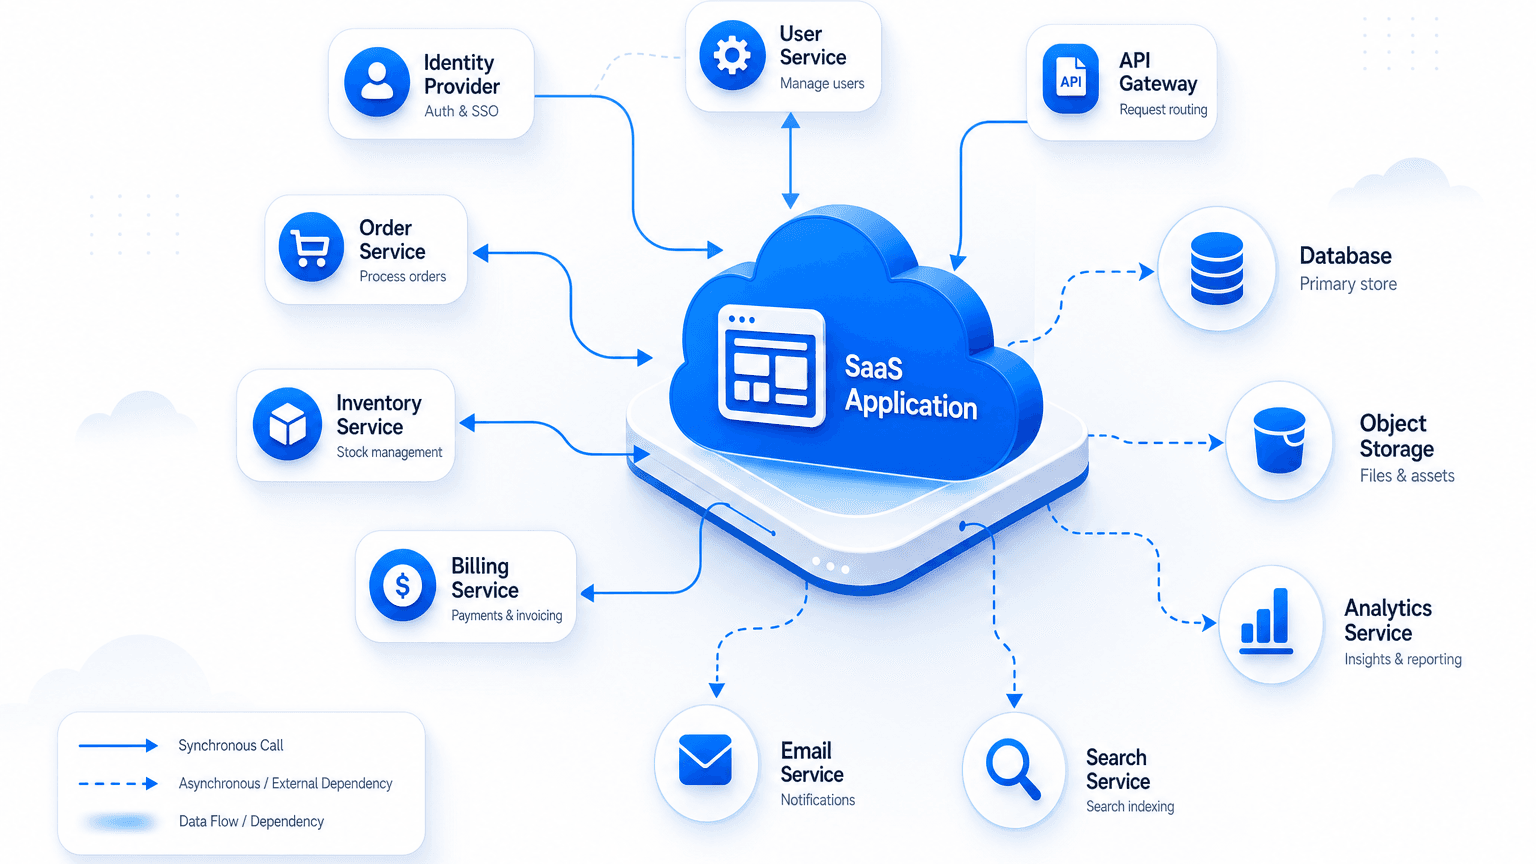
Service Mapping for SaaS Companies: Mapping Microservices and Cloud Dependencies

When a user of a SaaS product opens an application URL, the browser only displays a single interface. Behind that page load sits a long execution chain: traffic crosses edge load balancers, authenticates against identity providers, routes through API gateways, triggers microservices in Kubernetes pods, queries databases, and pulls from background queues. Every component can report green across individual infrastructure dashboards. The customer-facing application can still degrade when one dependency between those systems stalls or drops traffic. The customer experiences one service. Operations has to understand the dependency graph underneath it.
That operational gap explains why service mapping for microservices has become a baseline requirement for SaaS teams. Microservices reduce application-level coupling by dividing software into smaller, independently deployable units. Operationally, that same architecture creates far more runtime relationships that engineers must understand during outages and change windows. Distributed software architectures only remain operable when operations can reconstruct the full dependency chain behind the customer journey.
Microservices move complexity into relationships
Monolithic architectures keep most software dependencies within a single deployment boundary. Engineers manage code-level coupling, internal libraries, and shared data schemas, but those relationships stay largely inside the same runtime artifact.
Microservices split those responsibilities across independently managed services. While that model accelerates feature delivery and isolates code changes, runtime communication shifts outside the process space. Calls cross physical networks and VPC boundaries. Asynchronous message queues buffer work between producers and consumers. Databases, caches, and identity layers become shared runtime dependencies across multiple product features.
AWS X-Ray visualizes this architectural pattern through directed service graphs. In that model, nodes represent individual services or compute resources, while edges capture the downstream services required to fulfill an inbound request. The system looks modular to software developers, but it looks relational to operations and site reliability engineers. Microservices do not eliminate architectural complexity. They move complexity from inside applications into the relationships between services.
Where does complexity move when teams adopt microservices?
Microservices move coupling from inside one deployable application into explicit runtime relationships across APIs, queues, data stores, cloud resources, and network paths. Operators need those edges, not only a list of services, to interpret customer-facing impact.
A list of microservices is not a service map
Most SaaS organizations maintain a software catalog or asset inventory. That inventory might list an authentication service, payment gateway, profile service, notification worker, PostgreSQL cluster, and an Amazon EKS cluster. That list confirms these assets exist within the corporate boundary. It does not explain how those systems interact, which upstream services rely on each datastore, or what customer workflows break if an API gateway drops a listener rule.
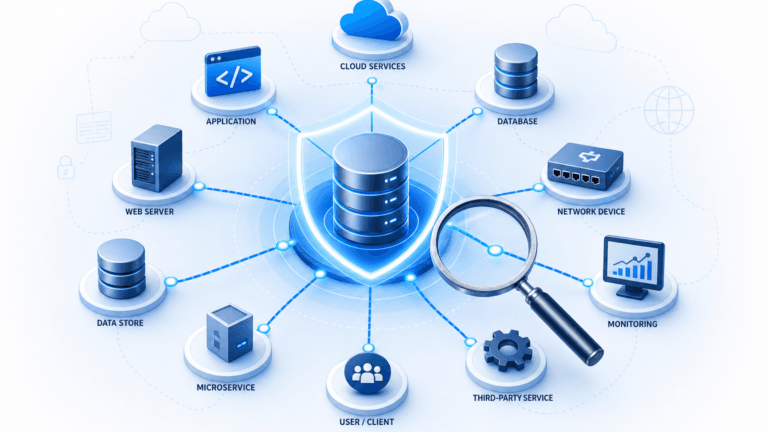
A service map provides the structural context that flat asset inventories lack. Upstream and downstream edges indicate request flows and data dependencies. Hosting and network relationships pinpoint the exact compute nodes, subnets, and clusters hosting each workload. Most importantly, business service context ties those technical assets back to the customer capabilities they deliver. An inventory catalogues components. A service map documents dependency structure.
Review the architecture behind Trusted Runtime Truth to see how discovery-sourced relationship context keeps operational data reliable.
Cloud infrastructure makes the dependency graph deeper
Microservice dependencies extend far beyond simple API-to-API network calls. A single containerized service frequently relies on a multi-tiered infrastructure stack: container image, Kubernetes pod, host worker node, virtual machine, cloud subnet, security group, load balancer, and external database instance. Another service might route through an API gateway, an AWS RDS cluster, and private VPC peering links.
Cloud abstractions allow engineering teams to provision those underlying layers in minutes through infrastructure-as-code templates. That convenience does not eliminate physical and virtual dependencies. It simply makes them easier for software engineers to overlook. Native cloud consoles display isolated resources within regional silos, while cluster tooling focuses exclusively on pod health. Effective cloud service mapping correlates application communication paths with the underlying cloud and network resources supporting them.
Why does cloud make SaaS dependency mapping harder?
Cloud APIs hide hosting, network, and control-plane layers behind managed services. Those layers still form runtime edges under microservices. Mapping must include containers, load balancers, VPC paths, and managed data stores, not only service-to-service calls.
Dynamic infrastructure makes static architecture diagrams decay
Modern SaaS platforms run on ephemeral infrastructure. Containers restart frequently, horizontal pod autoscalers adjust instance counts, deployments redirect traffic, and cloud resources spin up or down on demand. Architectural diagrams drawn in static design tools reflect design intent at a single point in time, while production environments run on a fluid dependency topology.
Static diagrams remain useful for initial architecture reviews, but they fail during production outages. A service map only provides operational value when its refresh cadence aligns with the rate of change across the underlying environment. When relationship mapping relies on manual updates or infrequent audits, operations teams end up troubleshooting modern microservice incidents using outdated structural blueprints.
Monitoring tells you something is unhealthy; mapping shows what it affects
Observability tooling and service mapping serve distinct, complementary purposes. Metrics track throughput, error rates, and CPU utilization. Log management systems centralize stack traces and debugging events. Distributed tracing follows individual user requests across instrumented application code. CloudWatch Application Signals groups services and application dependencies while pairing health signals with transaction traces.
Those observability systems monitor runtime behavior, but they do not maintain a persistent structural model of the entire enterprise service estate. Monitoring alerts engineers that a specific database cluster has experienced a latency spike. Service mapping identifies every microservice, asynchronous worker, and user-facing feature relying on that degraded database. Observability provides operational telemetry, while service mapping supplies the dependency topology needed to interpret that telemetry.
Shared dependencies explain incidents that look unrelated
During major platform incidents, multiple SaaS features often begin failing across different application domains simultaneously. The customer billing portal, user onboarding flow, and automated report exporter might all show degraded performance at the same time. Investigating each symptom independently leads to duplicated triage efforts across separate engineering squads.
A unified dependency map often reveals that those seemingly unrelated features share an unheralded infrastructure dependency. All three capabilities might route through a shared authentication worker, an internal API gateway, a Redis caching tier, or a single network NAT gateway. Mapping does not magically identify root cause on its own, but it rapidly directs incident response teams to the common branch of the architecture causing widespread blast radius.
Change risk also travels through dependency graphs
Engineering teams frequently submit infrastructure change requests that appear contained at the code or pipeline level. Updating a database connection pool, modifying a load balancer routing rule, or patching a shared messaging queue can look like low-risk maintenance within an isolated pull request.
The actual operational risk of any change is determined by its downstream dependency reach, not by the isolated component being modified. A routine configuration update to a shared routing table can cascade into unexpected downtime for downstream microservices that developers did not realize were routed through that path. Pre-production change management impact analysis visualizes the full downstream blast radius before changes enter the deployment window.
How should SaaS teams judge change risk on microservices?
Judge change risk by dependency reach across upstream and downstream services, shared data stores, load balancers, and network paths. The ticketed component is the start of the graph, not the full blast radius for customer-facing impact.
Tracing and service mapping answer different questions
Distributed tracing and service mapping are frequently confused, but they answer fundamentally different operational questions.
Distributed tracing tracks sampled user requests as they traverse instrumented codebases. It identifies where latency was introduced along a specific call path and isolates which external API call threw an unhandled exception. Service mapping builds a complete model of the IT and cloud estate, identifying which compute instances, network routes, and third-party dependencies compose a given business service.
While trace data can inform service maps, single request traces do not account for passive infrastructure relationships, uninstrumented legacy components, or inactive failover paths. Tracing delivers deep forensics for active software requests, whereas service mapping maintains the broader relational model required for change governance, incident blast-radius analysis, and service ownership tracking.
Service maps need more than one source of dependency data
No single telemetry collector or discovery mechanism can capture every dependency in a SaaS environment. Infrastructure scanning and cloud APIs identify compute instances, virtual private clouds, storage volumes, and serverless assets. Network traffic observation uncovers active communication paths between hosts and containers. Process-level discovery detects installed software packages, open network ports, and runtime services. Application-level tracing captures inter-service calls across instrumented frameworks.
Relying solely on network traffic misses logical or dormant dependencies, such as cold-standby disaster recovery systems or periodic batch processors. Relying strictly on application code analysis misses underlying cloud routing tables and database hosting hardware. The most accurate service maps combine multi-source discovery with structured business service definitions contributed by engineering and platform teams.
What a useful SaaS service map should explain
| Operational Question | Service Mapping Context |
|---|---|
| What customer service is degraded? | Customer-facing SaaS product or business service |
| Which application layers support it? | Microservices, web frontends, and background workers |
| What is the communication path? | Upstream callers and downstream service targets |
| Where do those workloads run? | Containers, Kubernetes pods, VMs, and cloud instances |
| What data layers are involved? | Relational databases, object stores, and cache clusters |
| Which network assets route traffic? | Load balancers, API gateways, and cloud VPC subnets |
| Which dependencies are shared? | Common infrastructure supporting multiple services |
| What recently changed along the path? | Recent deployment events and infrastructure change tickets |
| What else could be affected? | Downstream blast radius across connected applications |
This structural framework moves teams away from static CI inventory lists toward actionable relationship management. Each data point connects technical infrastructure directly to the business capabilities customers pay to use.
A practical workflow: discover, relate, define, map, overlay, refresh
Building maintainable service maps in dynamic microservices environments requires a disciplined lifecycle:
- Discover: Scan infrastructure, cloud accounts, container clusters, and running processes to maintain an exhaustive hardware and software inventory.
- Relate: Capture hosting, network connectivity, and communication edges across observed assets.
- Define: Ingest business service definitions from application teams, enterprise architecture tools, or configuration databases.
- Map: Build end-to-end upstream and downstream dependency graphs linking infrastructure to defined business services.
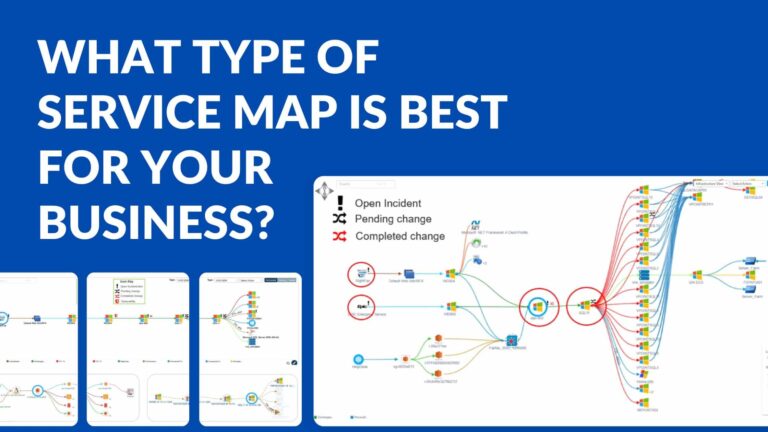
- Overlay: Project active incidents, pending change requests, vulnerability findings, and health metrics directly onto the dependency topology.
- Refresh: Re-evaluate dependency relationships as discovery scans detect environmental modifications and cloud resource changes.
Running this cycle on high-frequency schedules ensures that operational maps remain synchronized with actual production topology rather than decaying into historical documentation.
Where Virima fits for microservices and cloud dependency context
Virima delivers an operational service mapping platform designed to bridge the gap between technical cloud infrastructure and business service operations. Rather than attempting to replace distributed tracing or APM platforms, Virima functions as the authoritative operational dependency layer across the enterprise estate.
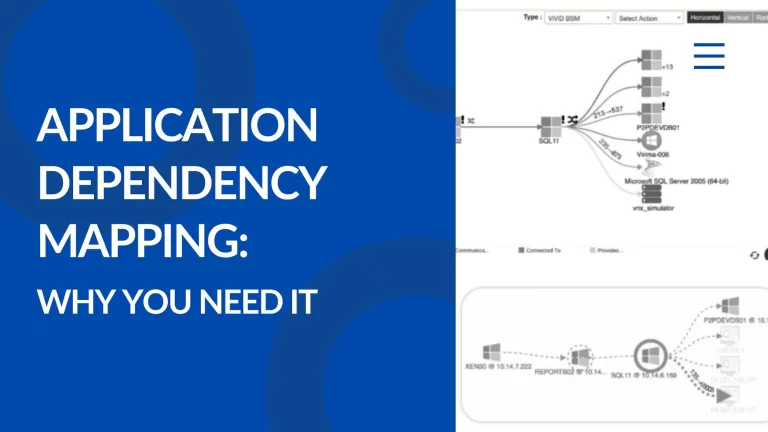
Engineering teams define service boundaries manually, via bulk spreadsheet import, or through integrations with tools like LeanIX. Virima Discovery gathers asset and relationship data across on-premises data centers, AWS, Azure, and container environments through high-frequency discovery cycles. ViVID (Virima Visual Impact Display) generates detailed dependency maps from those discovery records and service definitions, updating visualizations as new configuration data arrives.
Virima models critical operational relationships including Runs On, Communicates With, Connected To, Hosted On, and Load Balancer For. ViVID overlays active ITSM records, pending change requests, and security vulnerability context onto the visual topology. Platform teams gain clear visibility into cross-service dependencies and change blast radius across heterogeneous environments. Virima synchronizes these dependency graphs across enterprise service management platforms through unified ITSM integrations, including ServiceNow, Jira Service Management, Ivanti, HaloITSM, Xurrent, and Hornbill.
Virima does not replace tools like Datadog, Dynatrace, or AWS CloudWatch. Instead, it enriches that runtime telemetry with persistent service topology and ITSM context, giving SaaS operators an accurate view of how distributed components assemble into customer-facing products.
Keep the customer service whole while the graph keeps moving
Microservices enable modern SaaS engineering teams to ship code rapidly and scale services independently. Yet customers never interact with isolated microservices; they interact with unified business capabilities that require dozens of decoupled systems to work in unison.
Observability metrics and distributed traces reveal how individual services behave under load. Service mapping provides the architectural context showing how those microservices, cloud resources, and network paths connect to deliver the end-user product. Maintaining an accurate, discovery-driven service map ensures that platform teams can manage change risk confidently, troubleshoot multi-service incidents efficiently, and keep production systems reliable as architectures evolve.
Schedule a technical evaluation to see how Virima Discovery and ViVID service mapping bring clarity to microservices and cloud infrastructure.
Frequently Asked Questions
Why can every microservice look healthy while customers still see an outage?
Customer impact often sits on the edge between components, not only inside one process. A queue, identity path, shared database, load balancer, or network route can break the journey while isolated health checks stay green. Dependency context shows how those pieces combine into the product surface.
Is a microservice inventory enough for incident response?
No. An inventory names services and infrastructure items. Incident response needs upstream and downstream edges, shared dependencies, hosting context, and business-service binding. Without that structure, teams chase symptoms service by service instead of shared branches on the graph.
How is service mapping different from distributed tracing?
Tracing follows sampled requests to show path, latency, and failure points. Service mapping maintains a broader operational model of how services and infrastructure compose applications and business services over time. Traces can feed dependency views. They do not fully replace a persistent map used for change reach and shared-edge analysis.
Can one tool discover every SaaS dependency automatically?
Complete coverage rarely comes from one mechanism. Cloud APIs, infrastructure discovery, communication data, tracing, configuration, and owner-defined service composition each see different edges. Strong maps combine observed relationships with explicit service definitions and accept that some logical dependencies need human validation.
How does Virima support service mapping for microservices without replacing APM?
Virima Discovery collects infrastructure and relationship data on scheduled discovery cycles. Teams supply service definitions. ViVID builds and refreshes dependency maps across applications, networks, and cloud resources, with optional ITSM and vulnerability overlays. Tracing and APM stay in place for request behavior. Virima adds durable dependency and blast-radius context around those signals.