One Service Map,Every Team: Faster Ownership in Incident Response

A major incident brings network, server, database, application, cloud, and security teams onto the same bridge. Each group opens its own monitoring tool and checks its own slice of the infrastructure estate. Enterprise Management Associates (EMA) hosted an EMA and Allegro Packets webinar where Mike Canney, a network and application performance engineer at Allegro Packets, described the dynamic seen on years of tiger team calls. The network team reports ping times under four milliseconds, the systems team reports healthy CPU, memory, and disk activity, and users continue to report slowness. Every individual dashboard displays green status while the critical business incident continues.
Each monitoring console reports on an isolated technical domain, forcing the response team to manually assemble the overall service picture during the crisis call. A service map provides that contextual picture before an outage happens. Built directly from the configuration management database (CMDB), a service map displays a recognized business service, the infrastructure components beneath it, and the active dependencies connecting them. Every team works from the exact same visual model, allowing true component ownership of the slowdown to surface earlier.
Canney cited one customer scenario where a tiger team stayed on an active conference call for six months, with staff from multiple infrastructure groups contributing throughout.
Why Incident Bridges Run Long
EMA published their EMA Network Management Megatrends 2026 research report in May 2026, based on a survey of 352 IT professionals across North America and Europe. One survey question asked respondents to evaluate their last three difficult service performance issues that required multi-team collaboration, and to identify the primary root cause behind each outage. Reported answers spanned five distinct domains: cloud services, network infrastructure, security incidents that first presented as application degradation, physical servers and hypervisors, and client edge devices or user error.
EMA vice president of research Shamus McGillicuddy observed that network operations (NetOps) teams prioritizing packet-level visibility collaborate far more frequently with cybersecurity, cloud engineering, and DevOps or site reliability engineering (SRE) teams. Those three partner groups directly overlap with the primary root-cause domains identified in major outages. Canney detailed bridge lines involving twenty or more engineers, each focused exclusively on a disconnected domain console.
The EMA survey data also measures these operational visibility blind spots directly. 38% of NetOps teams report notable gaps in end-to-end visibility, while 24% report blind spots in their baseline monitoring coverage. Because of these visibility gaps, network operators spend 29% of their working day on reactive troubleshooting instead of planned engineering initiatives.
Why do cross-functional incident triage bridges run so long?
Incident triage bridges run long because technical teams evaluate siloed domain dashboards that report green status locally. Without an authoritative service map connecting infrastructure to the business application, responders spend critical hours manually identifying which components participate in the degraded service path.
What a Service Map Shows
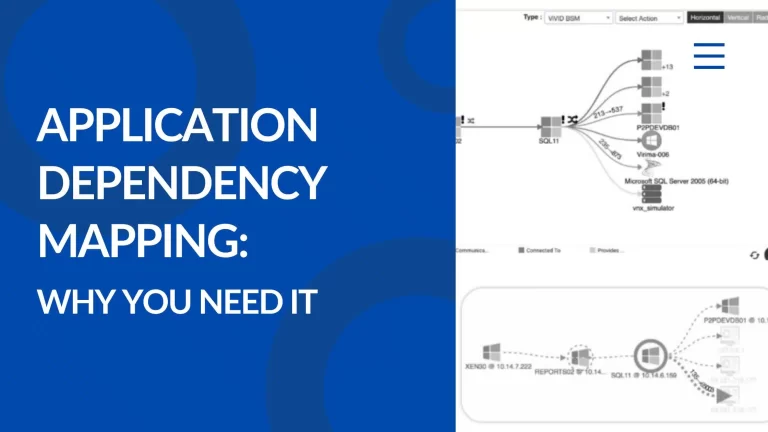
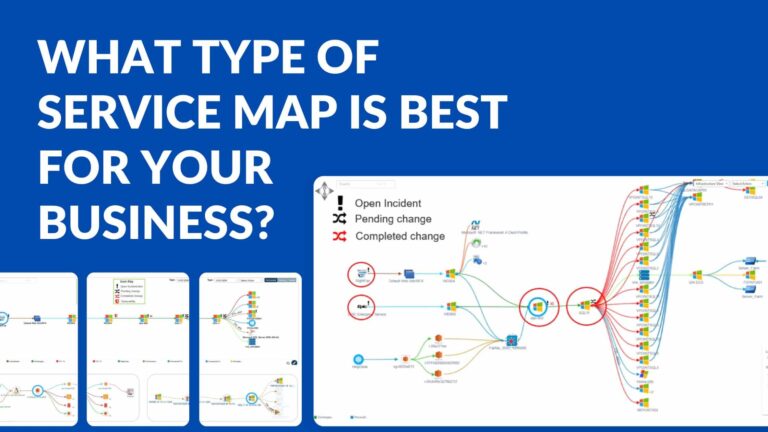
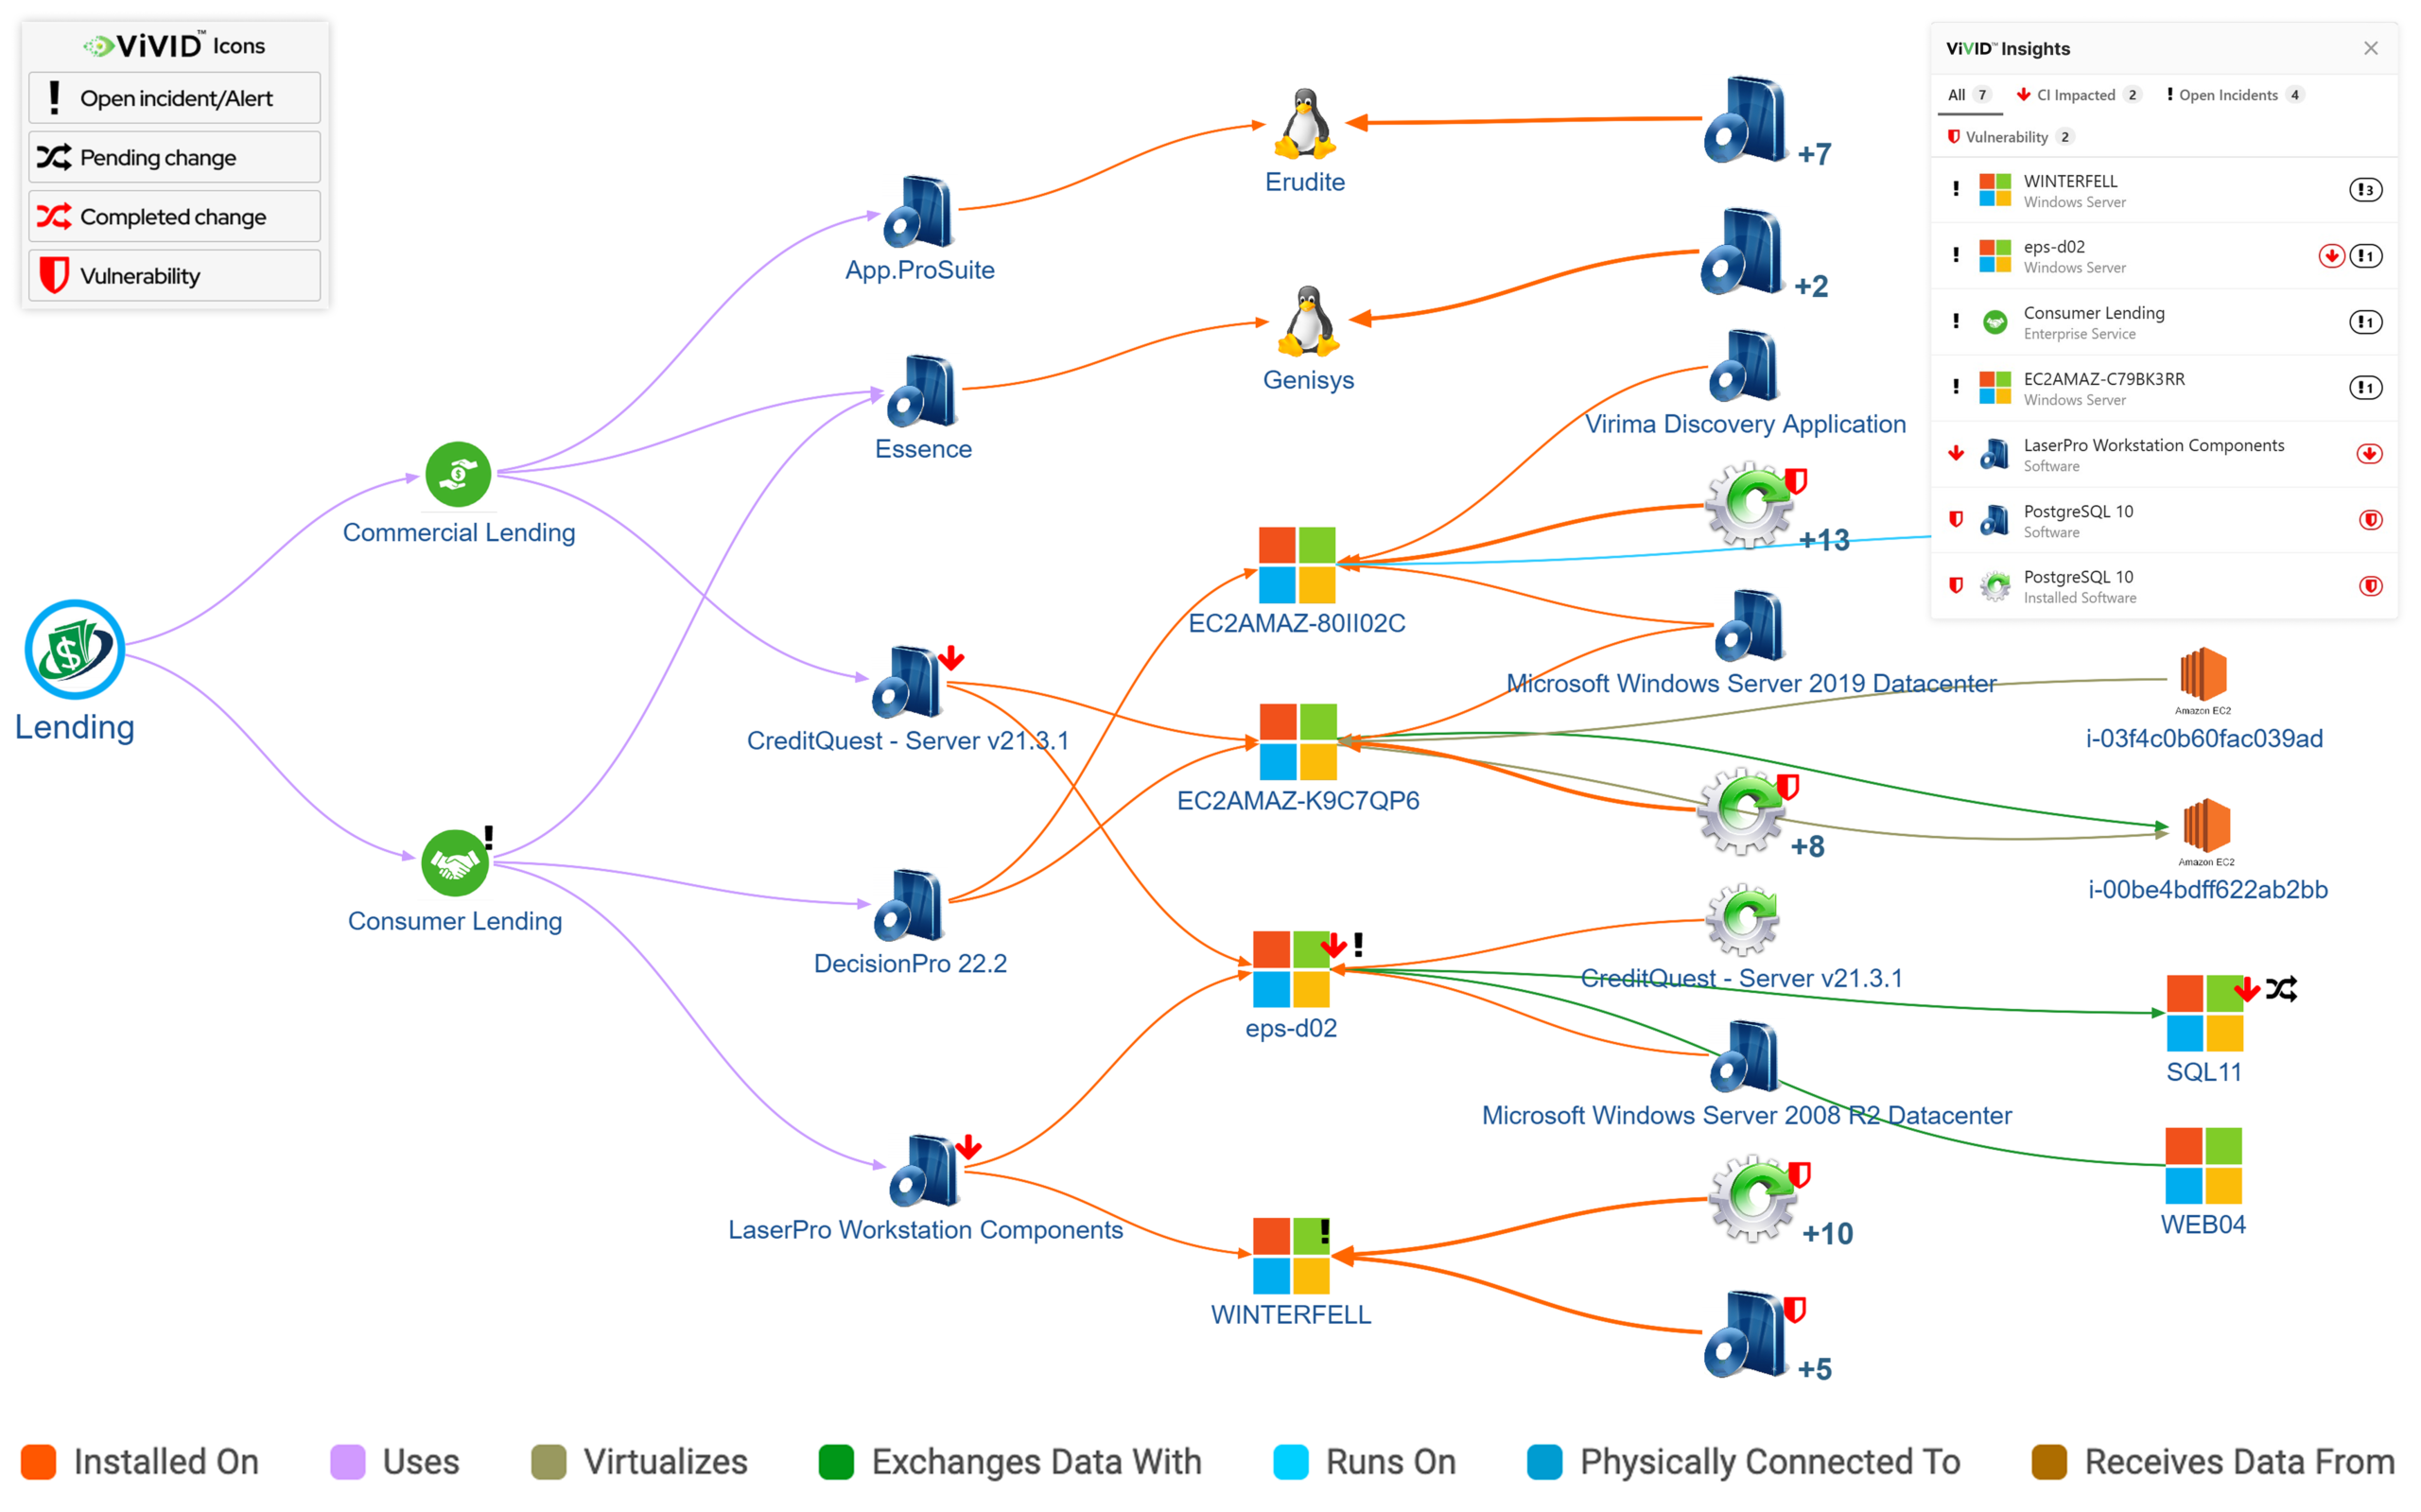
A service map provides a visual model of a business service and the multi-tier components it relies upon to function. Each node in the map represents a configuration item, such as an application server, database cluster, load balancer, network switch, or cloud workload. Each connecting line defines an active technical relationship between two connected components. The map originates at an operational service recognized by business leaders (such as payment processing or customer onboarding) and extends downward into the physical, virtual, and cloud infrastructure supporting it.
The configuration management database supplies the underlying dependency data. Scheduled discovery cycles populate configuration items (CIs) and their relationships, while dynamic service mapping renders those connections as an actionable topology. Virima provides automated IT discovery and CMDB relationship mapping to capture infrastructure relationships from on-premises and cloud environments without manual inventory logging.
Each technical team quickly identifies its assigned infrastructure components on the shared visualization. The database administrator pinpoints the active database cluster, the network engineer isolates firewalls and routers along the path, cloud architects inspect container clusters, and the application owner tracks end-to-end service delivery.
Finding the Owner Faster
Canney described each major incident investigation as progressing through five distinct stages: detect, characterize, investigate, diagnose, and improve. Most enterprise organizations maintain reliable detection mechanisms through synthetic testing and infrastructure alerting. Characterization establishes where the performance degradation resides, when it started, and whether an outage exists. Investigation determines which application experiences trouble, which user communities face disruption, and which infrastructure tiers participate in the transaction path.
A dependable service map directly accelerates the characterization and investigation stages. By visually outlining the impacted service, the participating nodes, and the upstream and downstream dependencies, the map gives bridge coordinators an exact list of suspect systems to assess.
Canney referenced a persistent issue at a large financial institution that reached the engineering bridge simply titled “the internet is slow.” The tiger team investigated for months without clear progress. In Canney’s assessment, the hardest work after confirming service degradation is defining the scope of affected systems and identifying participating infrastructure tiers.
Engineers frequently cite mean time to innocence (MTTI), describing how quickly a domain group proves its own infrastructure is operating normally. With a shared service map visible on the bridge, each engineer locates their respective component on the transaction path and validates its health. A network engineer who confirms that border switches and application firewalls show normal latency can demonstrate that status directly on the shared path, allowing the bridge to immediately redirect attention toward suspect application services.
EMA found that 43% of enterprise network performance issues first surface through end-user complaints rather than internal alerting. Scoping inevitably begins after business users experience service disruption, making a pre-mapped dependency view essential to compress the delay between user escalation and pinpointed component ownership.
Stop finger-pointing on incident bridges with live dependency context
Give incident commanders and domain specialists a single pane of runtime truth across application tiers, network hops, and hybrid infrastructure before outages escalate.
A Service Map for the Skills Gap
52% of surveyed IT teams report severe difficulty hiring network engineering professionals, jumping from 26% in 2022 and approximately 41% in 2024. Furthermore, 34% identify fundamental monitoring and incident troubleshooting among the most difficult capabilities to hire, while 33% select ease of use as their primary purchase requirement when evaluating network management tooling.
McGillicuddy cited enterprise practitioners who described network operations centers (NOCs) that historically operated with 25 tier-one analysts and now operate with only 10. Executive leadership frequently expects modern automation to offset reduced headcount. McGillicuddy highlighted an unintended industry consequence: shrinking tier-one staffing pipelines leaves fewer junior engineers gaining the practical operational foundation needed to advance into senior engineering positions.
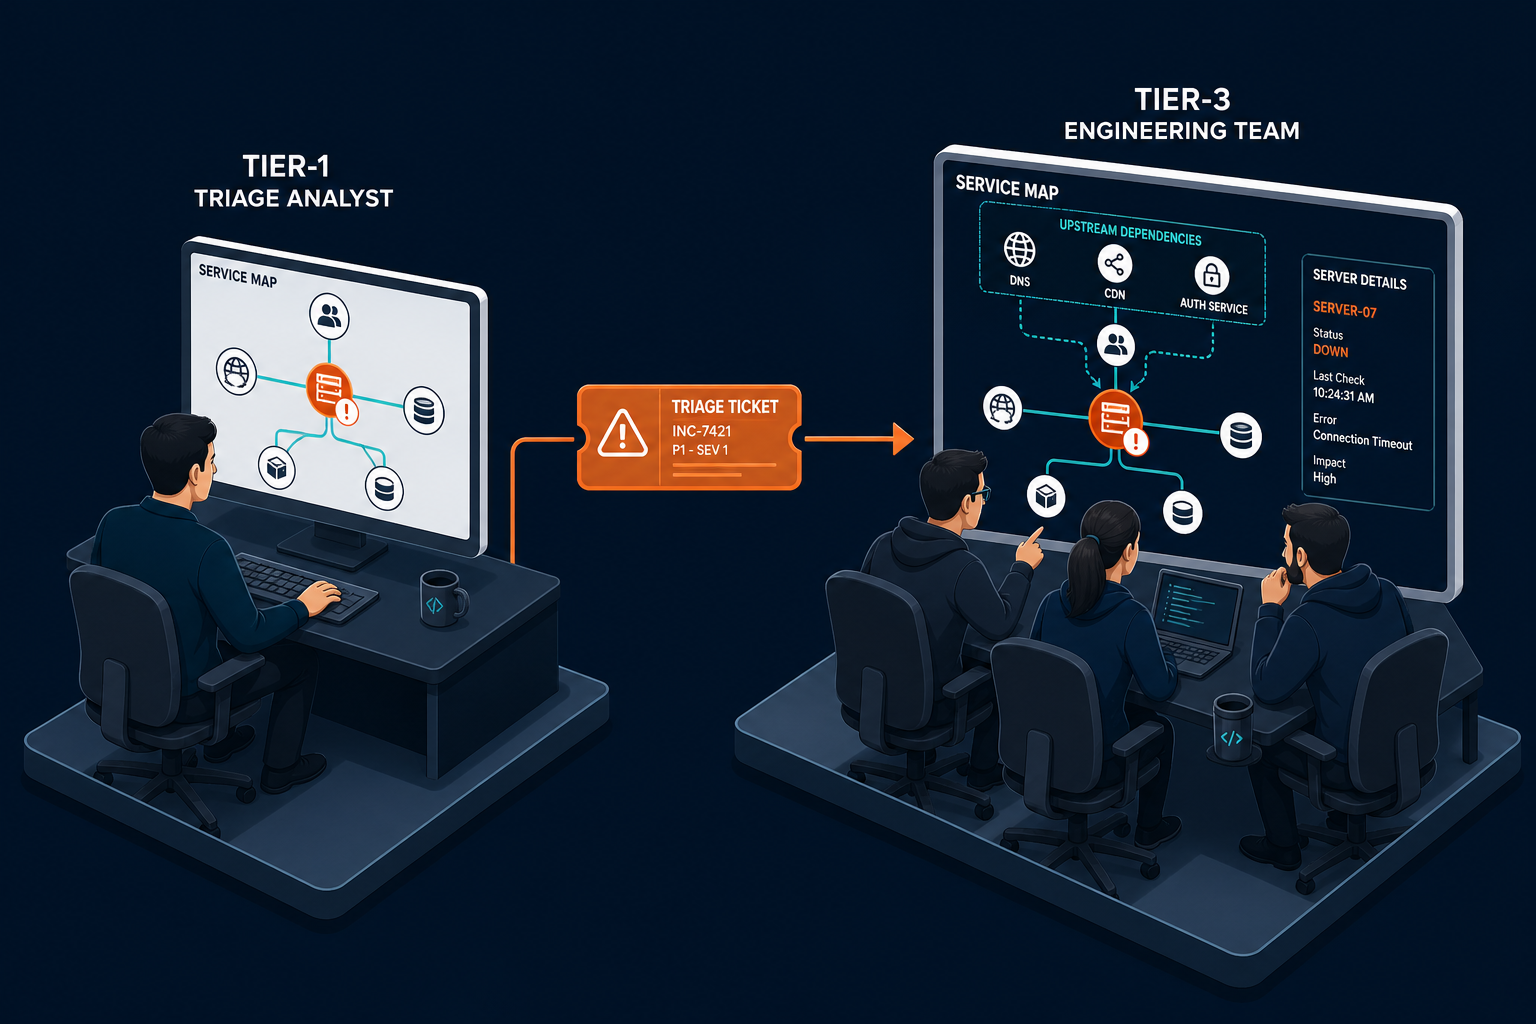
A unified service map gives tier-one triage analysts immediate visual context during major incident intake. An analyst who clearly sees which business service a failing server supports, alongside the verified ownership contacts for adjacent infrastructure, can escalate tickets with precise context. Tier-three specialists receive actionable tickets naming the business service, the suspected component, and the upstream blast radius.
One Map Across Hybrid Environments
EMA revealed that 69% of NetOps organizations now support complex hybrid cloud environments, yet 42% acknowledge that their current monitoring tools struggle to track cloud-native dependencies. Enterprise applications routinely traverse private data centers, hosting facilities, and public cloud regions, relying on dedicated interconnects. Among hybrid organizations, the 55% that deployed end-to-end visibility spanning data centers and cloud platforms were significantly more likely to report a successful NetOps strategy.
A dynamic service map organizes assets according to their operational function within the business workflow, regardless of hosting location. A cloud web front end, an on-premises middleware tier, and a co-located core database appear together on a single canvas with their supporting dependencies. High-frequency cross-platform hybrid IT discovery maintains those critical relationships as dynamic virtual machines and microservices shift across platforms.
Getting Started With a Service Map
- Select a critical business service that carries a record of contentious, prolonged incident bridges.
- Generate its infrastructure components and interdependencies using verified configuration item discovery data.
- Validate the resulting topology with domain specialists to verify that discovered dependencies mirror actual traffic paths.
- Establish the verified service map as the standard visual reference on every bridge call for that application.
Four core operational criteria determine whether an organization’s service mapping capability will succeed during active incidents:
- Data freshness: How quickly do infrastructure reconfigurations and workload migrations register on the topology?
- Relationship accuracy: Do discovered CI dependencies reflect active production communication paths?
- Hybrid coverage: Does the visualization span private data centers, edge appliances, and public cloud architectures?
- Triage usability: Can frontline analysts readily interpret component relationships and team ownership under operational pressure?
How does a CMDB service map improve Mean Time to Resolution (MTTR)?
A CMDB service map improves MTTR by eliminating the multi-hour discovery phase of incident response. Instead of cross-functional teams querying isolated monitoring tools to reconstruct architecture during a bridge call, responders inspect an authoritative dependency path to pinpoint upstream causes and assign remediation ownership immediately.
Accelerate Incident Resolution with Discovered Service Truth
Prolonged incident bridges drain senior engineering resources and multiply the business cost of application downtime. When infrastructure, application, and security teams triage from isolated domain views, investigations stall in repetitive validation cycles. Virima’s ViVID™ dynamic service mapping combines automated multi-source IT discovery with actionable CI dependency visualization, giving triage commanders instant visibility into service hierarchies, infrastructure dependencies, and verified ownership.
Ready to eliminate siloed finger-pointing on your incident calls?
Discover how Virima maps complex hybrid application dependencies automatically to accelerate root-cause triage and reduce MTTR across your entire IT organization.
Frequently Asked Questions
Why do green monitoring dashboards fail to pinpoint outages on incident calls?
Domain monitoring tools assess isolated technical health metrics like local CPU or port availability rather than end-to-end transaction paths. When an outage stems from a misconfigured dependency or upstream service block, individual nodes appear healthy locally while the overall business service fails.
How does a service map differ from a static network topology diagram?
A network topology diagram displays physical device connections and network routing paths. A dynamic service map models multi-tier business applications, associating software instances, cloud databases, and virtual hosts with the business functions they support based on discovered CMDB relationship data.
How does Virima ViVID service mapping accelerate incident triage?
Virima ViVID overlay views transform complex CMDB relationship records into clear visual service hierarchies. Responders see application dependencies, recent configuration changes, and assigned CI owners in one shared view, allowing teams to isolate failing components without manual research.
How does Virima discovery maintain service maps across hybrid cloud environments?
Virima utilizes scheduled agentless discovery across on-premises data centers and major cloud platforms including AWS and Azure. Discovered configuration items and interconnecting dependencies populate the CMDB, ensuring service maps accurately reflect workload movement and architecture adjustments.