CMDB Incident Correlation: What a Monitoring-Only Stack Can’t Tell You

An outage can generate a clear alert while leaving responders unsure which services depend on the affected system. During an October 2025 disruption, AWS reported a DynamoDB DNS issue that began at 11:48 PM PDT. Engineers identified the DNS state as the source by 12:38 AM. The event lasted until 2:20 PM the next day and affected several AWS services.
Network Load Balancer connection errors began at 5:30 AM during the same event. AWS monitoring detected the related health-check problem at 6:52 AM, about 82 minutes later. AWS operated its own tools at hyperscale, and the report does not establish whether a CMDB would have shortened the disruption.
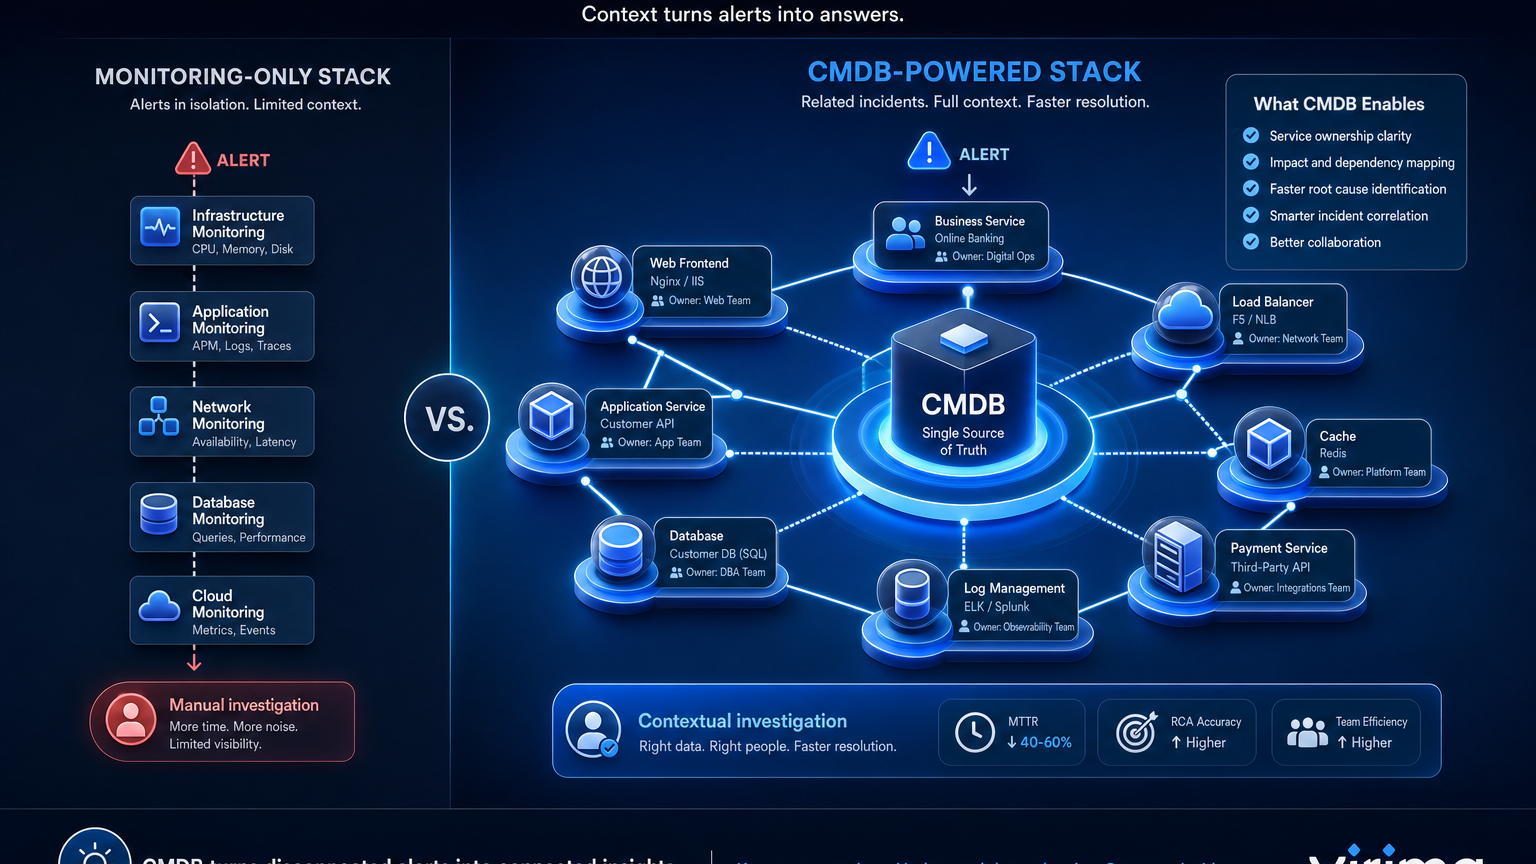
For an IT Operations Manager, monitoring-only stack vs CMDB incident correlation comes down to the questions responders can answer. Monitoring signals identify symptoms in the systems they cover. Reliable records can add ownership and dependency context when those facts are available and maintained.
Can a Monitoring-Only Stack Correlate Incidents Without a CMDB?
A monitoring stack can correlate events by time, tags, hosts or instrumented topology. Some platforms also display ownership, changes, and service dependencies when configured with those inputs. Coverage depends on the tools, integrations, and records your team maintains.
A CMDB can provide another place to record configuration items, their relationships and confirmed owners. When incident workflows connect to those records, responders can inspect context alongside monitoring signals. The value depends on the completeness, freshness, and accessibility of the underlying data.
What Monitoring Answers, and What It Leaves to People
The Google SRE book asks monitoring teams to address what is broken and why. This distinction separates a symptom from a possible cause. Incident responders also need to understand impact, ownership, and recent changes.
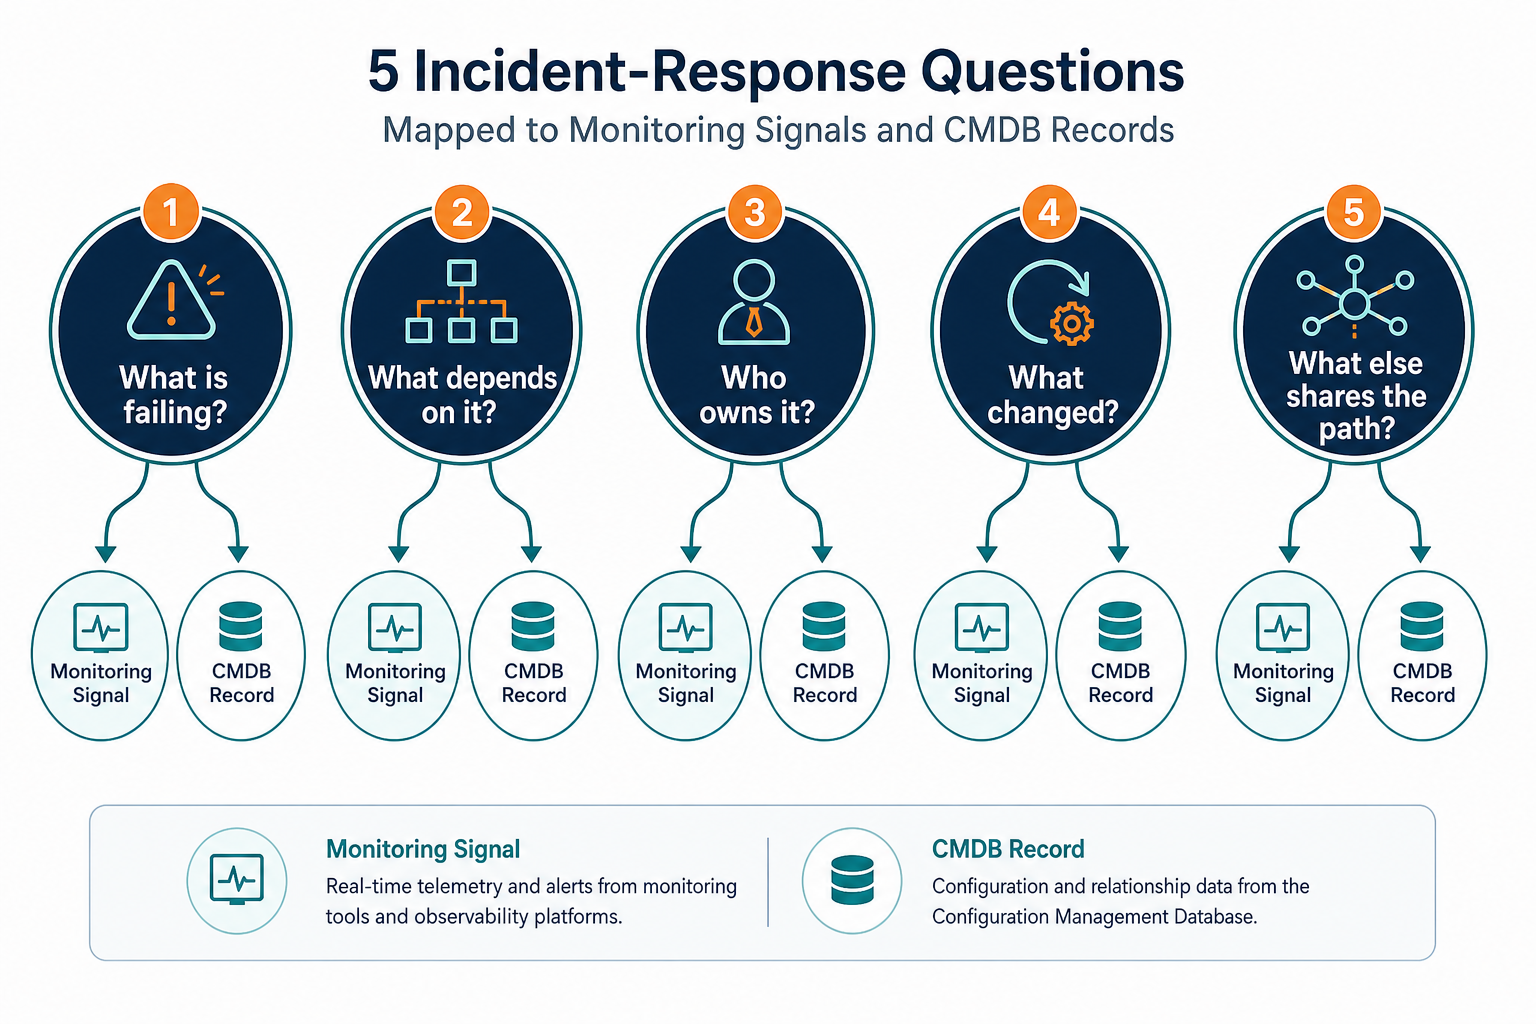
The table below sets out five questions to test during an incident review. Your tools may answer more or fewer than the examples suggest.
| First-responder question | Possible monitoring answer | Additional record to check | Common human source |
|---|---|---|---|
| What is failing? | Alerts and telemetry for instrumented components | Inventory of components outside monitoring coverage | On-call engineer |
| What depends on it? | Dependencies visible through configured traces or maps | Recorded relationships across relevant infrastructure and services | Application owner |
| Who owns it? | Owner tags where populated and maintained | Confirmed CI and service ownership | Team lead or service owner |
| What changed? | Timing of a telemetry change | Relevant change records and configuration history | Change manager |
| What else shares the path? | Other alerts and instrumented dependencies | Recorded shared network, storage or hosting relationships | Infrastructure engineer |
A relationship record is useful only when responders can find and trust it. Check whether the record identifies its source and when it was last updated. Ask the service owner to confirm ownership when the field is missing or disputed.
Where Monitoring-Only Incident Response Breaks Down
The following situations illustrate how gaps in available context can slow an incident investigation. They describe possible incidents rather than measured customer outcomes.
An alert identifies a host without an owner or service link. The on-call engineer sees the affected server but cannot identify the team responsible. The engineer searches old tickets and asks colleagues who support the service. Result: escalation depends on a person answering the ownership question.
Responders learn dependencies by asking people during an incident. A database slows down, and several applications report errors. The monitoring tool shows the error rates but lacks a complete map of the shared database. Result: responders consult application owners to identify other services that may be affected.
A change is visible as a spike, while its cause remains uncertain. Latency rises after a maintenance window begins. The graph shows the change in latency, but the responders still need the change record. Result: the team checks the relevant change and compares its timing and scope with the symptoms.
The practical details of linking alerts to services can help teams connect signals with configuration records. For the audit below, focus first on the questions responders could and could not answer.
What It Costs Each Role
The IT Operations Manager coordinates the response and assigns the next investigation. When ownership is unclear, the manager may need to contact several teams before finding the right responder. Each handoff also requires a clear description of the affected component.
The on-call engineer needs enough context to make a safe first decision. A missing service or change record can turn the investigation into a search across ticket histories and chat threads. Time spent finding those facts competes with time available for diagnosis.
The service owner needs to communicate what users may experience. A dependency map can inform that update when the relevant relationships have been maintained. If the record is incomplete, the owner should state what remains uncertain rather than presenting an assumption as confirmed impact.
How to Run a Bridge-Call Question Audit
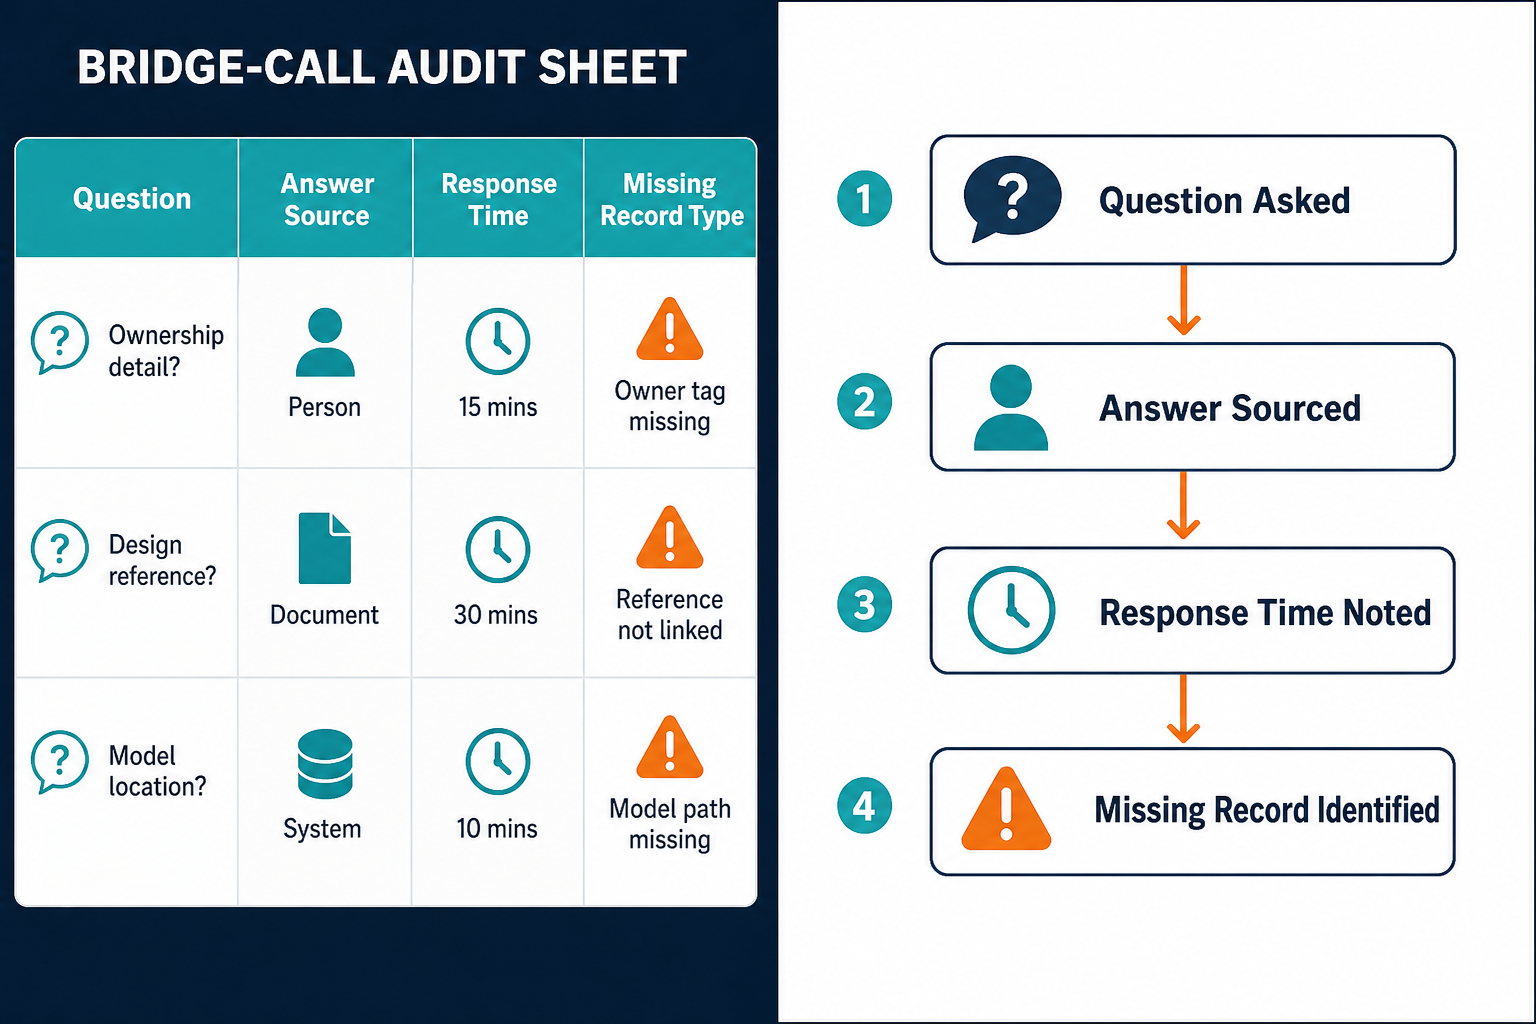
Use bridge-call notes or chat transcripts from the last three major incidents. A transcript with timestamps is useful, although missing records should be marked as unknown. The exercise gives the team a way to compare unanswered questions without assuming a benchmark.
- Pull the notes or transcripts for the three incidents your team selects.
- List the questions asked during the first 30 minutes of each incident.
- Record whether a tool, a person, or neither supplied the answer.
- Note the time between each question and its first usable answer, where timestamps permit.
- Group each question by ownership, service, dependency, change, or another relevant category.
For repeatable scoring, calculate the share answered by a tool, the share answered by a person, and the share unanswered. Use the total number of recorded questions as the denominator. Report unknown timing separately instead of assigning it zero minutes.
For example, suppose a transcript contains ten questions with seven answered by people and three by tools. The person-answered share would be seven divided by ten, or 70%. That is an illustrative calculation, not an industry target or a claim about your team.
Record which systems the responders consulted and whether they trusted the answer. A tool can contain a field while still leaving a person to confirm an outdated value. The incident-to-CI link review explains another issue to check when a ticket points to the wrong configuration item.
| Stack configuration | Question to test in the audit |
|---|---|
| Monitoring only | Which ownership and dependency questions required people or remained unanswered? |
| Monitoring plus a CMDB without current discovery | Could responders verify records, and when were those records last updated? |
| Monitoring plus a discovery-fed CMDB | Were relevant records accessible, current enough, and linked to the incident workflow? |
Compare the results for your own incidents rather than assuming that one configuration will answer every question. A discovery-fed CMDB still depends on discovery coverage, maintained service definitions, and people who confirm ownership. Use gaps in those inputs to prioritize the next improvement.
Monitoring and CMDB Incident Correlation Examples
The examples below are illustrative and depend on the records being available and correctly linked.
- Application errors share a DNS dependency. Monitoring shows errors across several applications. A maintained relationship record may show that they use the same DNS service, giving responders a shared dependency to investigate.
- A monitored host lacks an owner tag. The monitoring alert identifies the host. A maintained CI record can show its confirmed owner and the business service it supports.
- Alerts follow a change window. Monitoring shows when symptoms appeared. A linked change record can help responders investigate whether the change affected the same component, without proving causation by itself.
- An unmonitored switch sits on a shared path. Servers report timeouts. If discovery has recorded the switch and its connections, the relationship record can reveal a common path for investigation.
What Virima Supplies, and What Your Monitoring Tools Still Do
Monitoring tools detect symptoms through the metrics, logs, and traces they cover. Virima can add discovery-sourced records and service relationships to incident workflows. Teams can inspect Trusted Runtime Truth for what exists, how components connect, what changed, what could be affected, who owns the service, and where those records are maintained.
Virima supports agentless probes, agents, and cloud API discovery for AWS and Azure. Discovery runs in scheduled cycles, with cadence configured by the team. Source and timing information help responders assess the records available to them. Coverage and freshness depend on the configured sources and schedule.
ViVID™ builds service dependency maps after your team supplies service definitions. Definitions can be entered manually, imported through a spreadsheet, or supplied through an integration. The resulting maps help teams inspect recorded paths from infrastructure to business services.
Virima supports alert and incident correlation with configuration items and affected services. Your team can also use ITSM integrations to bring asset context into supported workflows. ServiceNow, Jira Service Management, Ivanti, HaloITSM, Xurrent, Hornbill, and TeamDynamix are listed in the integrations hub. Available workflow details depend on the integration and its configuration.
Your existing monitoring tools continue to detect the conditions they cover. Your chosen service management workflow remains the place to coordinate assigned tickets and changes. Check the integrations and records used in your environment before assuming an incident will arrive with every relationship attached.
A Five-Step Way to Close the Gap
Turn the audit into a short improvement cycle with a named owner for each action. Keep the evidence from the first review so the team can compare it with a later incident.
- Select three incidents: choose recent major incidents with accessible notes and relevant responders.
- List the questions: capture the questions asked in the first 30 minutes of each incident.
- Tag the answers: identify whether each answer came from a tool, a person, or neither.
- Identify the missing record: assign questions to ownership, service, dependency, change, or another appropriate category.
- Address the most frequent gap: agree who will update or confirm the records, then repeat the audit after another incident.
For dependency gaps, review the service definitions and the infrastructure connections that matter to the incident. For ownership gaps, ask the relevant team to confirm the owner and update the record. Establish a review cadence so that the field remains useful after personnel or infrastructure changes.
If an answer was slow because responders could not locate it, improve access as well as the record itself. An accurate relationship hidden outside the incident workflow can still lead the team back to chat. Test whether an on-call engineer can reach the relevant information from the tools used during a page.
Replay One Incident With Us
Bring a recent incident and review the questions that required ownership or dependency context. Schedule an incident-context demo to explore those records with our team.
Frequently Asked Questions
Do I need to replace monitoring tools to use a CMDB?
Monitoring tools can continue detecting symptoms and raising alerts. A maintained CMDB can add ownership, service, and dependency records that responders use alongside those alerts, depending on the integrations and data available.
How is an APM service map different from a CMDB?
An application performance monitoring map typically reflects instrumented application dependencies. A CMDB can also contain infrastructure, ownership, and change relationships, depending on its discovery coverage and the records maintained by the organization.
How can I tell whether my CMDB supports incident response?
Replay recent incidents and check whether responders could find and trust relevant owner, service, and dependency records. Compare the answers with incident notes and identify stale, missing, or inaccessible fields.
How does Virima build service maps for incident investigation?
Your team supplies service definitions through manual entry, import, or an integration. ViVID™ uses those definitions to build dependency maps that responders can inspect alongside the available configuration records.
Can Virima work alongside existing incident tools?
Virima supports integrations with several service management platforms and can add configuration context to supported workflows. The records and workflow available to responders depend on the integration, configuration, and discovery coverage.