CMDB for Chicago Rail and Distribution Networks

Six of North America’s seven Class I railroads meet in Chicago. When one of the smaller networks tried to finish a 2025 merger integration — part of Canadian Pacific Kansas City’s (CPKC) post-merger integration work, per secondary trade coverage — freight cars sat still for months because location and asset records did not match across systems. Congestion spread across Louisiana, eastern Texas, and Mississippi while operators corrected data by hand. Chicago’s rail freight and retail distribution operators face the same structural issue on different clocks: asset and configuration records assembled through decades of mergers and multi-site expansion that do not reconcile when operations need them. CMDB for Chicago’s rail and distribution networks means reconciling exactly that kind of fragmented asset and configuration data with a configuration management database (CMDB) built for distributed, merger-prone networks, not a generic inventory list — before the next merger, cutover, or peak-season surge causes the same stall.
Chicago runs on more freight rail and warehouse density than anywhere else in America
Metro Chicago is the physical junction of the U.S. freight system. According to the Chicago Metropolitan Agency for Planning, roughly one in four U.S. freight trains and about half of intermodal trains move through the region, and six Class I railroads converge here. Freight-dependent industries (manufacturing, construction, retail, and wholesale) account for more than a quarter of regional employment and more than $158 billion in annual regional economic contribution. About $3 trillion in goods move through the region each year across roughly 1.1 billion square feet of industrial space.
The Association of American Railroads documents the same concentration through the Chicago Region Environmental and Transportation Efficiency (CREATE) program — a public-private partnership funding rail and grade-crossing upgrades across the region. World Business Chicago ranks the region first nationally across several logistics measures:
- More than 17,183 transportation, distribution, and logistics businesses (first nationally)
- More than 266,000 logistics jobs (second nationally)
- More than $39 billion in sector output (third nationally)
- O’Hare International Airport as the nation’s busiest cargo airport
Those figures explain why Chicago logistics IT is not a scaled-up version of a single-site data center problem. The density of carriers, yards, terminals, and distribution centers multiplies every gap in asset and configuration records. Teams weighing where to start often benchmark against IT asset management service for enterprises: How Virima ITAM shines before scoping a pilot.
Why is Chicago the largest freight rail hub in the U.S.?
Chicago concentrates six of seven Class I railroads at one interchange, moves about one in four U.S. freight trains and half of intermodal traffic, and anchors the nation’s largest count of transportation and distribution businesses. That carrier and warehouse density makes unreconciled asset records an operational continuity risk, not only an IT hygiene issue.
Why Chicago’s scale creates a distinct enterprise IT problem, not a bigger version of the usual one
Class I railroads, national third-party logistics providers, and large retail distribution operators headquartered or hubbed in Chicago run IT and operational technology (OT) environments across intermodal yards, terminals, and distribution centers. Those environments are rarely designed as one estate. Rail consolidation over three decades — Union Pacific-Southern Pacific, Conrail, CPKC, and the pending Union Pacific-Norfolk Southern combination — left successive generations of asset records, yard systems, and facility devices. Retail and e-commerce expansion added multi-site warehouse management system (WMS) instances, automation controllers, and sensors under different ownership timelines.
CREATE partners have described the Chicago terminal complex as handling on the order of 1,300 trains per day and roughly one-quarter of national rail cargo. These are public baseline figures from Cook County and CREATE partner materials — treat them as a recurring capacity baseline rather than a single current-year census. When six carriers and hundreds of industrial sites share that junction, each inherited spreadsheet, CMDB fragment, and OT inventory becomes a reconciliation problem. The failure mode is not a missing ticket field. It is an unknown dependency between a change window in one system and a physical asset that still needs to move freight or pick orders.
IT leaders evaluating IT discovery and ITOM for transportation and logistics networks need coverage that reaches yards and DCs, not only the core data center.
The failure pattern: when asset records do not reconcile, freight stops moving
Rail IT systems are operationally load-bearing. When an asset’s record falls out of sync with its physical location, that asset does not move. Industry analysis of recent merger integrations (including secondary trade coverage of CPKC’s 2025 work) describes cars immobilized until location and asset data were corrected manually, with multi-month congestion effects across connected corridors. Historical precedent points the same way. The Union Pacific-Southern Pacific integration of the late 1990s required multi-year Surface Transportation Board attention, and the 1999 Conrail split left Norfolk Southern with IT problems that took years to stabilize.
The pending Union Pacific and Norfolk Southern combination, framed publicly as America’s first true transcontinental railroad, again places Chicago at the center of the operating case. Union Pacific has described single-line service conversion at national scale. Local commentary, including a May 2026 Chicago Sun-Times op-ed, treats Illinois hub status as central to the merger narrative. Whatever the final regulatory path, integration will force the same question every prior rail combination forced: whose asset record wins when two estates disagree.
A CMDB that auto-populates configuration items (CIs) and applies authority rules for conflict resolution (instead of last-scan-wins) is the general answer to that class of problem: it replaces scan-order guesswork with one reconciled record set during cutovers. That framing applies industry-wide. It is not a claim that any named railroad used or avoided a specific vendor during past integrations.

Teams that want discovery-sourced trusted runtime truth before the next integration window can start by mapping which systems own location, ownership, and dependency data today. This related read on blog post on keeping CMDB data accurate through M&A integrations walks through the same reconciliation problem in a non-rail context.
On the retail distribution side, the same root cause has a shorter fuse
Chicago’s industrial corridor packs distribution centers next to rail and air cargo. Those sites run WMS platforms, conveyors, robotics, scanners, and cloud-connected control planes. Recent warehouse research reported by FreightWaves (citing Synergy Logistics) found:
- 84% of warehouse organizations experienced at least one significant disruption in a 24-month window
- Downtime costs often cited between $5,000 and $100,000 per hour
- Nearly half of operators reported idled automated assets during outages
These are national figures, not Chicago-only measurements. They still describe the risk profile for operators in the dense Chicago corridor.
Partial, or degraded, outages often hurt more than clean full shutdowns. When only part of a cloud-connected stack fails, floor supervisors cannot tell which lanes, sorters, or label paths still have a valid dependency path.
The root cause matches the rail-merger pattern: no reliable, current record of which assets and dependencies exist where. Freight cars wait for corrected location data. Warehouse automation waits for someone to rebuild the blast radius by hand.
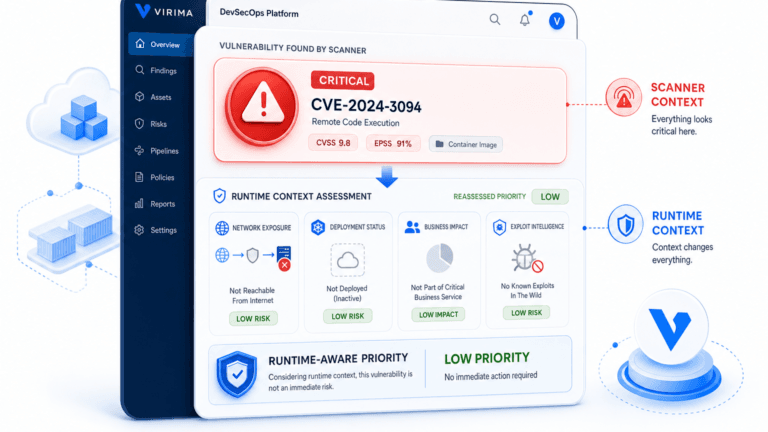
IT discovery that reaches physical, virtual, cloud, and OT/IoT devices, paired with service maps once business service definitions are supplied, is how teams scope response instead of freezing a whole facility. ViVID™ builds application-to-infrastructure dependency maps after service composition is defined (manually, by spreadsheet import, or via an architecture feed). The automation is map building and refresh against discovered infrastructure, not automatic invention of which apps constitute each business service.

What a CMDB built for this environment needs to do
For operators whose footprint spans the six-carrier Chicago junction and the surrounding distribution corridor, capability requirements stay concrete.
Discovery reach, CI accuracy, and audit history
Discovery needs to reach the sites where freight moves, not stop at the core data center. Agent-based and agentless methods (including SNMP, WMI, SSH, and ICMP) plus API-based cloud collection should cover servers, network gear, virtual machines, AWS and Azure workloads, and OT/IoT devices at yards and DCs. Scheduled discovery cycles keep the inventory current. Virima does not claim passive real-time event streaming in current product language.
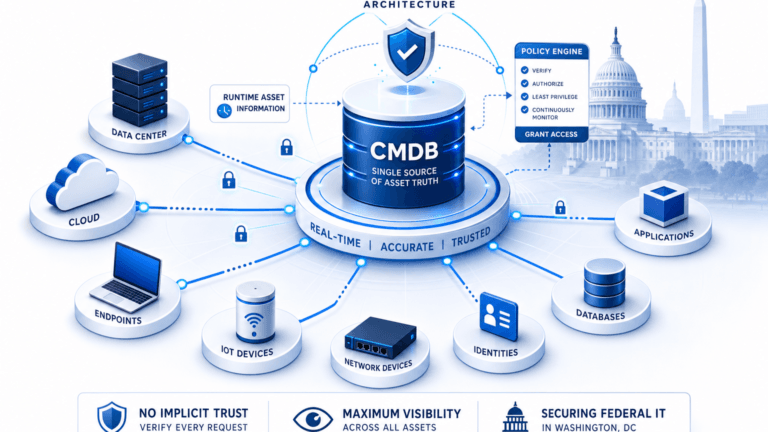
CMDB auto-population with authority-rule conflict resolution. Merger and multi-site rollouts produce duplicate CIs. Last-scan-wins logic encodes luck, not governance. Authority rules decide which source wins for each attribute so integration teams work from one reconciled set.
Audit history needs to support change governance, not just log entries. ITIL-aligned history on CI changes helps internal change advisory boards and the scrutiny that large integrations attract. The CMDB records what changed and when. It does not replace legal or regulatory filings.
Service mapping and ITSM connectivity
Service mapping for pre-change blast radius. Once service definitions exist, ViVID™ maps dependencies so a WMS cutover, yard system upgrade, or network change shows what else sits in the path. That is the difference between a planned window and a surprise idle on automation.
A connective layer into existing ITSM tools matters just as much as discovery itself. Many Chicago-hub operators already run ServiceNow, Jira Service Management, Ivanti, HaloITSM, Xurrent, Hornbill, or TeamDynamix after successive acquisitions. Virima integrates as an enhancement layer that feeds discovered CIs and relationships into those platforms through one integrations hub, rather than forcing a single ITSM standard company-wide. Partner names stay plain text. The product surface that supports this path includes CMDB, IT Discovery, service mapping, and ITOM views for operations teams.
What does CMDB auto-population with authority rules mean?
When railroads or retail distribution networks merge or add sites, duplicate configuration items are inevitable. Authority-rule conflict resolution assigns a winning data source per attribute — location, ownership, or status — instead of trusting whichever system scanned last. That gives integration teams one reconciled asset record instead of scan-order guesswork during a cutover.
Language stays scoped. Discovery and mapping can reduce blind spots and help identify impact paths. They do not eliminate every outage or guarantee merger outcomes.
What should a CMDB for multi-site rail and distribution networks include?
It should combine scheduled multi-method discovery across IT and OT assets, authority-rule CI reconciliation after mergers or multi-site rollouts, change audit history, and service dependency maps built from defined business services. Together those functions give cutover teams a reconciled inventory and a scoped blast radius instead of last-scan guesswork.
Where Chicago rail and distribution teams should start
CMDB for Chicago’s rail and distribution networks starts small, not with an enterprise-wide rewrite. Scope discovery to one distribution corridor, one intermodal complex, or one merger-affected system group. Establish which sources feed location, ownership, and dependency data. Apply authority rules on the first conflicting attributes you find. Define the business services that matter for the next cutover or peak-season window, then build ViVID™ maps against discovered infrastructure. Use that map in the change window, not after the outage call.
Peak season and merger calendars compress decision time. A corridor-scoped pilot produces evidence faster than a multi-year platform debate. Operators who already own an ITSM stack can keep it and improve the data layer underneath.
Frequently Asked Questions
What happens to IT systems during a railroad merger?
Merged railroads inherit duplicate asset records, yard systems, and facility devices from each predecessor. Until location, ownership, and configuration data reconcile, cars and work orders can stall because operational systems disagree on what exists where. Historical integrations show multi-month to multi-year recovery when records stay fragmented.
How do warehouse management system outages affect distribution centers?
National warehouse research reports frequent significant disruptions, hourly downtime costs that can reach five figures or more, and idled automation when dependencies are unclear. Partial outages are especially costly because floor teams cannot see which zones still have valid paths. Current asset and dependency records shorten that guesswork.
Why does OT and IT convergence matter for warehouse automation?
Conveyors, robotics, sensors, and controllers sit on the same operational path as WMS and network infrastructure. If discovery stops at servers, automation devices stay invisible until an outage. Extending inventory and dependency maps to OT and IoT devices helps teams scope impact across both layers.
Does Virima integrate with the ITSM platform we already use, like ServiceNow or TeamDynamix?
Yes. Virima integrates as an enhancement layer, not a replacement, feeding discovered CIs and relationships into ServiceNow, Jira Service Management, Ivanti, HaloITSM, Xurrent, Hornbill, or TeamDynamix through one integrations hub. Chicago-hub operators running mixed ITSM stacks after acquisitions can keep their existing platform and improve the data layer underneath it.
How does Virima support CMDB automation for multi-site logistics networks?
Virima combines scheduled multi-method IT discovery, CMDB auto-population with authority-rule conflict resolution, ViVID™ service mapping after service definitions are provided, and integrations into common ITSM platforms. Chicago-hub rail and distribution teams can pilot one corridor or merger-affected group, then expand with evidence from that scope.