How to Overlay ITSM Incidents and Vulnerabilities onto Your IT Service Map for Faster Root Cause Analysis
Root cause analysis (RCA) is one of IT operations’ most time-critical activities, and one of its most poorly supported. When a business service goes down, the team on call opens a queue of alerts, checks monitoring dashboards, and attempts to reconstruct the dependency chain from memory, documentation, or escalation calls to other teams. The service map, the one visual that would answer the question “what depends on what and what is currently broken,” is rarely at hand.
This is the root cause analysis bottleneck. It is not a skill gap or a staffing gap. It is a visibility gap. Teams that manage incidents without a live, dependency-accurate service map work harder, take longer, and escalate more than teams that can see the full infrastructure context on a single screen.
Virima 6.1.1 addresses this directly. ViVID Service Mapping overlays active ITSM incidents and NIST NVD vulnerability data onto the service map in real time, so incident responders and change managers see the full operational context alongside the dependency structure they need to make decisions.
Why Traditional Incident Management Lacks Visual Context
Standard ITSM platforms excel at process orchestration: ticket routing, SLA tracking, escalation rules, and knowledge management. What they do not provide natively is a visual map of the infrastructure context surrounding an incident.
When a ticket fires for a degraded application, the ITSM record contains the alert description, the affected CI (if correctly populated), and the assignment group. It does not show which other services depend on the affected CI, which upstream CI is the probable cause, or whether another team already has an incident open on a related component.
The responder must gather this context manually. They query the CMDB, pull network diagrams, check monitoring for adjacent systems, and ask colleagues. This context-gathering phase is often the longest part of an incident timeline. Studies of incident management in enterprise environments consistently show that the time from detection to root cause identification, not the time from root cause to remediation, drives most of mean time to resolution (MTTR).
Visual context, specifically a live service map that shows the dependency chain and active incidents simultaneously, compresses that context-gathering phase from minutes or hours to seconds.
What ITSM and CMDB Service Map Integration Looks Like
Virima ViVID integrates with both the native Virima ITSM module and third-party ITSM platforms, including ServiceNow, Ivanti, Jira, Xurrent, HaloITSM, Hornbill, and TeamDynamix.
How the CI-Level Integration Works
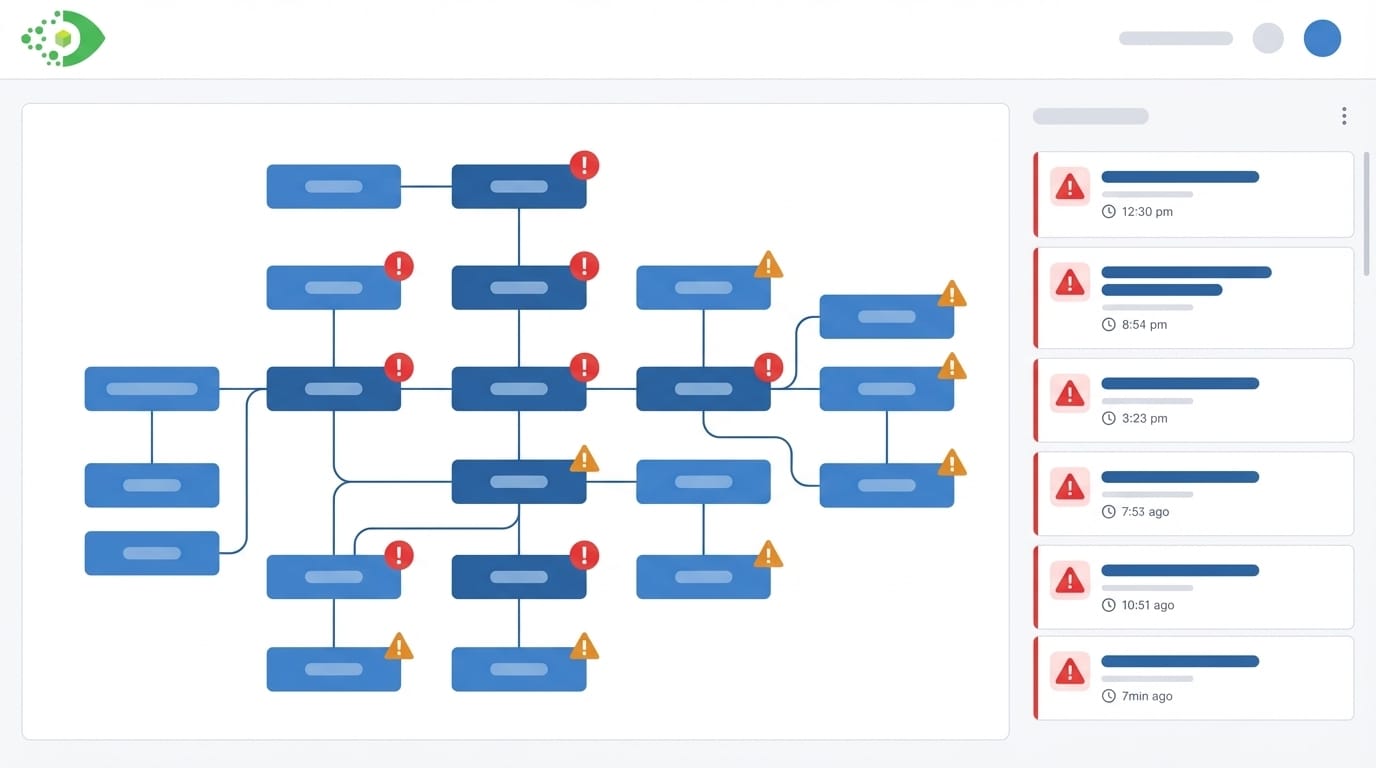
The integration works at the CI level. When an incident record in the ITSM system links to a CI that exists in the Virima CMDB, ViVID reflects that relationship on the service map. The CI node in the ViVID visualization carries an incident indicator: a visual badge or highlight that signals an active or recent incident on that specific configuration item.
This means that when an incident responder opens the ViVID service map for an affected business service, they see the full dependency graph with incident indicators on every CI in that graph that currently has an open ticket. If three CIs in the same dependency chain all have active incidents, all three appear highlighted simultaneously. The pattern those highlighted nodes form in the dependency graph tells the responder whether the incidents are isolated or whether they share a common upstream cause.
How Bidirectional Enrichment Connects CMDB and ITSM Data
The integration is bidirectional in the sense that CI data from the CMDB enriches the ITSM incident record (the responder knows the full context of the affected CI: what it runs on, what depends on it, what other services share its infrastructure) while ITSM incident data enriches the CMDB service map (the map shows operational reality, not just architectural intent).
Overlaying Vulnerabilities on the Service Map
The vulnerability overlay in ViVID connects NIST National Vulnerability Database (NVD) data to the CI records in the Virima CMDB. When Virima Discovery identifies the software versions installed on a CI, the NVD integration cross-references those versions against known CVEs. CIs with matched vulnerabilities receive vulnerability indicators on the ViVID service map.
What the Vulnerability Overlay Reveals at a Glance
The visual result is a service map that simultaneously shows the dependency structure and the vulnerability status of every CI in that structure. A security analyst or IT operations manager looking at the service map for a business-critical service can immediately see:
- Which CIs in the dependency chain have open vulnerabilities
- The severity of those vulnerabilities (surfaced through CVE data from NIST NVD)
- How central those vulnerable CIs are to the service, based on their position in the dependency graph
Why CVSS Scores Alone Miss Operational Risk
This combination solves a core problem in vulnerability management: CVSS scores rank individual CVEs but say nothing about the operational importance of the asset that carries the vulnerability. A CVSS 8.0 CVE on an isolated test server is less urgent to patch than a CVSS 6.0 CVE on a server that sits at the base of five critical production services. The ViVID vulnerability overlay makes that distinction visible without requiring a separate risk-ranking spreadsheet exercise.
How This Accelerates Root Cause Analysis: A Step-by-Step Walkthrough
Consider a scenario common in enterprise IT environments. A business service, a customer-facing order management application, begins throwing errors at 2:47 p.m. The ITSM platform auto-creates an incident and assigns it to the application team.
Without ViVID: The Manual Context-Gathering Workflow
Without ViVID, the responder’s workflow looks like this: Check the application logs. Find errors referencing a database connection timeout. Query the CMDB to find which database server the application depends on. Log into the database server monitoring system. Discover the database server is running at 95% CPU. Check which other applications share that database server. Find three other applications. Call those application teams. Confirm all four are affected. This process takes 25 to 40 minutes in a typical enterprise environment.
With ViVID: Root Cause Identified in Under Two Minutes
With ViVID incident overlay, the workflow looks like this:
- The responder opens the ViVID service map for the Order Management service. The incident indicator appears immediately on the application CI.
- The service map shows the full dependency chain. The responder sees that the application’s database server, two hops upstream, also carries an incident indicator, flagged by the database team’s monitoring alert that fired three minutes before the application alert.
- The blast radius is visible: three other applications share that database server. All four are in the dependency map, all four show degraded status indicators.
- The responder identifies the database server as the probable root cause within 90 seconds of opening ViVID. They escalate directly to the database team with the specific CI, the affected applications, and the dependency evidence.
The context-gathering phase collapses from 25 minutes to under 2 minutes. The responder never leaves the ViVID interface to gather that information. For deeper reading on Virima’s approach to incident root cause analysis, see Elevating IT Incident Management with Virima’s Root Cause Analysis.
Using the Overlay for Change Risk Assessment
The incident and vulnerability overlay serves an equally important function outside of active incidents: pre-change risk assessment.
Before a change advisory board (CAB) approves a change request, the change manager opens the ViVID service map for the CI targeted by the change. The overlay shows two categories of risk that the change plan must account for:
Open Incidents
If the target CI or any CI in its immediate dependency neighborhood currently has an active incident, the change carries compounded risk. A change to an already-degraded component can worsen the incident or mask the root cause. ViVID surfaces these open incidents on the map before the change window begins.
Open Vulnerabilities
If the target CI carries unpatched vulnerabilities, the change assessment must consider whether the change interaction creates additional risk. Conversely, if the change is a patch that resolves a vulnerability, ViVID confirms which vulnerability indicators will clear after the patch applies, providing a visual measure of the change’s security value.
Pending Changes on Dependent CIs
If another change is already scheduled on a CI that this change’s target depends on, scheduling both in the same window without coordination creates risk. ViVID shows the dependency relationships that make such coordination possible.
The combined overlay turns the service map from a documentation artifact into a live risk assessment tool. Change managers who use ViVID in the pre-change review phase make change decisions with evidence, not assumptions.
How ViVID Bridges the Gap Between ITSM Process and Infrastructure Reality
The gap between what ITSM tools manage (processes, tickets, SLAs) and what IT operations teams need during incidents and changes (live infrastructure context, dependency chains, active risk indicators) is where most enterprise IT inefficiency lives. Virima 6.1.1 closes that gap by bringing incident records, vulnerability data, and CMDB relationship maps together in a single visual interface.
For IT teams that manage complex, interdependent environments and need faster RCA, more confident change decisions, and a clearer picture of operational risk, the ViVID incident and vulnerability overlay provides that clarity without adding process overhead.
Schedule a Demo at virima.com to see how ViVID overlays incidents and vulnerabilities on your live service map.
Frequently Asked Questions
What is an ITSM service map incident overlay? An ITSM service map incident overlay is a visualization feature that displays active incident records from an ITSM platform directly on a CMDB service map. In Virima ViVID, incident indicators appear on CI nodes in the service map when those CIs have linked active incident records in connected ITSM systems such as ServiceNow, Ivanti, Jira, Xurrent, HaloITSM, Hornbill, or TeamDynamix. This allows responders to see the full dependency chain and active incidents simultaneously.
How does NIST NVD data appear in a CMDB service map? Virima Discovery identifies software versions on discovered CIs and cross-references them with the NIST National Vulnerability Database (NVD). When a CVE match is found, ViVID displays a vulnerability indicator on that CI’s vulnerability overlay service map node in the service map. This allows security and operations teams to see which CIs in a service dependency chain carry open vulnerabilities and prioritize remediation based on both itsm incident service map overlay CVE severity and the operational criticality of the affected CI.
How does a service map reduce mean time to resolution (MTTR)? A live service map with incident overlays compresses the context-gathering phase of incident response by presenting the full dependency chain and all active incidents simultaneously. Responders identify the service map incident visualization probable root cause CI and the blast radius within seconds rather than minutes, without querying multiple systems or consulting colleagues. This visual acceleration of the RCA process is the primary mechanism through which service maps root cause analysis service map reduce MTTR in enterprise IT environments.