What Is ViVID Service Mapping? How Virima Visualizes IT Service Dependencies
What Is ViVID Service Mapping in Virima?
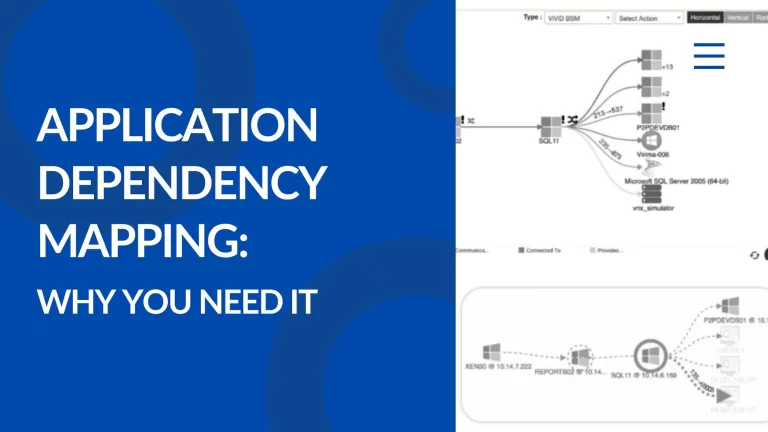
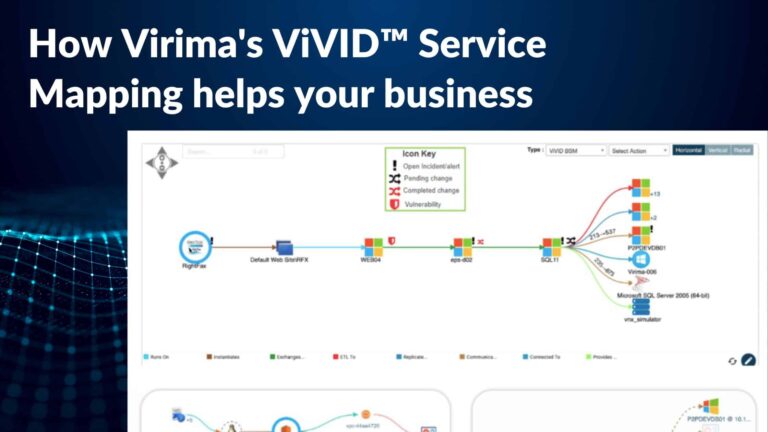
ViVID service mapping is a dynamic visualization layer built on the Virima CMDB. It renders the CI relationships that Virima Discovery detects as interactive service topology maps. These relationships include which applications run on which servers, which hosts communicate with other hosts, and which services depend on shared infrastructure.
Gartner’s September 2025 research on IT dependency mapping found that infrastructure and operations leaders often struggle to realize value from these tools when service definitions are maintained separately from discovery data. ViVID avoids that problem because it reads directly from the same CMDB that Virima Discovery populates, so the topology you see matches what discovery found.
ViVID is not a static diagram tool. It reflects the current state of the CMDB, which Virima Discovery keeps accurate through high-frequency discovery cycles. When your infrastructure changes, the service map updates with it. Your team sees how things actually connect, not how they were documented months ago.
How Does ViVID Build IT Service Maps?
ViVID does not perform its own discovery. Instead, it visualizes the relationship data that Virima Discovery collects. Virima Discovery scans your IT environment using agentless and agent-based techniques to detect CIs and their relationships. It identifies what software runs on which hardware, which workloads run on which hypervisors, and how network devices connect.
Every relationship that Discovery detects populates the Virima CMDB. ViVID service mapping reads that data and renders it as a topology map. Because Discovery runs on high-frequency cycles, your maps reflect the current state of your environment rather than a historical snapshot.
What Types of Relationships Does ViVID Show?
ViVID visualizes all CI relationship types that Virima Discovery detects and stores in the CMDB. You can filter the ViVID service mapping view by relationship type, CI class, or service context. Here are the main relationship types:
- Runs On: An application or service runs on a specific server or virtual machine.
- Communicates With: A host actively communicates with another host on the network.
- Connected To: A physical or logical network connection between two devices.
- Installed On: Software installed on a hardware or virtual CI.
- Component of: A CI that is a sub-component of a larger service or system.
- Hosted On: A workload hosted on a cloud or hypervisor platform.
- Virtualized On: A virtual machine running on a specific hypervisor.
- Load Balancer For: A load balancer distributing traffic to a pool of application servers.
This lets you focus on the part of the topology most relevant to your current task.
What Is a Ghost Machine in ViVID’s Communication View?
A ghost machine is a device that shows up in active network traffic data but has no matching CI record in the Virima CMDB. In ViVID service mapping, ghost machines appear as visually distinct nodes in the host-to-host traffic diagram. They are flagged because the device communicates on the network, but your team has no formal record of it.
Ghost machines exist for several reasons. A server was decommissioned in the asset register but never physically removed. A developer provisioned a test VM outside the formal request process. A vendor left management hardware on the network. Or an unauthorized device connected to an internal segment.
Ghost machines are change management risks because they fall outside patch management, endpoint security, and formal change approval processes. ViVID surfaces them by comparing observed communication traffic against CMDB CI records. Your team can then investigate and remediate.
How Does ViVID Help with Incident Root Cause Analysis?
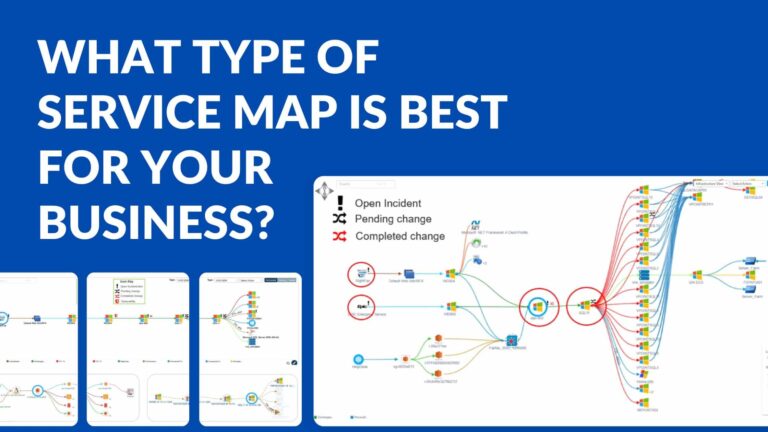
When an incident record in a connected ITSM system links to a CI in the Virima CMDB, ViVID service mapping displays an incident indicator on that CI’s node in the topology. An incident responder opening the map for an affected business service sees the full dependency chain immediately. Active incidents appear as badges on every affected CI.
This visual pattern reveals whether incidents are isolated or connected to a shared upstream cause. If a database server upstream of three affected applications carries incident indicators, you spot the probable root cause CI quickly. You do not need to reconstruct the dependency chain manually.
ViVID supports horizontal, vertical, and radial layout options. This lets you orient the dependency graph in whichever direction your topology flows.
| Ready to see your IT environment as an interactive service map? Schedule a demo to explore ViVID in your own infrastructure. |
How Does ViVID Support Change Impact Analysis?
Before approving a change, the change manager opens the ViVID service map for the CI targeted by the change. ViVID renders the full downstream dependency chain: every CI that runs on, communicates with, or depends on the target CI. This gives you a clear view of what is at risk before the change windows open.
ViVID service mapping also highlights whether any dependent CIs have active incidents or scheduled updates. This context helps you plan the change window more carefully and reduces the chance of a surprise outage. You can filter the blast radius view by relationship type, such as “Communicate With” or “Run On,” to focus on the most relevant dependencies.
Discovery-driven data powers every step of this analysis. You get an accurate dependency context without a separate documentation layer.
How Does ViVID Show Vulnerability Data?
ViVID integrates with the NIST National Vulnerability Database (NVD). Virima Discovery identifies the software versions installed on each discovered CI. The NVD integration cross-references those versions against known CVEs and surfaces matches as vulnerability indicators on the map.
Security operations teams and IT asset management leaders use the vulnerability overlay to prioritize remediation based on asset criticality. A server supporting five critical business services with a moderate-severity CVE is a higher remediation priority than an isolated server with a high-severity CVE. ViVID service mapping makes this risk hierarchy visible in a single view.
What ITSM Platforms Does ViVID Integrate With?
ViVID service mapping integrates with the native Virima ITSM module and the following third-party platforms:
ServiceNow
servicenow enables bidirectional CMDB sync. Incident and change records flow between ServiceNow and Virima, enriching the ViVID map with operational status indicators.
Ivanti
ivanti connects Ivanti’s ITSM workflows with Virima’s discovery and service mapping data. Ivanti users get dependency context directly within their service management environment.
Jira Service Management
jira-service-management pairs Atlassian’s service management platform with Virima’s CMDB. Jira users get CI relationship data and ViVID visualizations alongside their incident and change workflows.
Xurrent
xurrent connects Xurrent’s enterprise service management workflows with Virima’s CMDB and ViVID service maps.
Halo
haloitsm brings Virima’s discovery-driven CI data and service context into Halo’s incident and change management workflows.
Hornbill
Hornbill integration gives Hornbill users access to Virima’s CMDB data and ViVID service maps for more informed service management decisions.
TeamDynamix
TeamDynamix integration extends Virima’s CMDB and ViVID service mapping capabilities into the TeamDynamix service management environment.
These integrations allow incident records, change records, and service relationships to flow between the connected ITSM platform and the Virima CMDB. CI data enriches ITSM records with dependency context. ITSM incident and change data, in turn, enriches the ViVID map with operational status indicators.
Why ViVID Service Mapping Gives IT Teams a Single Source of Visual Truth
ViVID service mapping in Virima gives IT operations, security, and change management teams a single, accurate visual interface. You can understand service relationships, investigate incidents, assess change risk, and prioritize vulnerability remediation from one view. Because ViVID reads from the Virima CMDB, and Virima Discovery keeps that CMDB current through scheduled discovery cycles, the map reflects how your environment actually works today, not how it was documented months ago.
| See ViVID service mapping in your own environment. Schedule a demo today. |