Why ITOM Fails, And How to Fix It

An enterprise operations center integrates ten specialized monitoring feeds into a modern IT operations management platform. Within hours, the ingestion engine ingests tens of thousands of event records across cloud instances, on-premises hosts, network interfaces, and container clusters. Operational dashboards immediately light up with streaming event counters, latency sparklines, and automated notification streams. Yet when a high-priority business service suffers performance degradation, operators face the exact same manual troubleshooting bottlenecks they endured before the platform deployment.
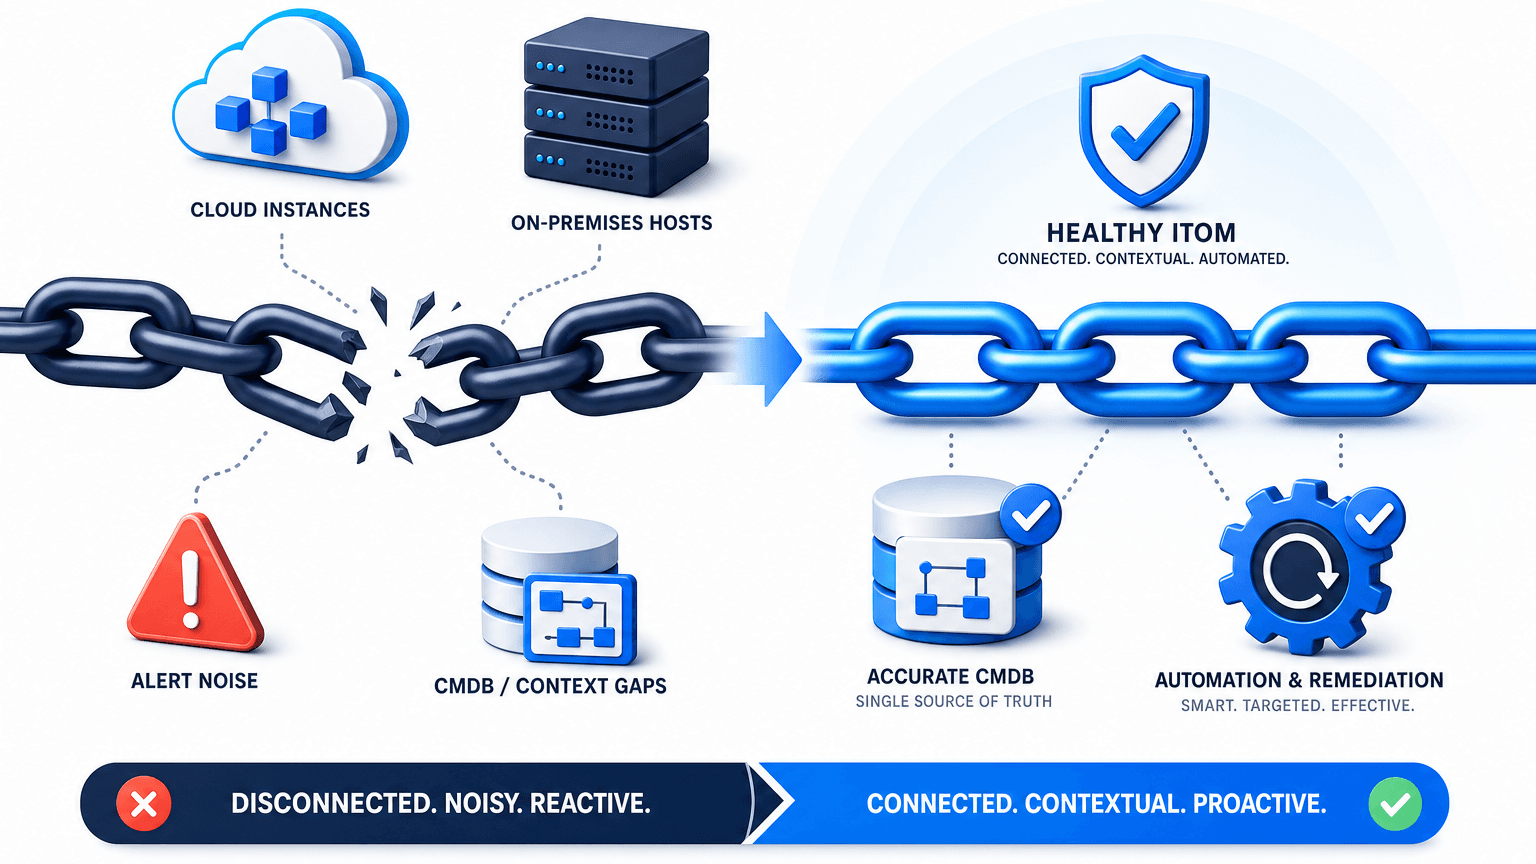
The technical mechanics of the software ingestion pipeline operate properly. The operational model underneath those incoming signals remains unviable. Incoming alerts fail to attach to configuration items, event deduplication engines produce duplicate records, and service-impact calculators display question marks because underlying topology relationships do not exist. Operations teams quickly realize that most IT operations management breakdowns are context failures disguised as automation failures. Understanding why ITOM fails requires examining how upstream configuration data, relationship models, and event metadata directly govern the viability of downstream operational workflows.
Failure starts when ITOM becomes another monitoring console
Organizations routinely invest in ITOM under the assumption that centralizing monitoring alerts into a single pane of glass will create immediate operational intelligence. If an implementation merely routes alerts into a unified dashboard, the organization has simply built a more expensive alert inbox.
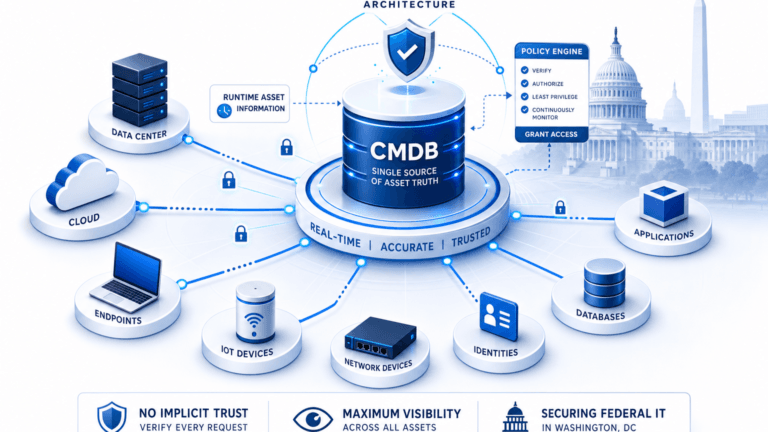
Monitoring systems generate telemetry signals that reflect immediate technical states. In contrast, IT operations management must explain what those signals mean to business operations. According to official ServiceNow ITOM architecture documentation, event management functions by transforming raw telemetry events into structured alerts that bind directly to configuration items within the configuration management database. When an ITOM deployment omits that translation layer, teams drown in raw telemetry without gaining actionable service intelligence.
Why does centralizing monitoring tools inside ITOM fail to solve incident bottlenecks?
Centralizing alerts merely aggregates raw technical telemetry without providing operational context. Unless an ITOM platform binds those incoming events to verified configuration items and maps their downstream service dependencies, operations teams remain buried under uncoordinated alert noise without clear business impact visibility.
Bad CMDB data quietly breaks everything downstream
The fundamental dependency chain of IT operations management is deterministic and unforgiving:
Stale CI record
→ Failed alert binding
→ Weak event correlation
→ Incorrect incident assignment
→ Incomplete service impact assessment
→ Destructive automated remediation
When an incoming alert cannot match an authoritative record in the configuration database, the event engine cannot determine who owns the asset or what business application it supports. Technical guidance from ServiceNow Event Management emphasizes that alert-to-CI binding should approach 100 percent because binding directly powers automated grouping, root-cause identification, and task routing. When configuration data is inaccurate or stale, every downstream operational workflow built on top of that data inevitably breaks down.
Review how Trusted Runtime Truth provides the discovery-sourced operational foundation that keeps configuration items aligned with live runtime reality.
Discovery cannot be a one-time implementation task
Many enterprise ITOM initiatives treat infrastructure discovery as a one-time onboarding milestone. Project teams deploy discovery probes during the initial rollout, populate the configuration database, configure initial alert rules, and declare the deployment complete.
Modern IT environments evolve continuously across hybrid infrastructure fabrics. Cloud engineering teams spin up virtual compute instances, Kubernetes clusters automatically reschedule pods across nodes, developers push microservice updates, and network engineers reconfigure virtual routing tables. Within weeks of an initial rollout, a static configuration repository diverges substantially from production reality. Effective IT operations management requires continuous discovery that runs scheduled discovery scans to capture configuration drift and update relational records on high-frequency discovery cycles.
Alert volume is not the real alert-noise problem
Operational teams frequently complain about alert fatigue, pointing to tens of thousands of event notifications streaming across their consoles every day. Project managers often attempt to resolve this challenge by implementing arbitrary alert threshold adjustments or crude suppression rules.
High alert volume is merely a visible symptom of a deeper architectural deficit. A single storage controller failure or network switch reboot can trigger three thousand discrete alerts across hundreds of connected virtual machines and application components. The underlying challenge is not the total volume of signals. The real issue is uncorrelated volume. As documented in ServiceNow Alert Grouping documentation, modern event correlation platforms use topology relationships and shared configuration attributes to collapse thousands of disparate signals into a single actionable incident record. Without accurate dependency models, event engines cannot identify that those three thousand alarms describe a single underlying physical event.
Correlation fails when incoming events lack usable identity
Modern enterprise environments generate monitoring signals from dozens of disparate sources, including infrastructure agents, cloud monitoring endpoints, network sniffers, and application log forwarders. Each monitoring platform formats infrastructure identifiers according to its own internal schema.
One monitoring platform identifies a database server by its fully qualified domain name. Another system reports events using an ephemeral private IP address, while a cloud-native monitoring tool flags the asset using a cloud provider resource identifier. If an IT operations management platform lacks reliable reconciliation rules and normalized attribute extraction, it treats those three signals as three completely separate infrastructure entities. Event correlation engines fail not because their statistical algorithms are inadequate, but because the incoming payloads lack the consistent identity attributes required to bind them to a single configuration item.
Why does event correlation fail across disparate monitoring tools?
Monitoring platforms format asset identifiers differently, reporting hostnames, internal IP addresses, or cloud resource IDs. Without automated attribute normalization and reconciliation rules to bind these distinct payloads to a single configuration item, event correlation engines cannot recognize that separate alerts originate from the same physical or virtual host.
Service maps fail when they become architecture diagrams
During the initial deployment of an ITOM platform, enterprise architecture teams often construct detailed service maps to illustrate the layout of critical business applications. These diagrams typically reflect intended architectural blueprints, detailing planned network routes, database tiers, and load-balanced application pools.
Static service maps fail operationally because they describe historical design intentions rather than live production topology. According to ServiceNow Service Mapping documentation, service mapping must function as a dynamic operational model that establishes real-time relationships between active infrastructure components, running software processes, and the business services they support. When service maps remain disconnected from automated discovery scans, the platform calculates service impact based on obsolete topologies, misdirecting incident triage teams during critical production outages.
Automation fails when remediation begins before context is trustworthy
Executive leaders frequently demand rapid adoption of automated IT operations, expecting platforms to execute self-healing scripts, restart hung services, and provision additional compute resources automatically. These automated capabilities represent the ultimate promise of modern IT operations management.
Automation acts as an operational multiplier that magnifies the quality of underlying context. If an event binds to the wrong configuration record due to stale discovery data, an automated remediation script will issue restart commands to an innocent production database instead of the degraded staging node. If dependency maps are incomplete, automated incident routing sends critical severity tickets to the wrong operational engineering team. Automation does not eliminate the requirement for authoritative configuration context; it drastically increases the operational cost of data inaccuracies.
Explore how automated IT discovery builds the dynamic dependency maps required to support dependable operational automation.
Fix ITOM from the bottom up
Organizations struggling with underperforming ITOM initiatives must abandon top-down dashboard fixes and rebuild their operational framework from the ground up. Successful operations management follows a disciplined, six-stage context hierarchy:
- Discover: Execute automated discovery across all on-premises data centers, private hypervisors, and public cloud platforms on scheduled discovery scans to identify every running physical asset, virtual machine, container, and software process.
- Reconcile: Apply deterministic identification and reconciliation rules to resolve duplicate records, purge phantom entries, and establish authoritative asset join keys across disparate data feeds.
- Relate: Map the multi-tier dependencies connecting physical infrastructure, network paths, database instances, and software components into dynamic business service topologies.
- Normalize: Standardize incoming event streams from disparate monitoring tools, extracting consistent hostnames, IP addresses, and operational metrics into uniform event payloads.
- Correlate: Group related alerts into unified incidents based on verified CI bindings, shared topological paths, and active change tickets rather than raw statistical proximity.
- Automate: Introduce automated remediation workflows, self-healing actions, and automated ticket dispatch only after the underlying configuration and relationship models prove stable and trustworthy.
Adhering to this sequential workflow ensures that advanced operational features operate on top of verified infrastructure reality rather than ungrounded assumptions.
What is the correct implementation sequence to fix a failing ITOM deployment?
Organizations must repair ITOM from the bottom up: first establishing continuous discovery, reconciling duplicate asset records, and mapping application dependencies before attempting event normalization. Automated alert correlation and self-healing remediation workflows should only be deployed once underlying configuration item binding achieves high accuracy.
Measure ITOM health before measuring ITOM automation
IT leadership teams often evaluate operational success by tracking downstream performance metrics, such as the total count of automated scripts created or the sheer volume of ingested events. These superficial figures provide zero insight into whether an operational implementation is performing reliably.
Enterprise teams should govern their operations platforms by monitoring upstream operational health metrics. Key indicators include:
- Alert-to-CI Binding Ratio: The percentage of incoming alerts successfully mapped to an active configuration record (target: 95 percent or higher).
- Discovery Freshness Rate: The percentage of configuration items updated by scheduled discovery scans within the last 24 to 48 hours.
- Event Suppression and Grouping Efficiency: The ratio of raw incoming telemetry events collapsed into actionable parent incident alerts.
- Service Mapping Completeness: The percentage of tier-one and tier-two business services backed by dynamic, validated dependency graphs.
- Configuration Item Ownership Integrity: The percentage of discovered assets linked to verified operational owners and escalation groups.
Tracking these foundational indicators ensures that engineering teams identify and resolve configuration gaps before they manifest as critical operational outages.
Operational symptom, underlying problem, and corrective action
| Operational Symptom | Underlying Root Cause | Corrective Architectural Action |
|---|---|---|
| Operators overwhelmed by alert noise | Events lack topological and dependency context | Ingest monitoring feeds through relational grouping models |
| Alerts cannot attach to infrastructure assets | Inconsistent identifiers prevent CI binding | Implement standardized attribute normalization rules |
| Operations team distrusts the CMDB | Configuration data is stale, duplicate, or unverified | Deploy scheduled discovery scans with automated reconciliation |
| Business impact of outages remains unknown | Assets exist in isolation without service maps | Construct dynamic dependency maps linking CIs to business services |
| Incident tickets route to wrong engineering groups | Asset records lack verified support group metadata | Enrich configuration items with authoritative ownership details |
| Root-cause investigations require manual triage | Telemetry signals lack active change context | Overlay pending change records directly onto service dependency graphs |
| Automated remediation triggers production errors | Automation executes against inaccurate configuration data | Enforce data accuracy gates prior to activating automated workflows |
This structured diagnostic matrix allows infrastructure leaders to pinpoint the specific architectural deficiencies preventing their operations management platforms from delivering expected returns.
Where Virima fits in resolving the ITOM context deficit
Virima delivers an enterprise discovery, CMDB, and service mapping platform designed specifically to supply the authoritative runtime context that IT operations management platforms require. Rather than attempting to replace existing monitoring investments, Virima establishes the foundational data layer that transforms fragmented telemetry into actionable operational intelligence.
Virima Discovery scans on-premises hardware, private virtual infrastructure, and public cloud environments across AWS and Azure on scheduled high-frequency discovery cycles. The platform automatically identifies and records critical operational relationship types, including Runs On, Communicates With, Connected To, Installed On, Hosted On, Virtualized On, and Load Balancer For. Virima ViVID (Virima Visual Impact Display) transforms those discovered relationship records into dynamic multi-tier service maps, providing operations teams with complete visibility into application dependencies, active ITSM incidents, pending change requests, and security vulnerabilities.
Virima does not replace specialized APM tools, log analyzers, or network performance monitors. It integrates with those solutions, providing the unified configuration records and dependency topologies required to bind alerts to assets accurately. Through enterprise ITSM and ITOM integrations, Virima synchronizes authoritative discovery and service mapping records across industry platforms, including ServiceNow, Jira Service Management, Ivanti, HaloITSM, Xurrent, and Hornbill.
By establishing accurate configuration baselines and live dependency visibility, Virima enables enterprise operations teams to eliminate alert noise, accelerate incident triage, and automate operational workflows with complete confidence.
Build the operational model before activating the automation
Enterprise IT operations cannot automate what they do not understand. Purchasing advanced ITOM platforms and AIOps engines will never compensate for fragmented discovery practices, unmapped application architectures, or inaccurate configuration databases.
Organizations that succeed with operations management resist the urge to automate prematurely. By establishing continuous discovery, reconciling asset identities, building dynamic service dependency maps, and enforcing strict alert-binding standards, IT leaders create the resilient operational foundation required to achieve true operational stability.
Schedule a technical evaluation to see how Virima Discovery and ViVID service mapping establish the authoritative operational context your ITOM platform needs.
Frequently Asked Questions
Why does ITOM fail even when using leading enterprise platforms?
ITOM platforms fail when organizations deploy them on top of incomplete or outdated configuration data. Without accurate discovery and dynamic service maps, the platform cannot bind incoming alerts to assets, correlate events effectively, or assess the true business impact of infrastructure issues.
What is alert-to-CI binding and why is it essential for ITOM?
Alert-to-CI binding is the process of matching an incoming event notification to its corresponding record in the configuration management database. High binding rates are critical because they enable the platform to group related alerts, identify root causes, determine asset ownership, and route incident tickets accurately.
How do stale service maps undermine incident management workflows?
Stale service maps represent outdated architectural designs rather than live production environments. When an infrastructure failure occurs, an outdated map misidentifies affected business services, misdirects triage teams, and prevents automated systems from evaluating the true blast radius of the incident.
Why is automated remediation risky without authoritative runtime context?
Automated remediation scripts execute actions directly against production infrastructure based on incoming alert triggers. If an alert associates with the wrong configuration item due to stale data, the automated script may restart or modify healthy servers, causing secondary outages across the enterprise.
How does Virima improve existing ServiceNow ITOM investments?
Virima enhances ServiceNow ITOM by executing high-frequency discovery scans and dynamic service mapping across hybrid infrastructure fabrics. This populates the ServiceNow CMDB with accurate configuration items, multi-tier dependency maps, and change context, ensuring near-complete alert-to-CI binding and dependable event correlation.