ViVID™ Service Mapping — Live Dependency Intelligence for Every IT Action
Most IT teams approve changes without seeing what they’ll touch. ViVID™ closes that gap — live service maps built from your discovery data, with blast radius, ownership, and change risk visible before any change, incident, or AI-assisted action fires.
Dynamic AI/ML Relationships
ITSM and Vulnerability Overlays
Change Impact Analysis
Root Cause Analysis
Simplify IT Asset and Service Management with Virima
Simplify IT Asset Management
Top Two Ways Virima Visual Impact Display Benefits IT Operations
Vivid for IT Ops
Top Two Ways Virima Visual Impact Display Benefits Cybersecurity
Vivid for Cybersecurity
Why Trusted Runtime Truth Changes Everything
Operational intelligence, not just maps
ViVID™ transforms static service maps into a real-time heads-up display — overlaying incidents, changes, alerts, and
vulnerabilities so your teams can act faster.
Faster mean time to
resolution (MTTR)
Blast radius visibility
before every change
always current
Clarity when it matters most
When an outage hits, the first question is always: “What changed?” ViVID™ answers that instantly by correlating service dependencies with live operational data, helping teams pinpoint root causes and slash MTTR.
Change without the guesswork
Every change carries risk. ViVID™ visually highlights blast radius, stakeholders, and downstream dependencies, giving IT managers the confidence to plan changes without blind spots.
ML-driven accuracy
ViVID™ is built on Virima’s ML-powered discovery and service mapping engine, ensuring that visualizations are accurate, continuously updated, and reflective of real infrastructure behavior — not manually maintained diagrams.
A collaboration hub for IT, SecOps & DevOps
ViVID™ centralizes incidents, changes, vulnerabilities, and asset context into a single shared view, enabling cross-team alignment during outages, change planning, and security investigations.
A CMDB that works for everyone
Instead of a spreadsheet-like CMDB buried in forms, ViVID™ turns configuration data into a visual, navigable, and actionable asset that drives better decisions across the organization.
Virima Visual Impact Display (ViVID™)
How ViVID™ Service Mapping Works
stays current automatically.


Discovery data
Virima discovers your infrastructure via scheduled scans, keeping asset inventory fresh and accurate.


Service definitions
Your team defines services once — via the Virima UI.


Dependency mapping
ViVID™ builds the full dependency structure automatically and refreshes it as new scan data comes in.
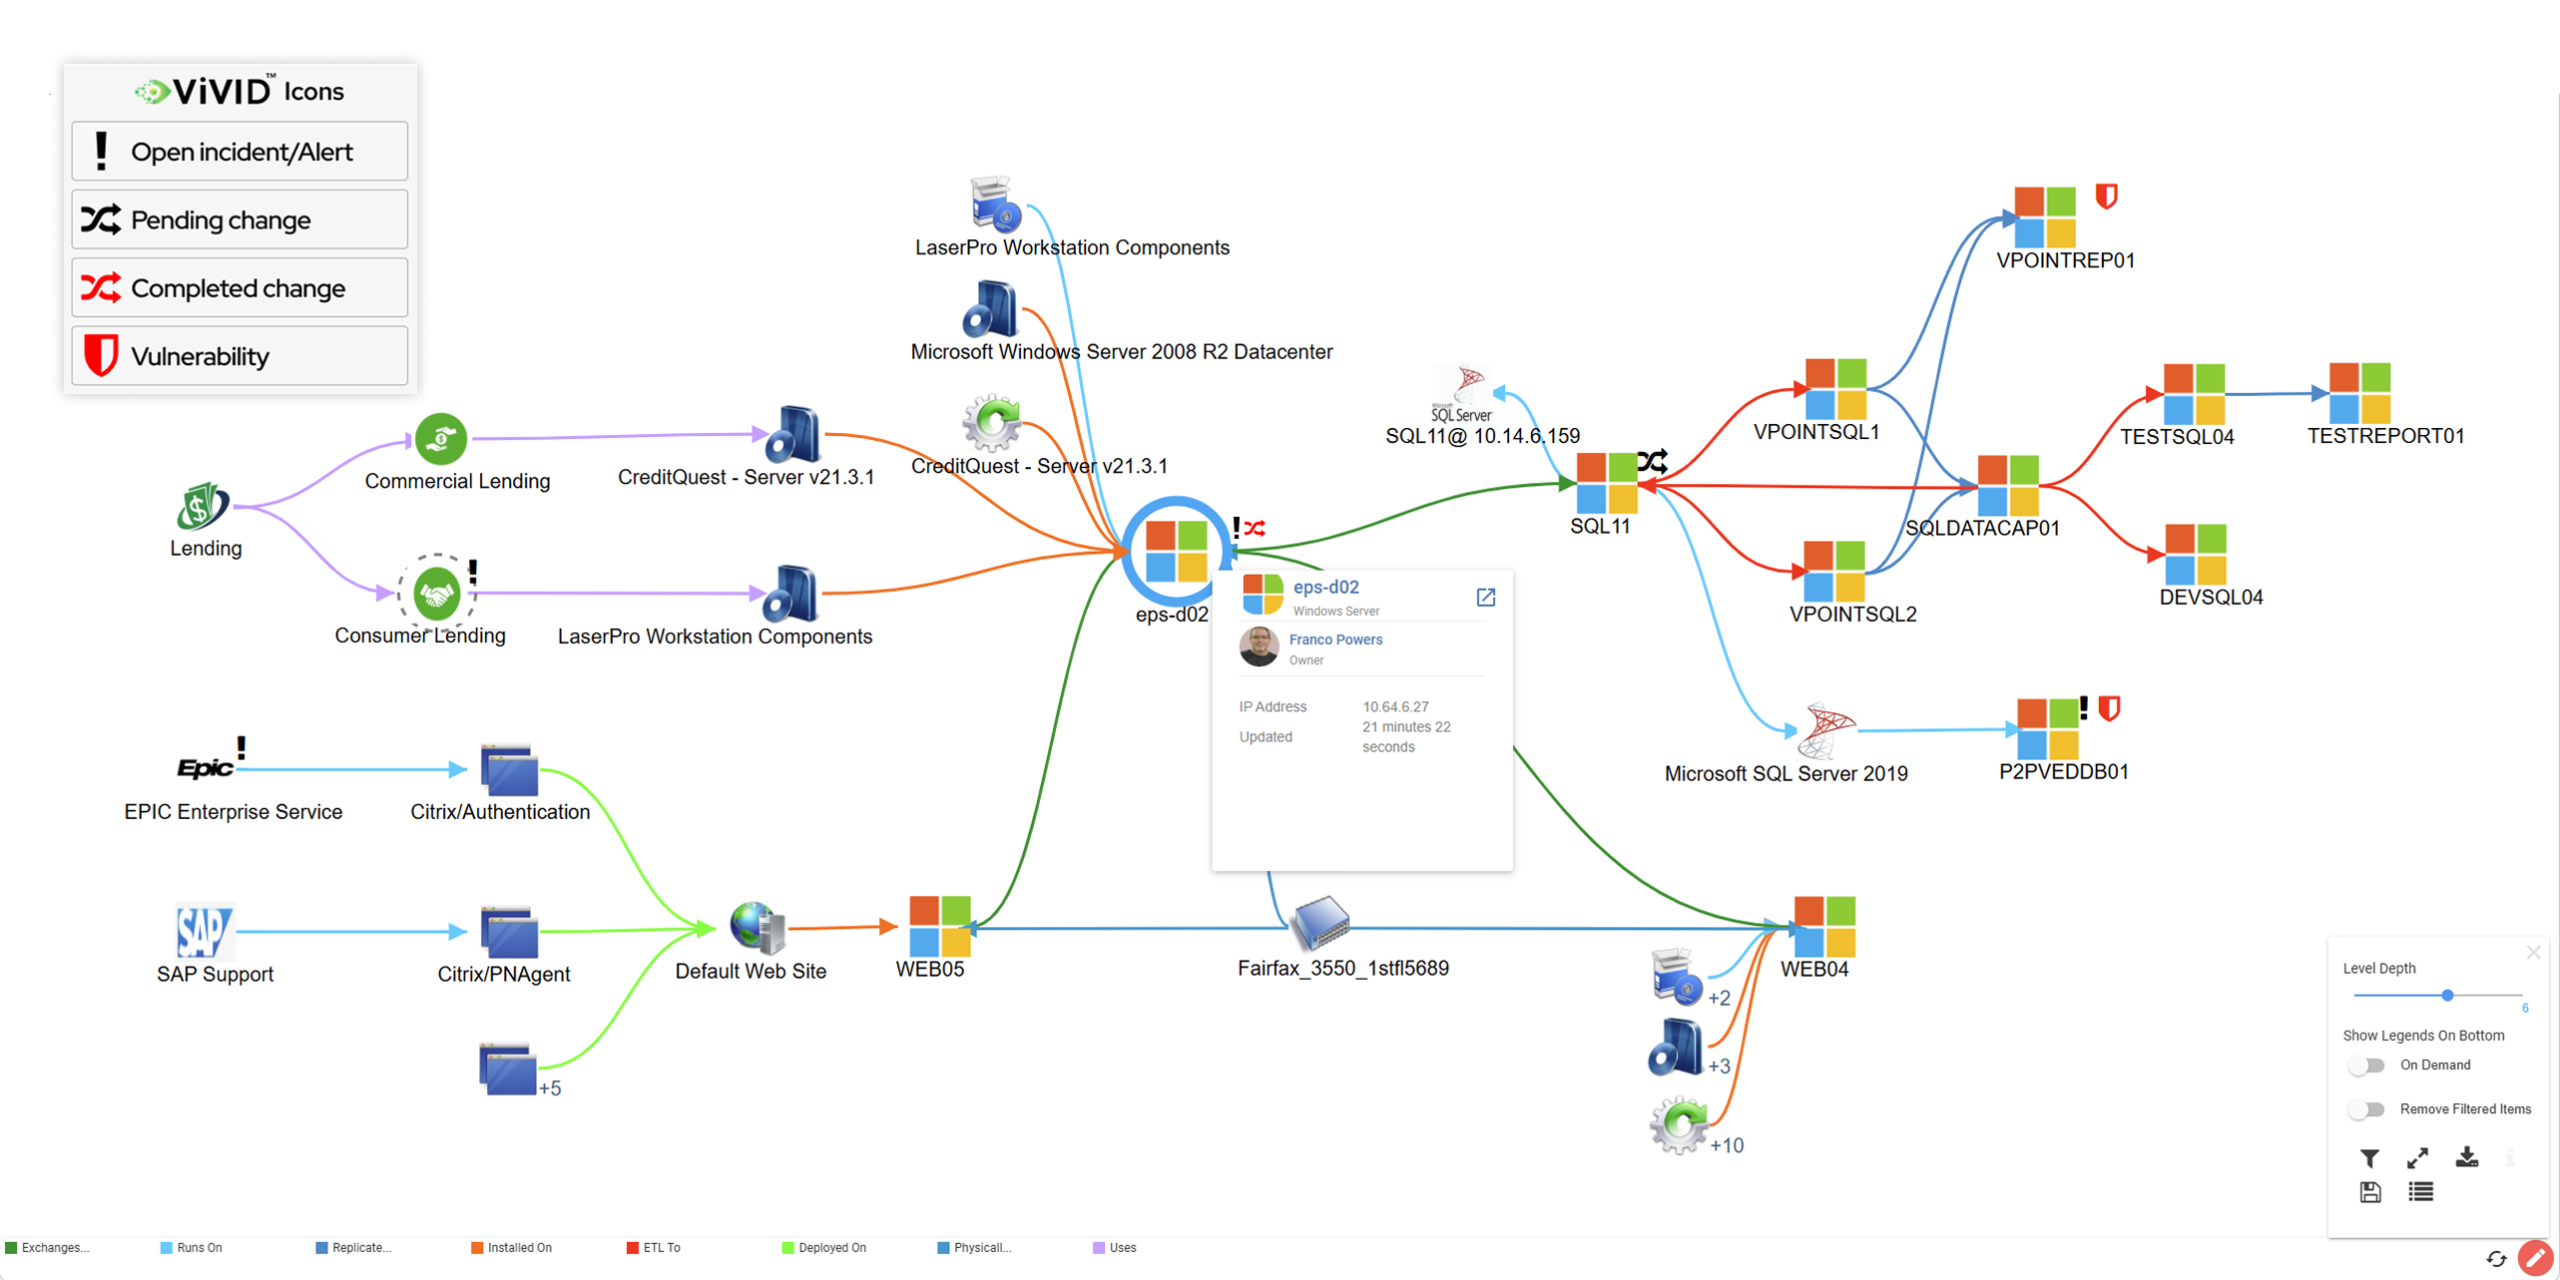
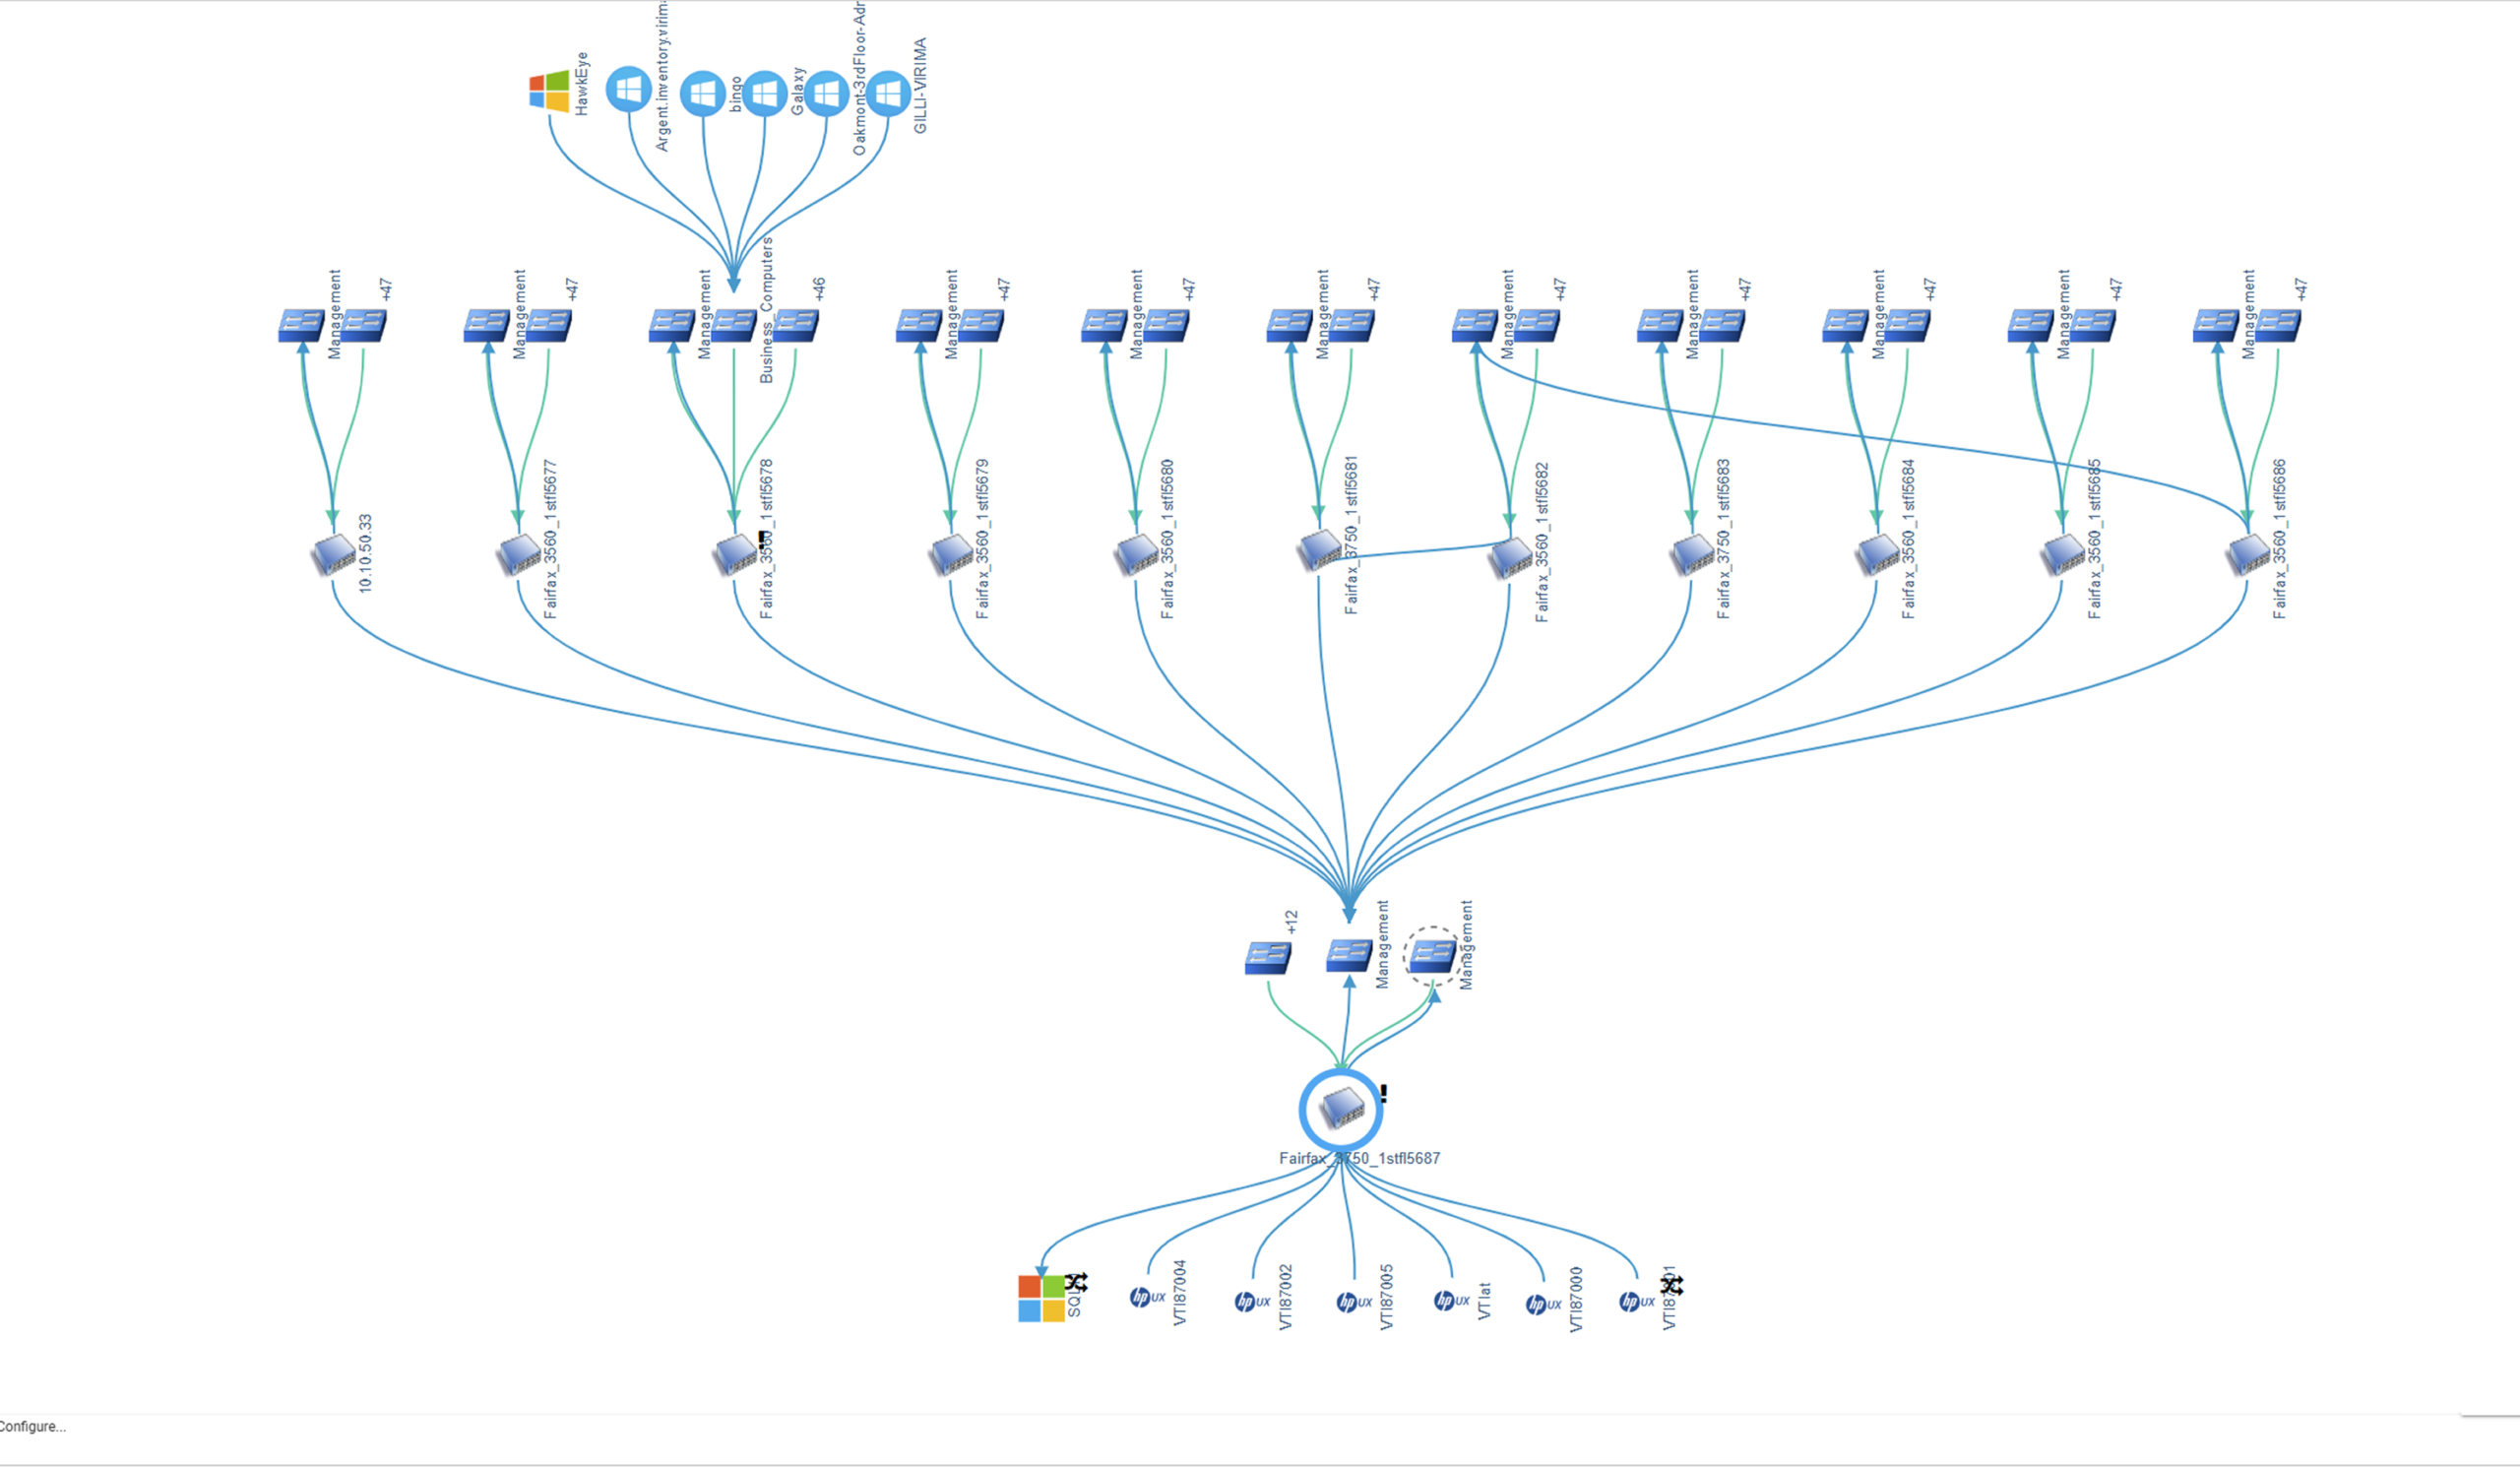

Live dependency map
Always current with the latest scan data. No manual maintenance. No stale diagrams. Explainable at every layer.
See your environment like never before
Change Management
With ViVID™ and Without ViVID™
With ViVID™
Without ViVID™
Operational Context on Every Map
ViVID™ overlays active operational data directly onto your service maps through bi-directional integrations
with ServiceNow, Jira Service Management, Ivanti, Halo, Xurrent, and Hornbill:
Active incidents
Open tickets on components within the map
Pending changes
Recent changes
NVD vulnerabilities
NIST-sourced CVEs overlaid on affected assets with business service criticality from the map
When an incident fires, responders open one map — not five tools. They see what is connected,
what changed, what is vulnerable, and who owns it.
ViVID™ and Agentic IT
That is trusted runtime truth for agentic IT — what actually exists, how it’s connected, what changed, what could break, and who owns it. Live, explainable, and policy-aware.
What Makes ViVID™ Unique?
ViVID™ overlays operational context — ITSM records, vulnerability data, and change history — directly onto machine-learned service maps.
This is trusted runtime truth in action: every dependency, risk, and change visible in one view.


ITSM Records
Through bi-directional integrations with many popular ITSM platforms, incidents, recent changes, and pending changes are shown within every map view to reduce the guesswork in both change planning and incident response.


Vulnerability Insights
NIST NVD vulnerabilities are displayed on ViVID's maps so remediation priorities are based not only on the severity of the vulnerability, but also on the criticality of the affected asset and the business services it supports.


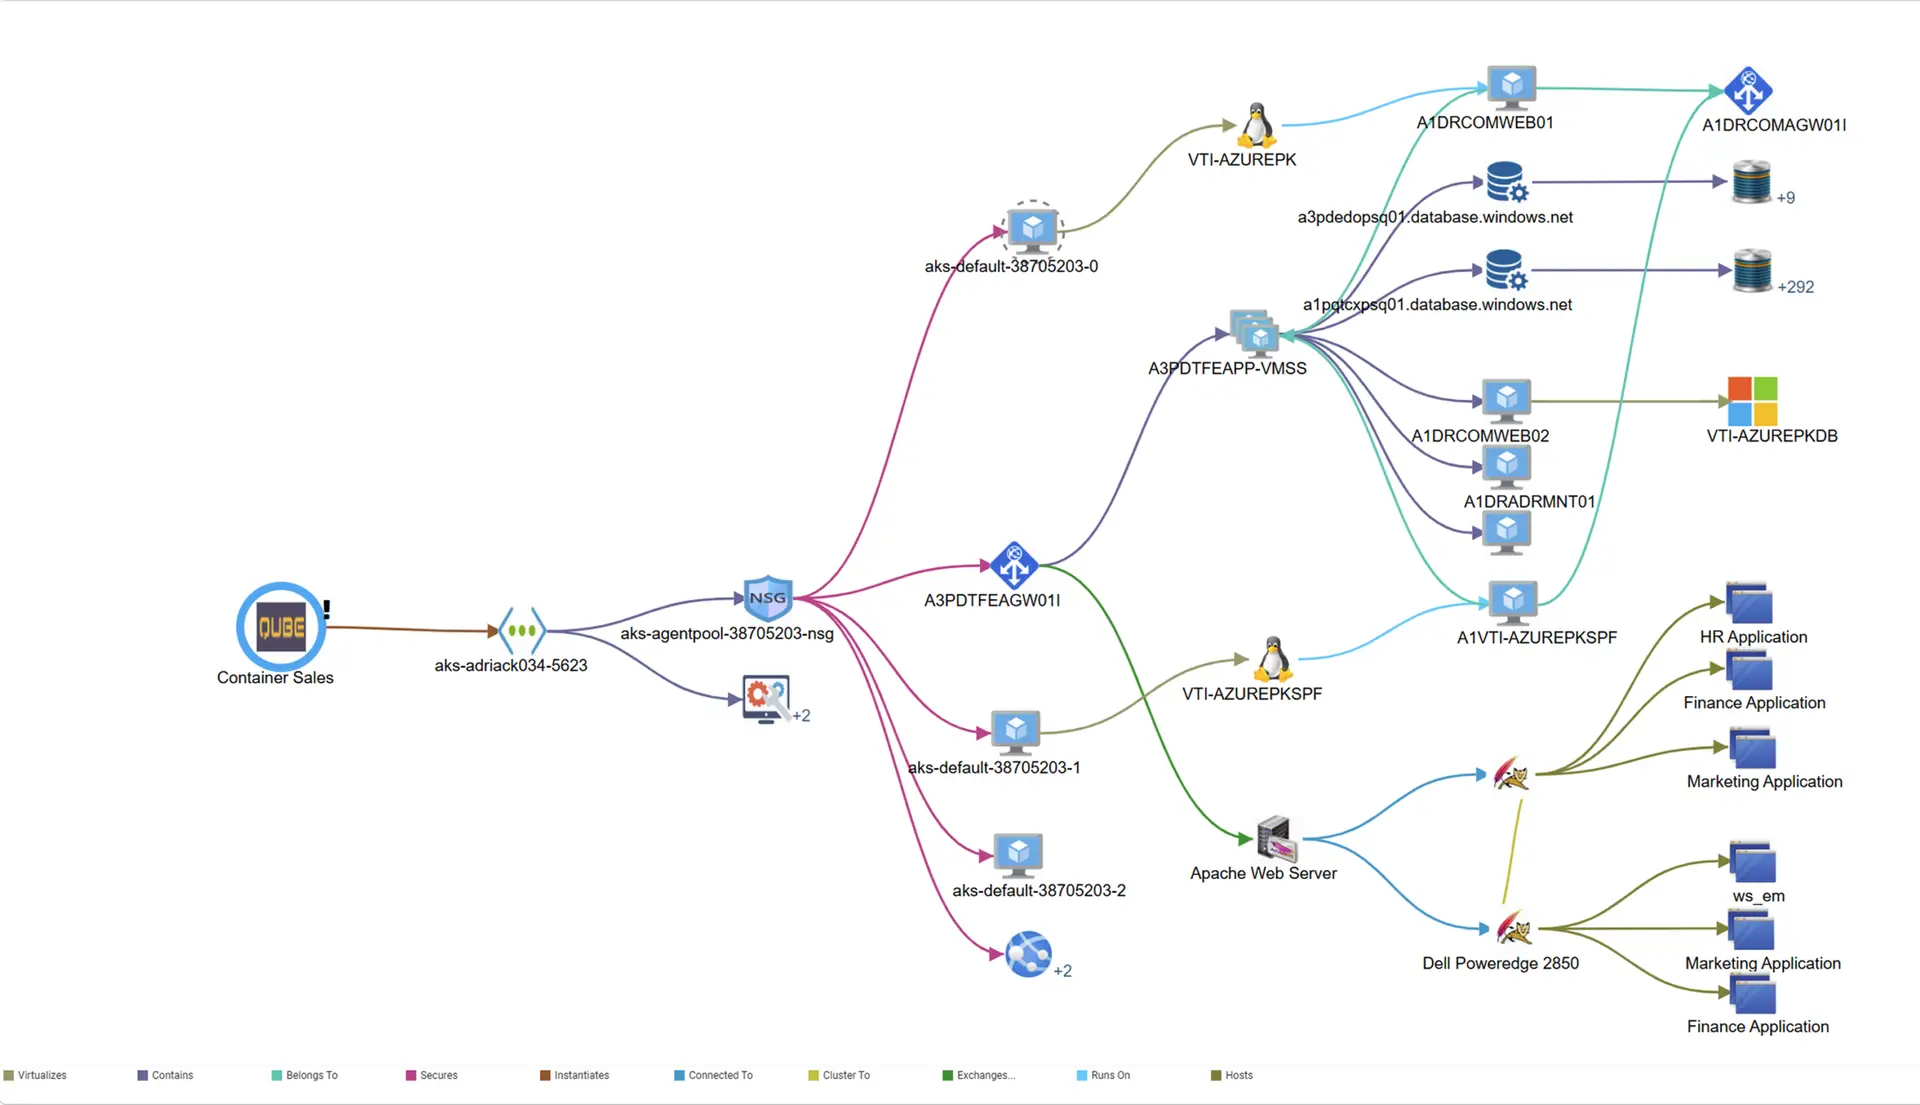
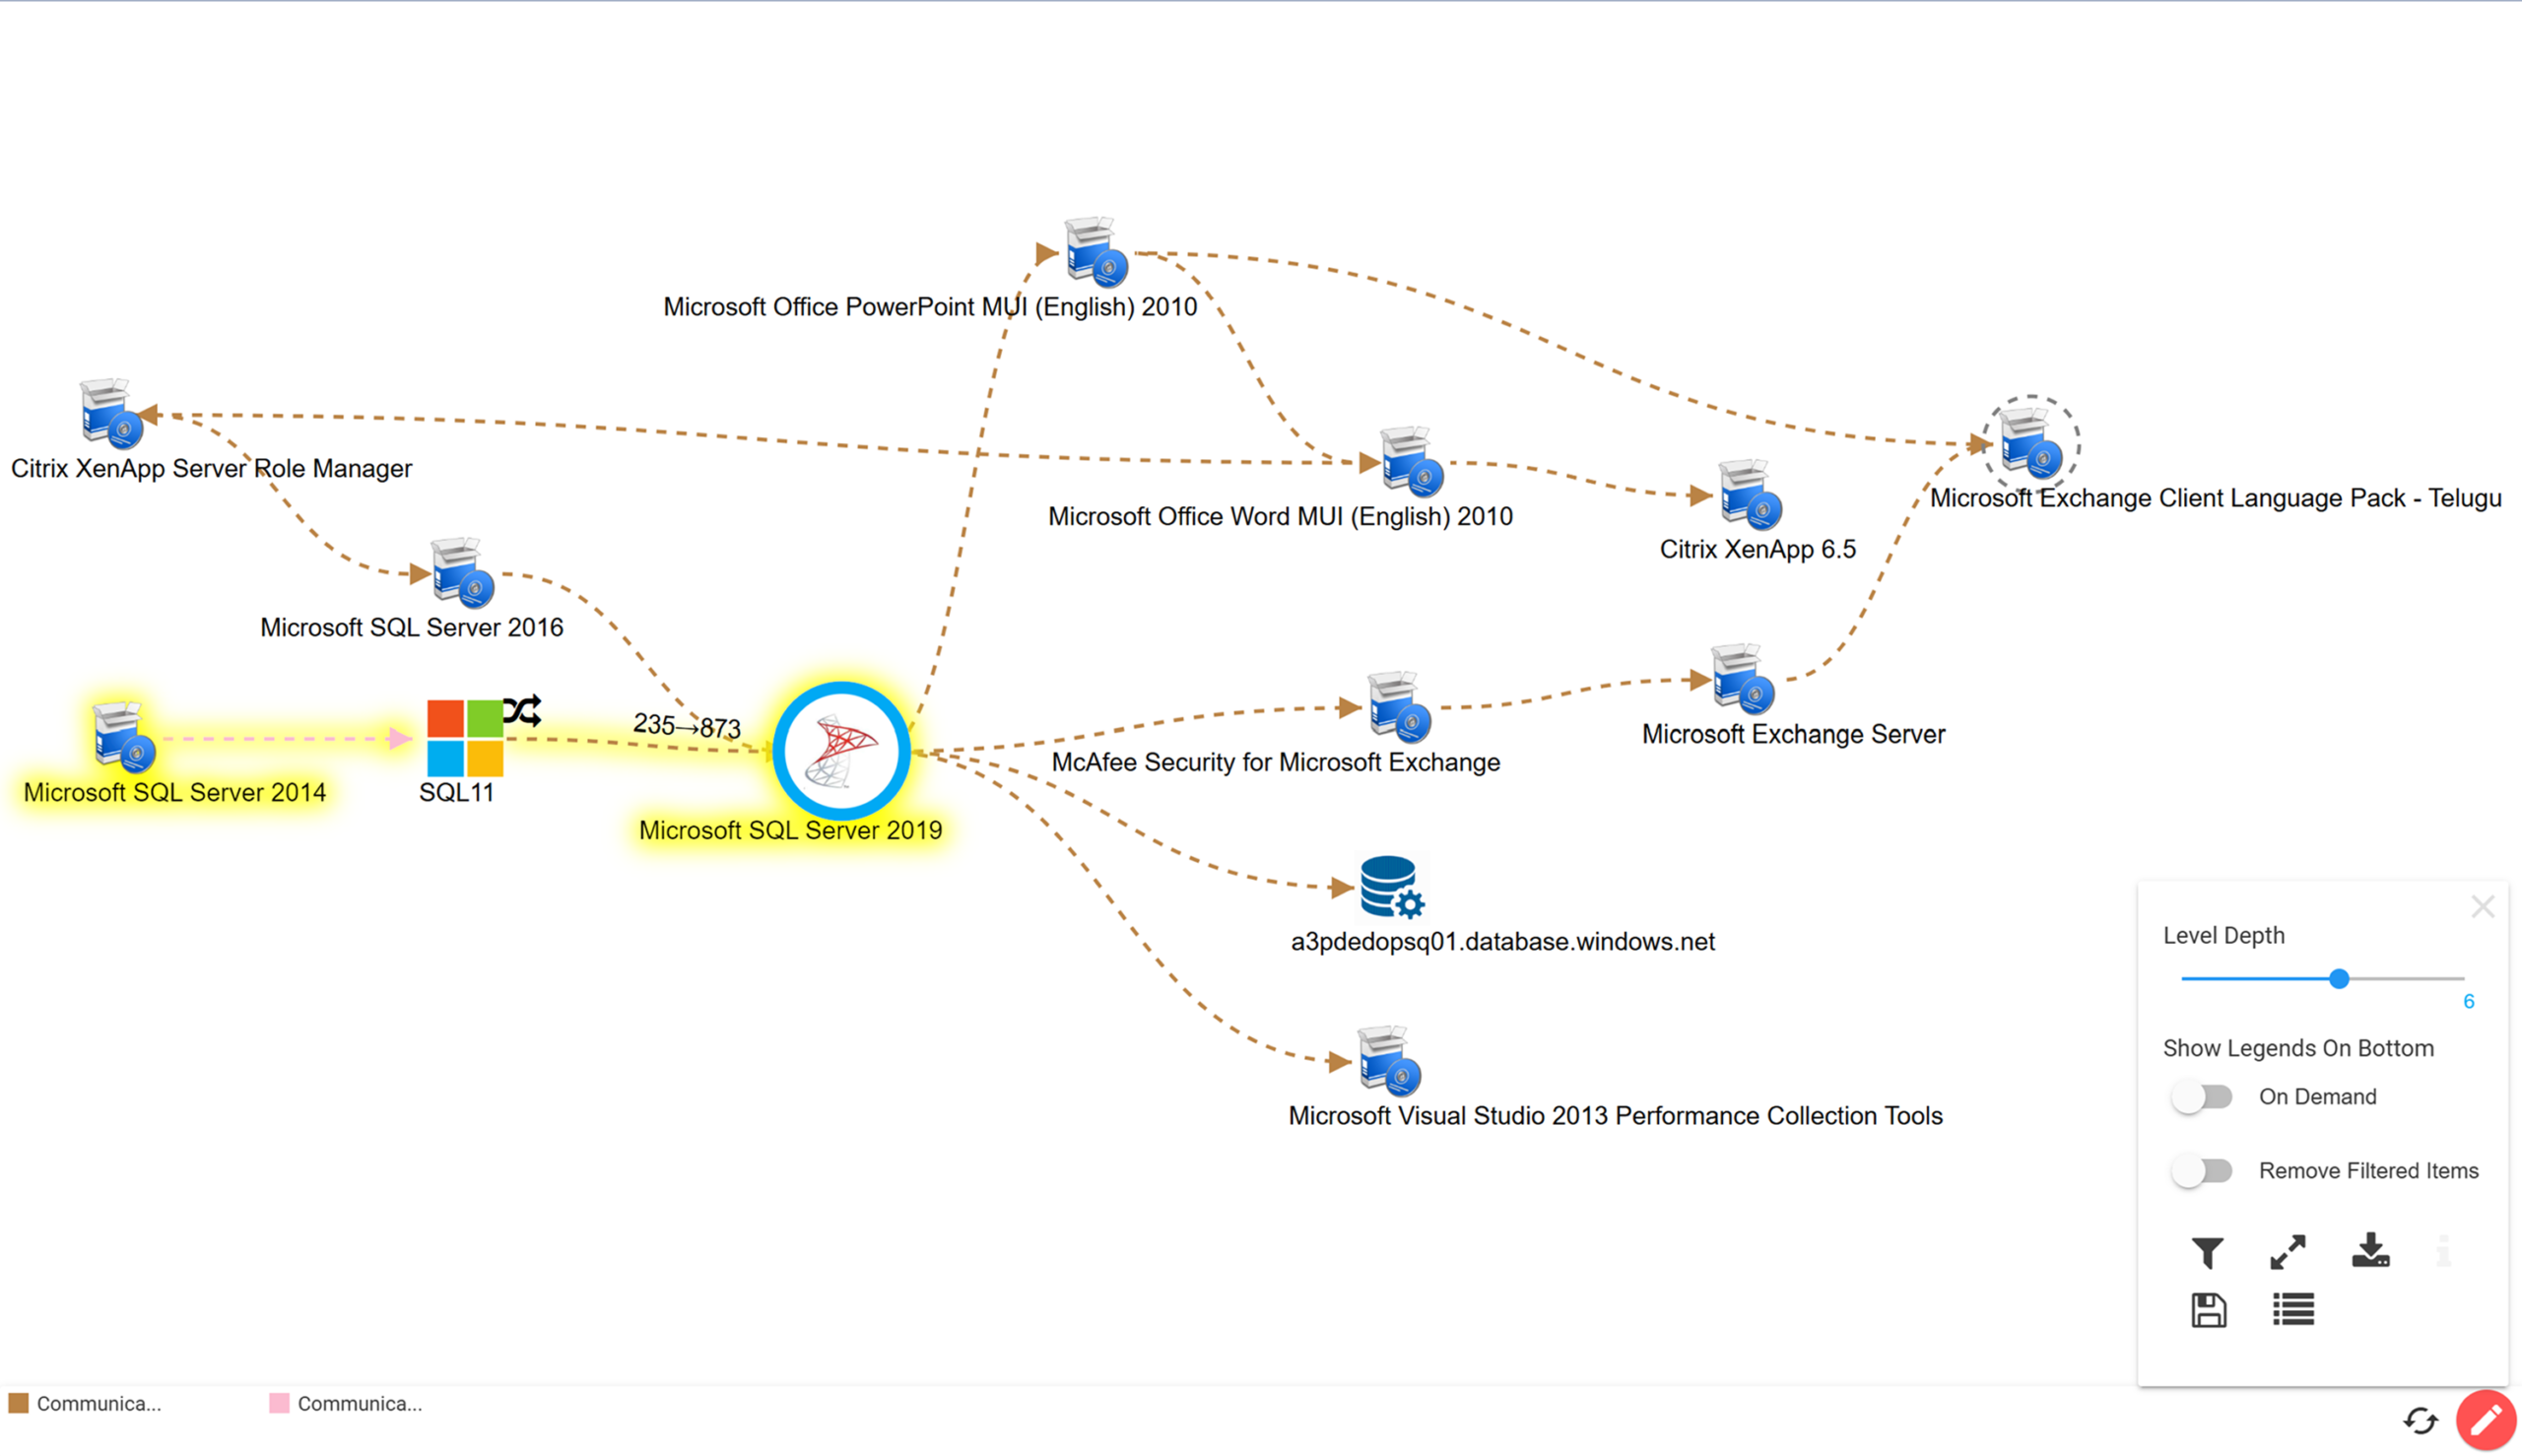
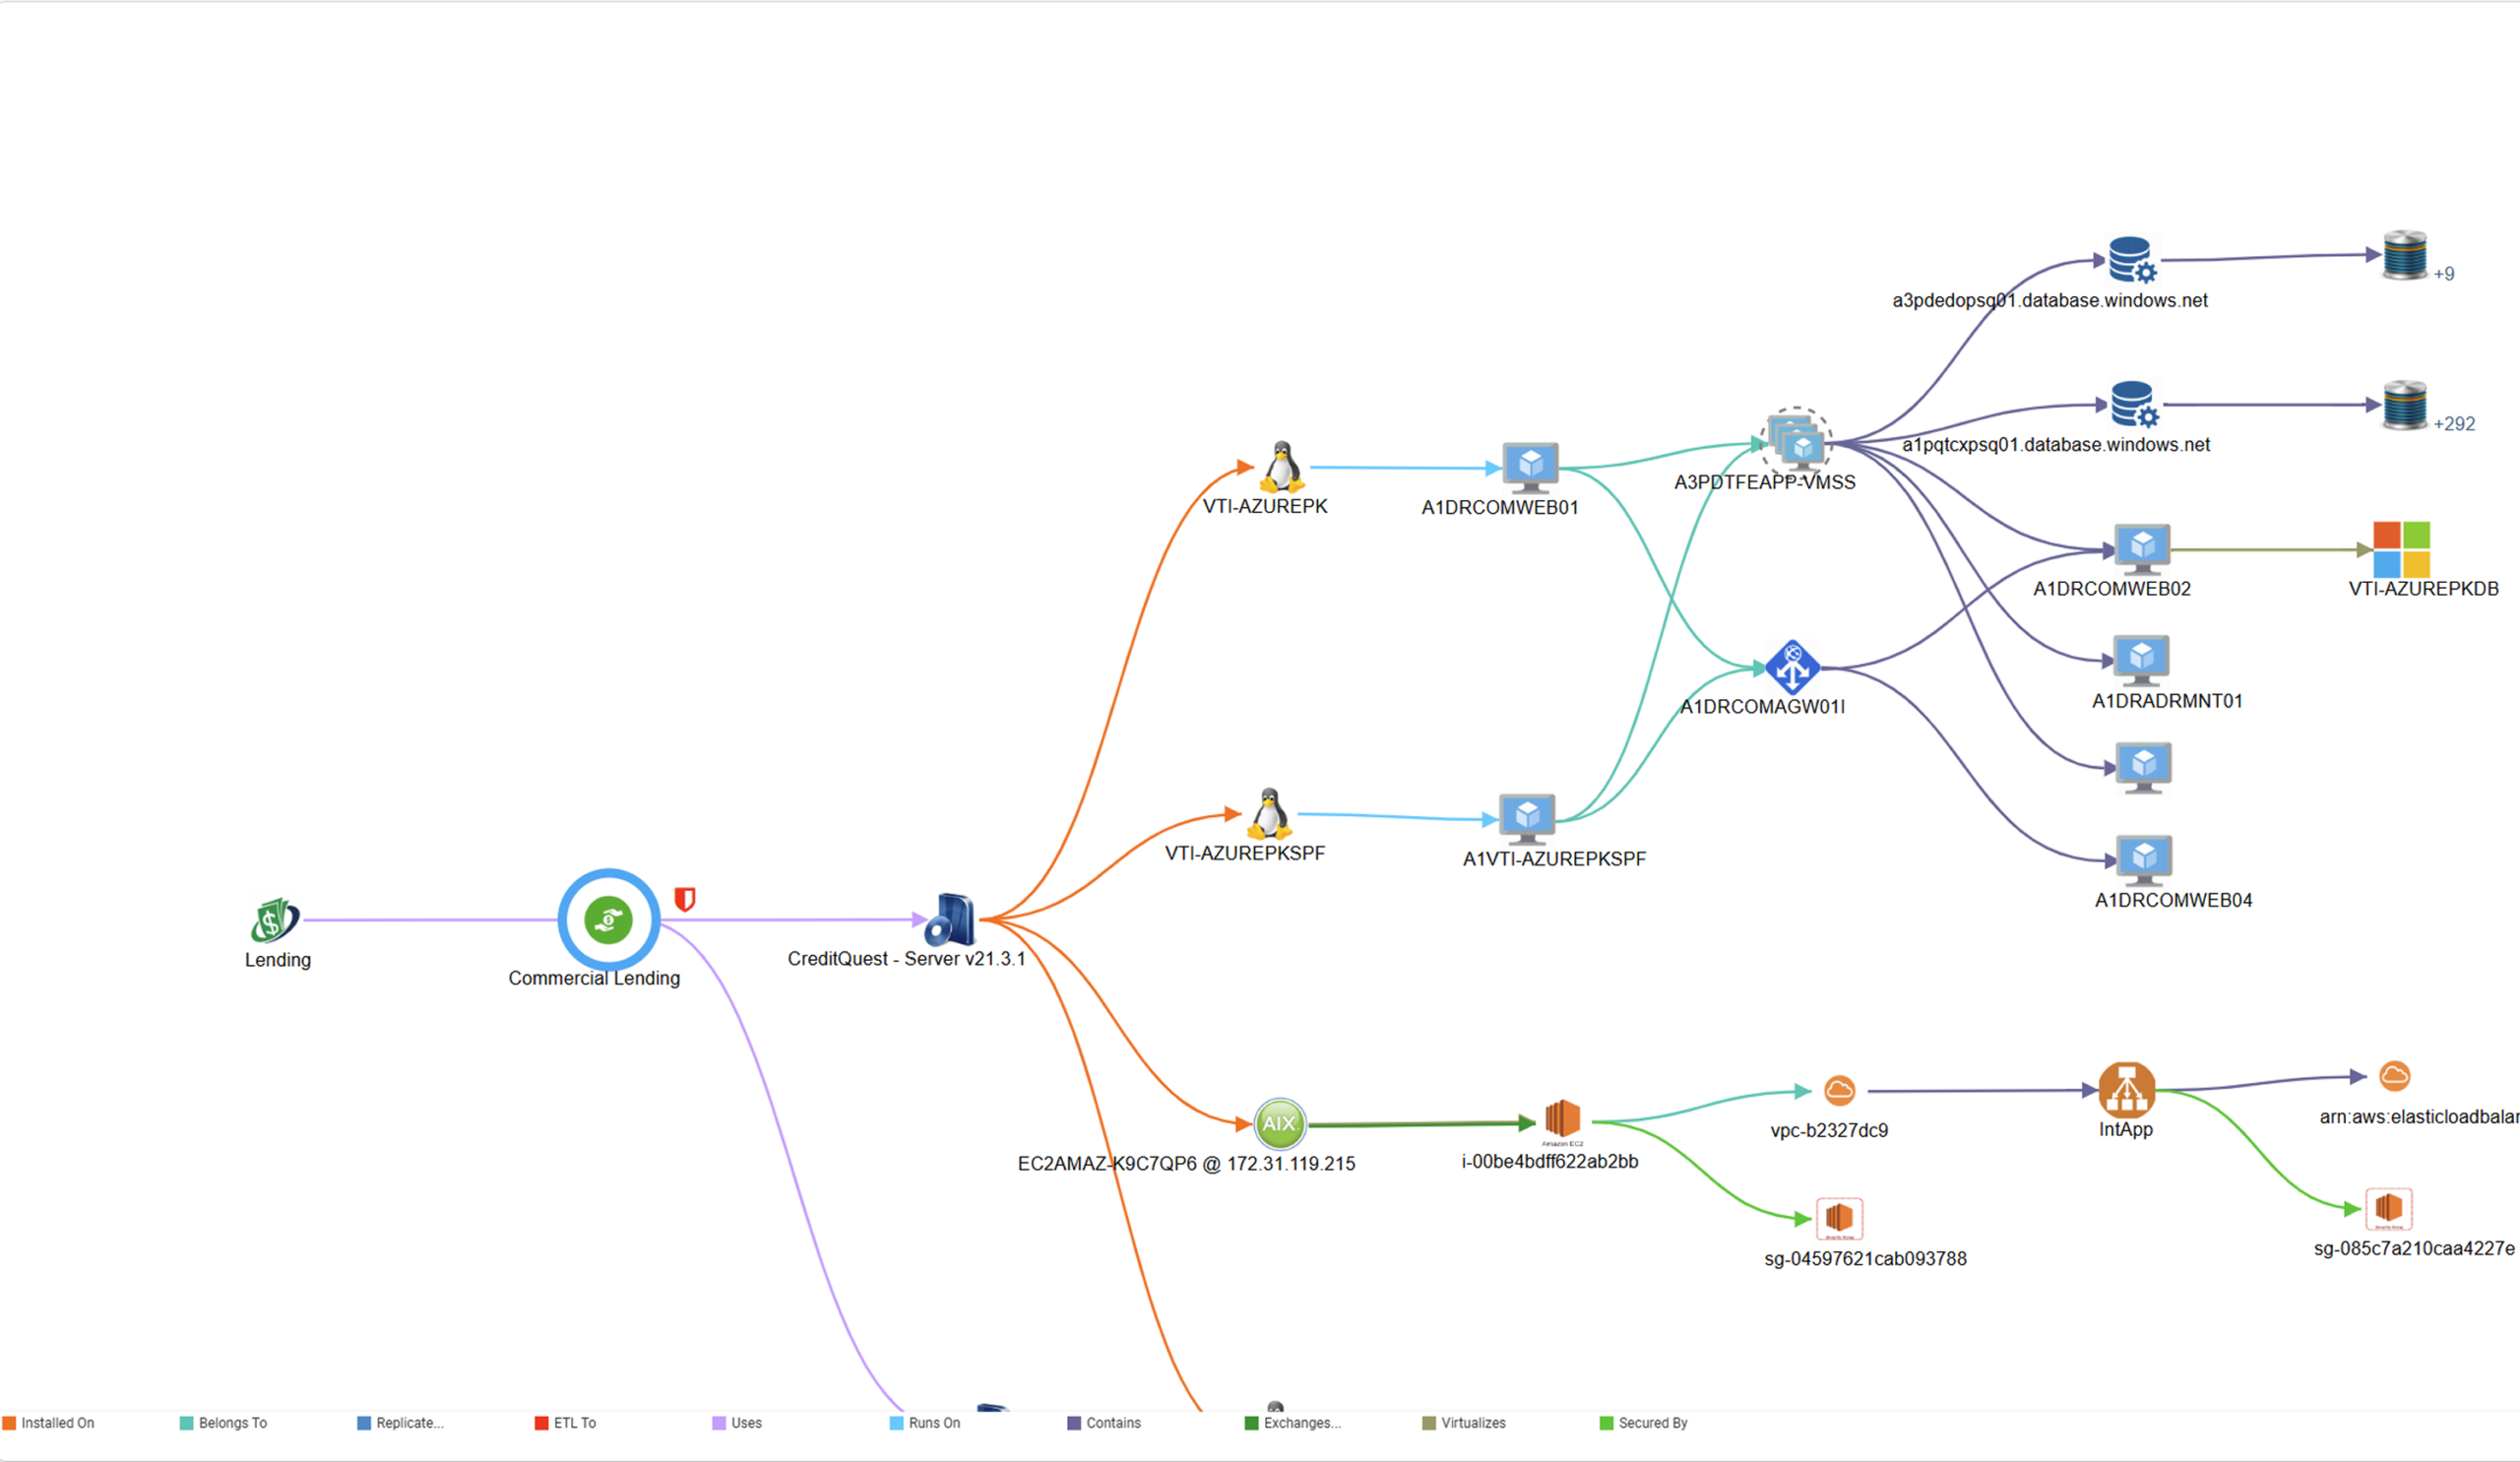
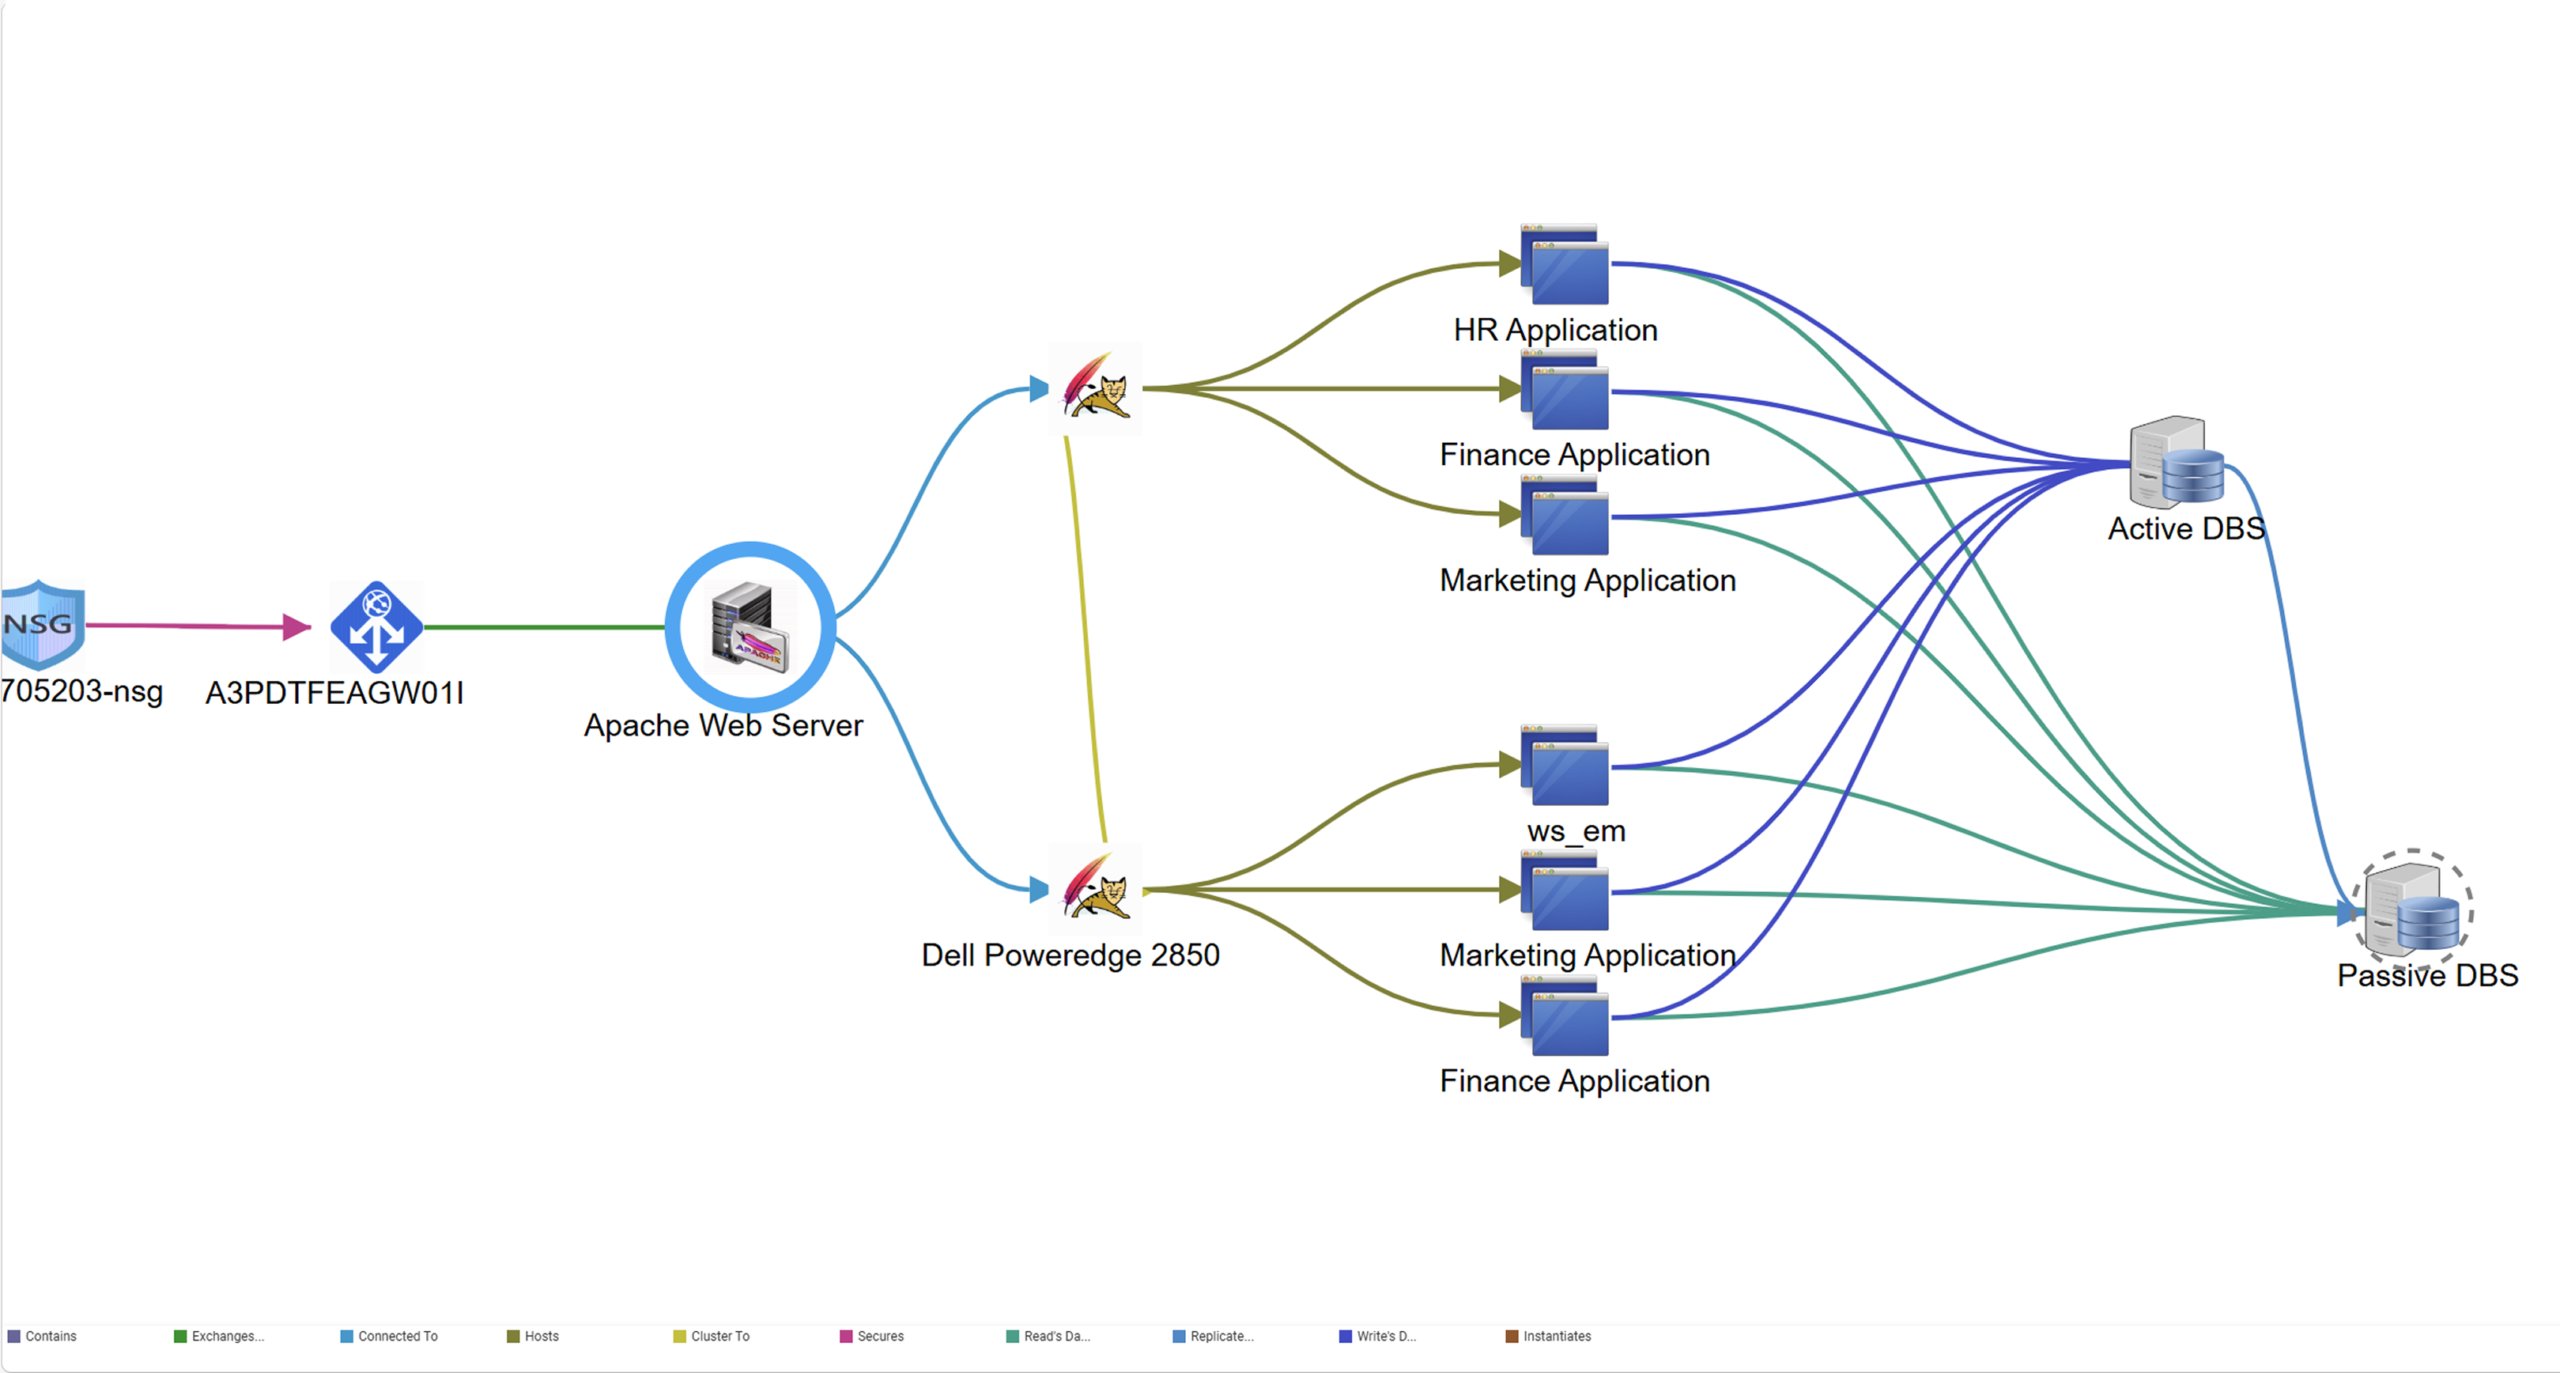
Visual Dependency Intelligence
ViVID™ assigns distinct colors to each dependency type, giving teams an immediate, intuitive understanding of service relationships — and how a single change or failure could ripple across the environment.
Why Vivid™
What ViVID™ Shows That Other
Service Mapping Tools Don't
with live runtime truth layered directly on top.


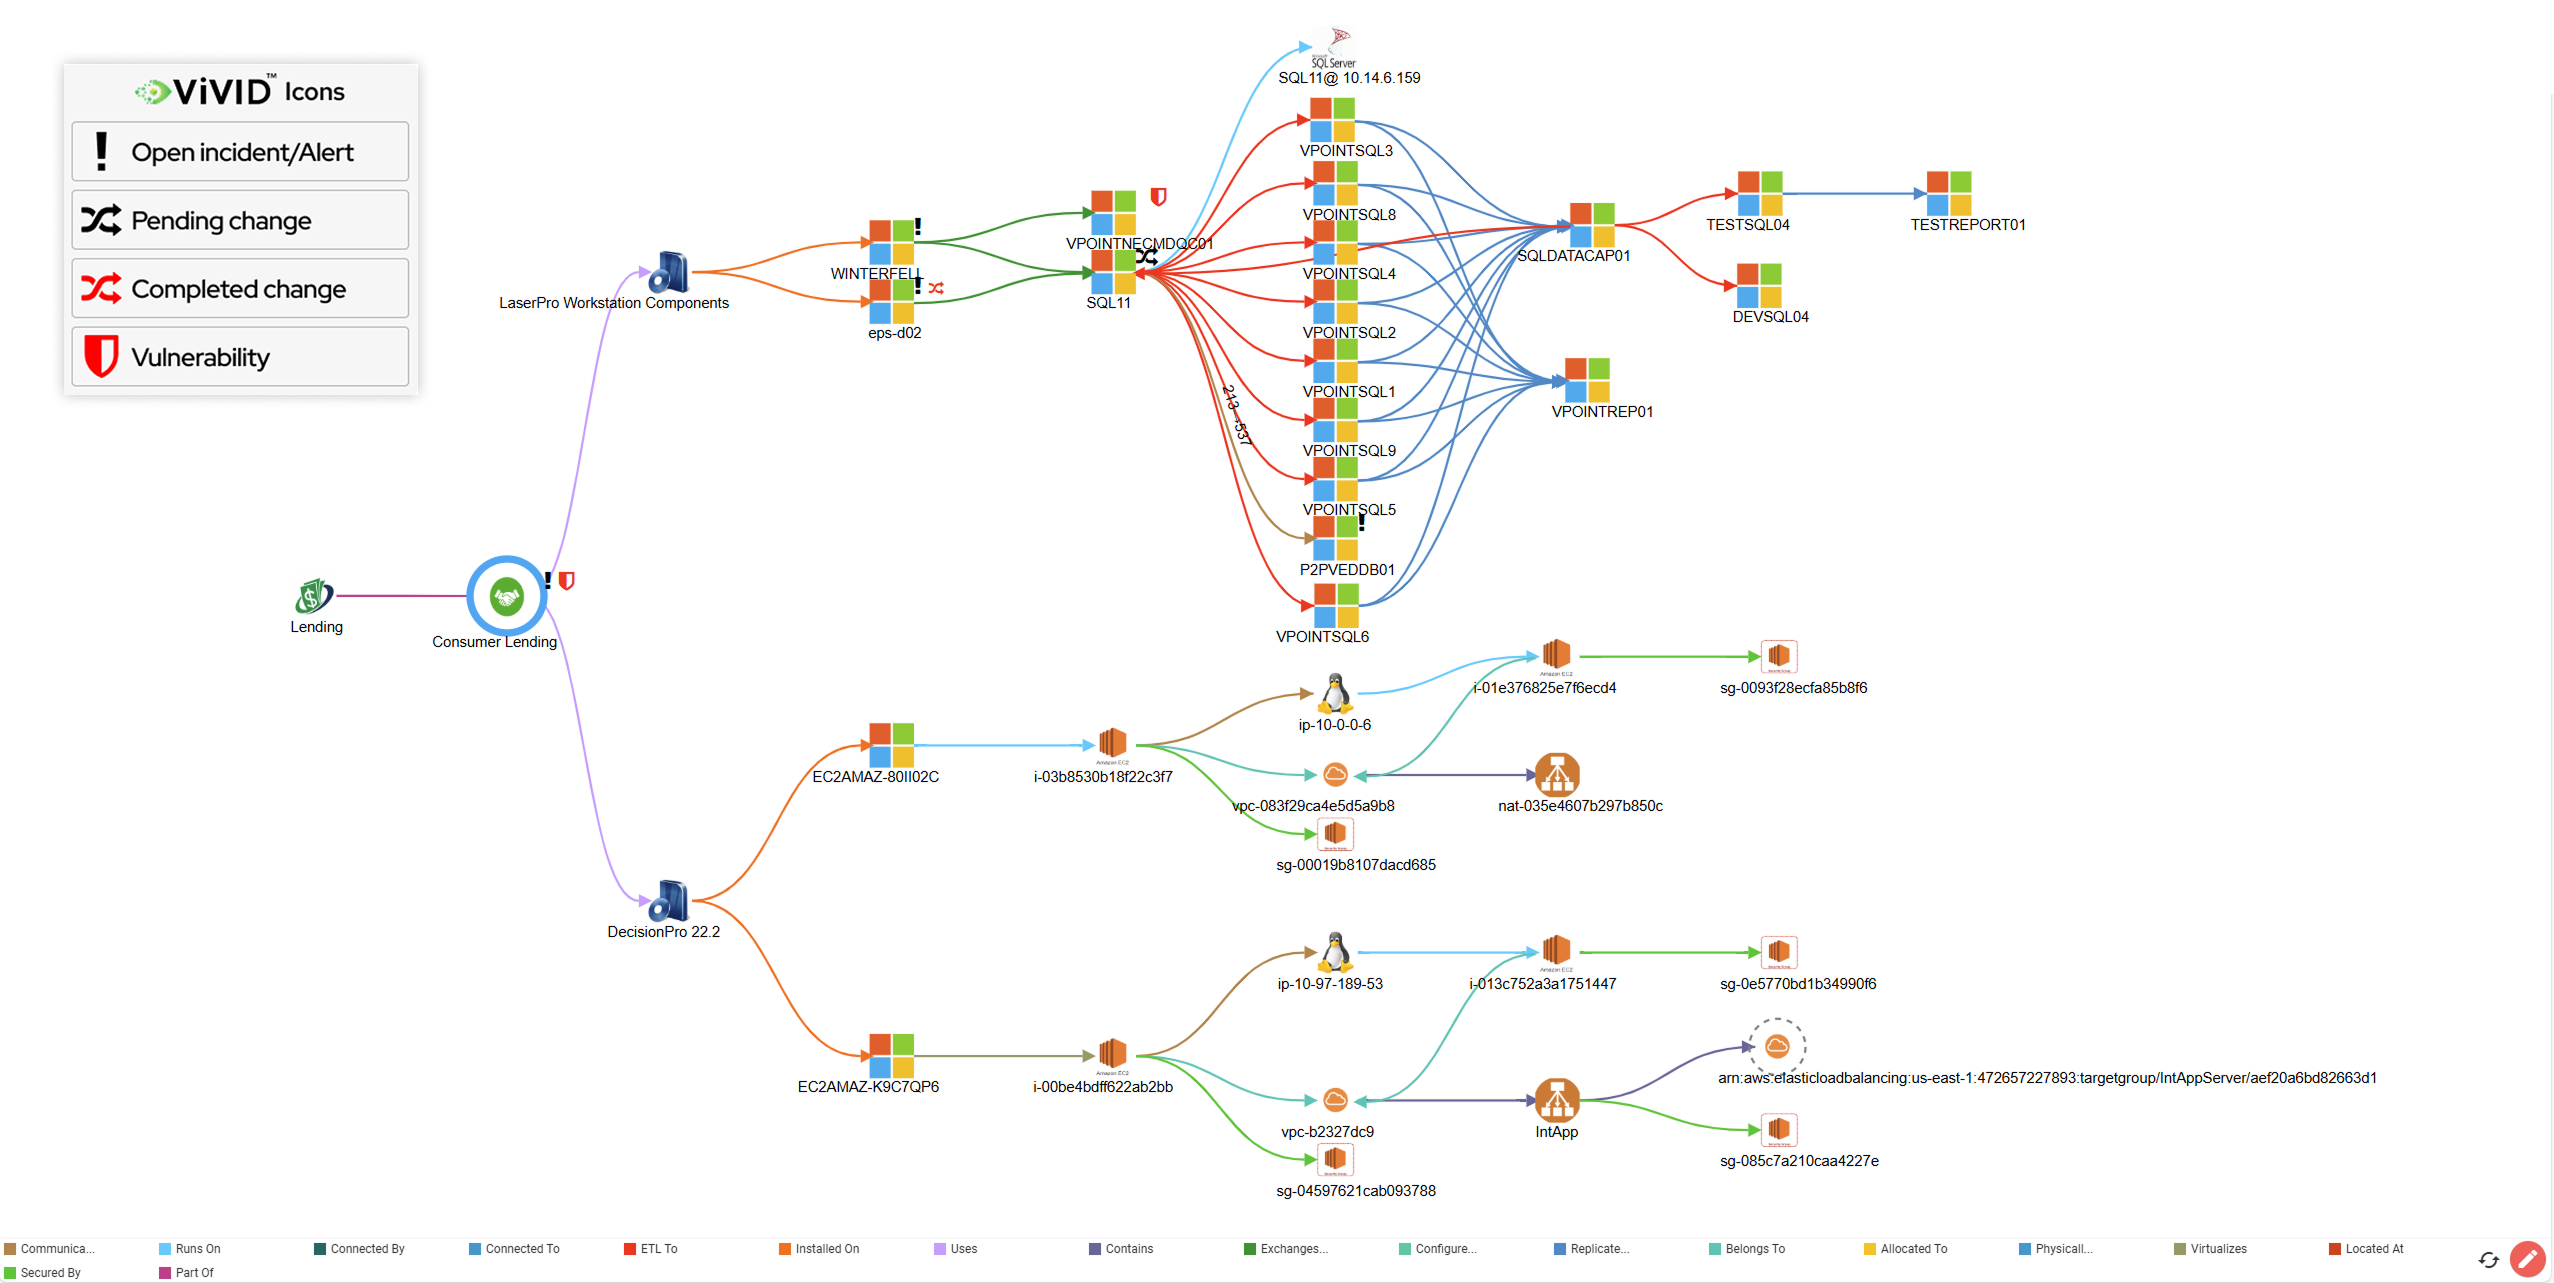
Blast radius before the change, not after the incident
Other tools show dependencies. ViVID™ shows you which services and assets a proposed change will touch — before CAB approves it. Pending changes and open incidents on related CIs are visible on the map, not buried in a separate ticket queue.


ITSM overlays — incidents, changes, and vulnerabilities on the map itself
ViVID™ pulls live ITSM records from ServiceNow, Jira Service Management, Ivanti, Halo, Xurrent, Hornbill, and TeamDynamix and overlays them directly onto discovery-sourced maps — whichever of those platforms your tickets live in.


Cross-platform portability
Unlike platform-native service maps that only live inside one tool, ViVID™ maps are sourced from Virima's discovery layer — making the same service intelligence available to every ITSM platform you connect. Teams on Jira Service Management see the same blast radius visibility as teams on ServiceNow.


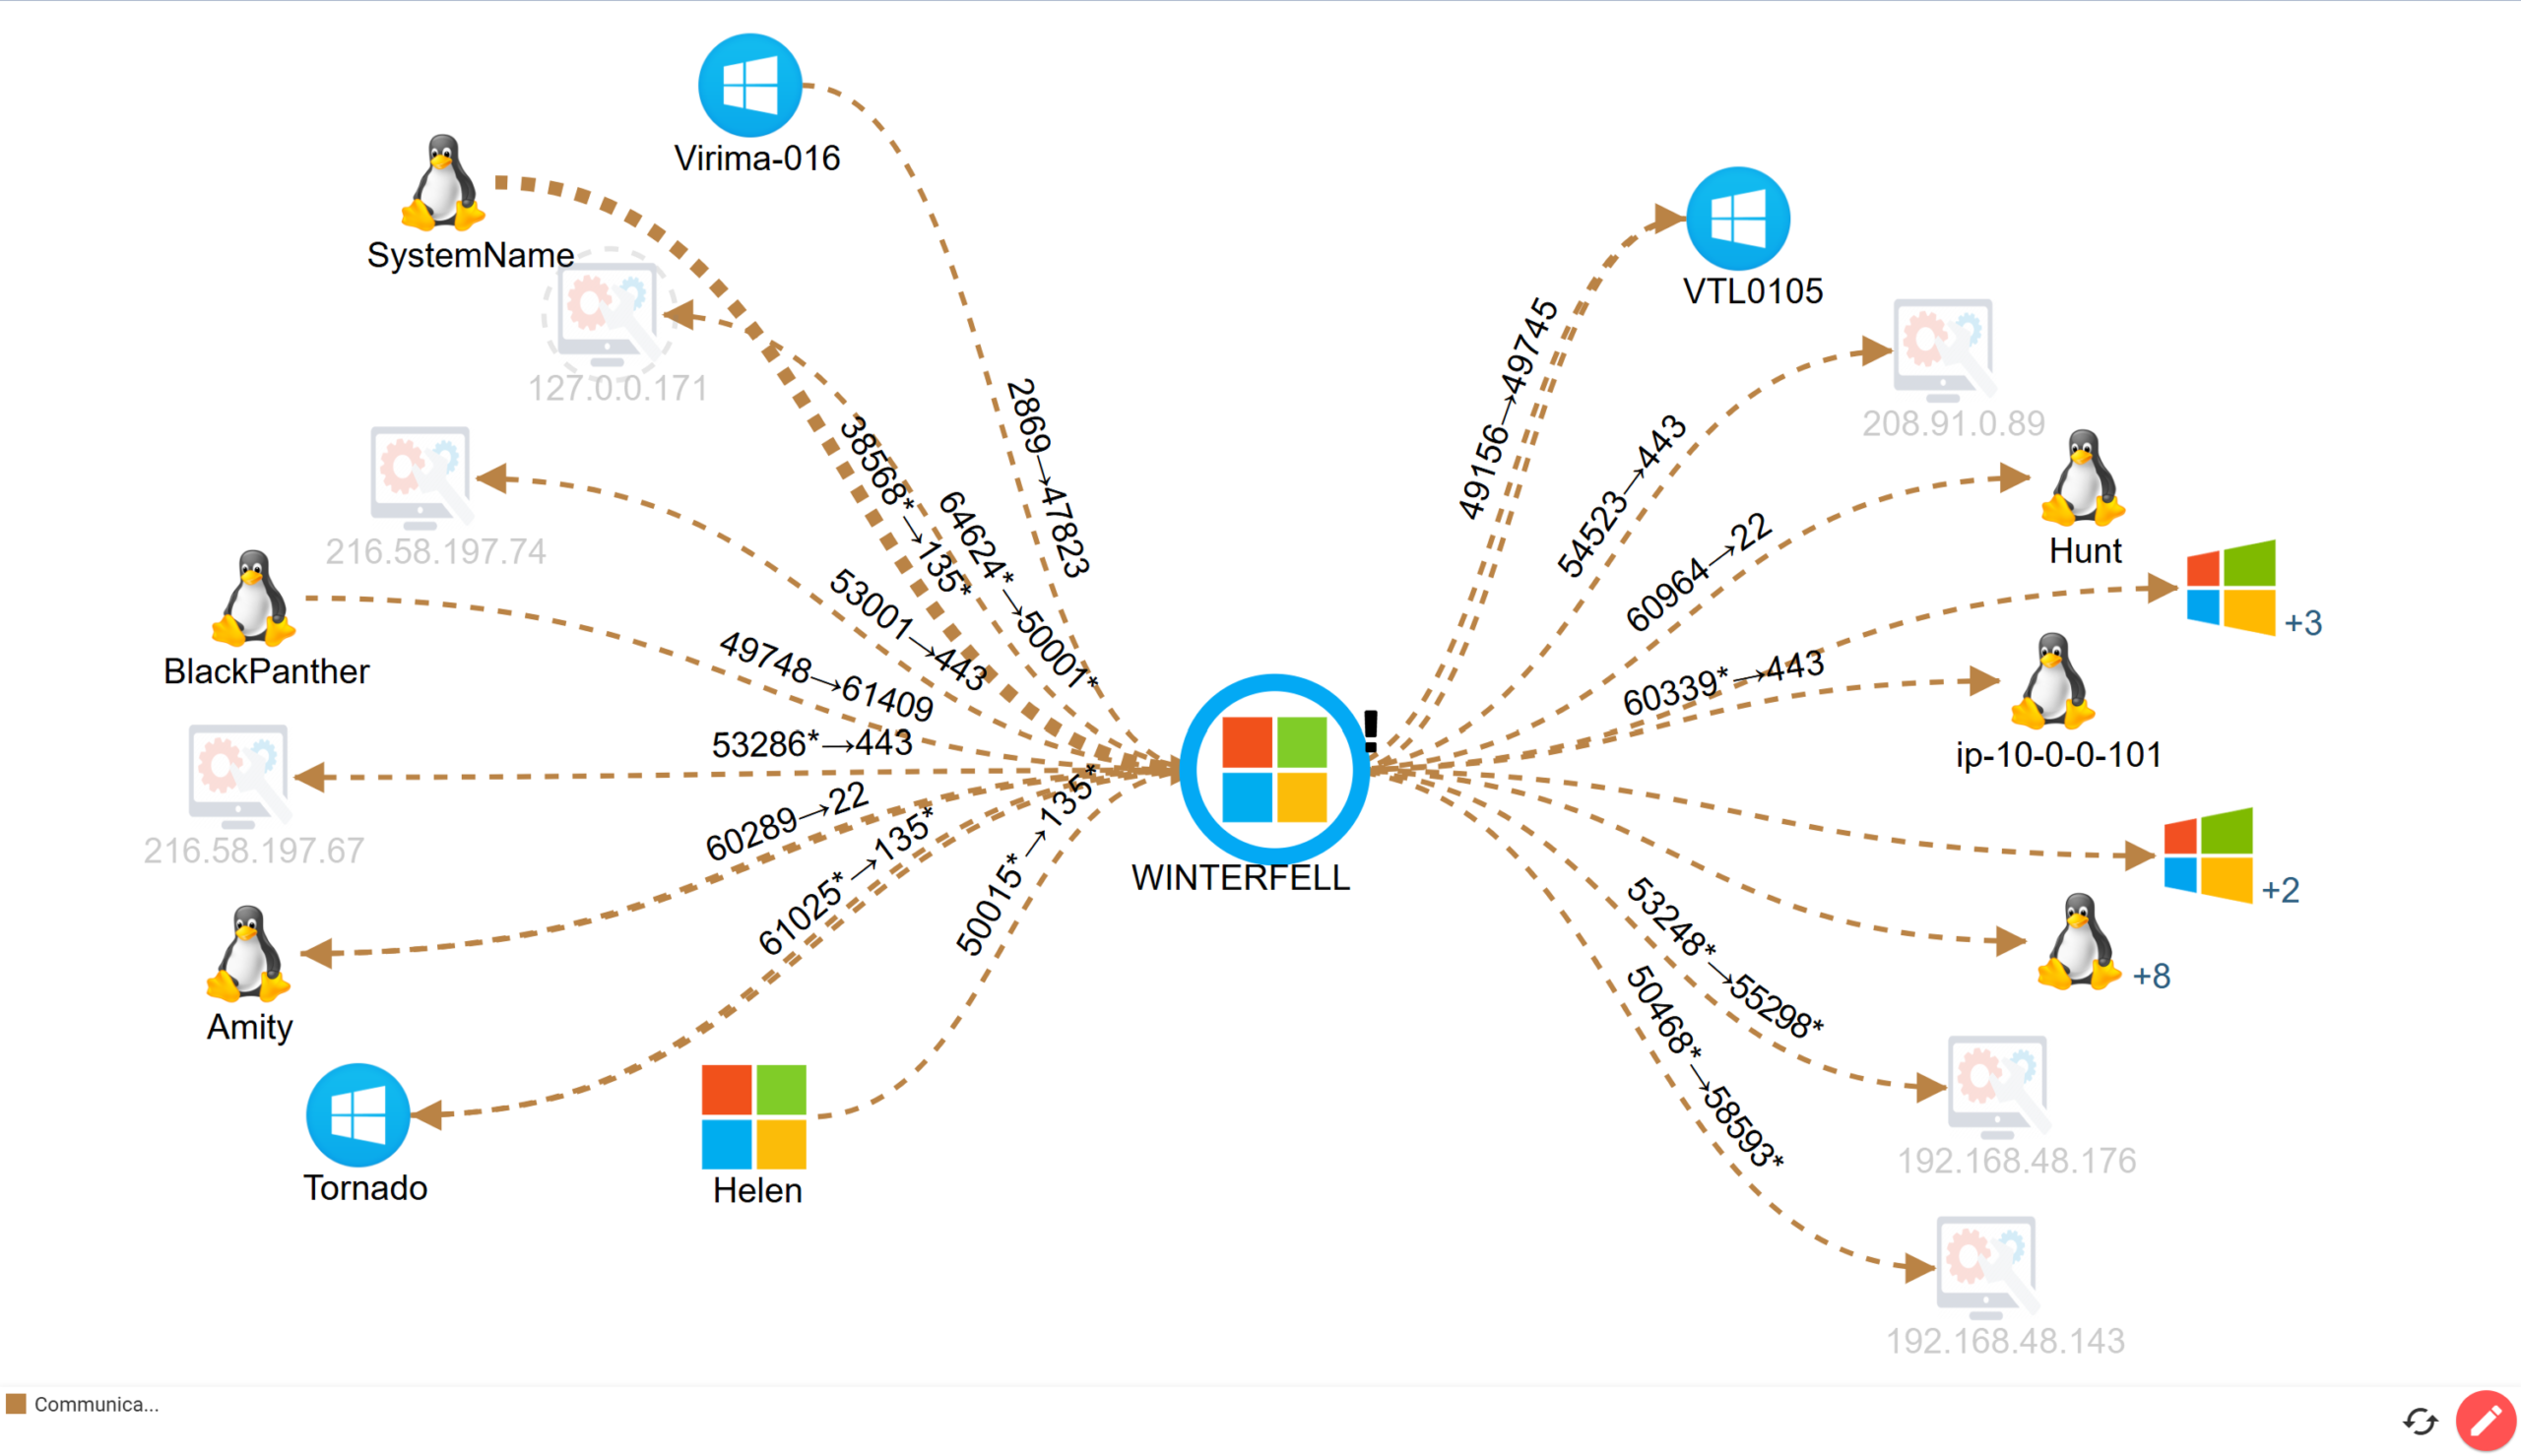
Shadow assets and undocumented connections
ViVID™ Communication Flow views surface host-to-host connections including assets not yet in your CMDB — so undocumented dependencies don't stay hidden until they cause an incident.


NIST NVD vulnerabilities on the service map
Vulnerability tools give you CVE lists ranked by CVSS score. ViVID™ shows CVEs on the map, weighted by the criticality of the business service the affected asset supports — so remediation priority follows service impact, not a raw severity score.
Dynamic Visualizations
Business Service Map
This is generally considered the most useful view because it provides detailed visibility into how your business services and major applications are supported across the entire IT estate. Add in ITSM overlays and you have a heads-up display for root cause and impact analysis.
Application Dependency Mapping
Communication Flows
View server-to-server and server-to-host communications with port numbers and protocol details, including “ghost machines” not yet in the CMDB. Useful for identifying undocumented connections and understanding how traffic moves across your environment.
Cloud Relationships
Network Device Dependencies
Map VLANs and device connectivity across your network infrastructure. Understand how routers, switches, firewalls, and load balancers connect and which services depend on them.
Top ViVID™ Service Mapping Use Cases
Root Cause Analysis
Vulnerability Prioritization
Prioritize vulnerability remediation based on asset criticality and business service impact, with NVD vulnerabilities shown directly on the map — so teams act on what matters, not just what scores highest in CVSS.
Business Continuity Planning
FAQ’s around
ViVID™ Service Mapping
01. What is service mapping in ITSM?
02. How does ViVID Service Mapping work?
ViVID™ is the visual layer of your Virima CMDB. Name a service, point it to a logical starting point such as an application or web server, and all of its dependencies become part of the map. Any change to the underlying configuration data is automatically reflected, so teams always have an accurate picture of which servers, applications, network infrastructure, and cloud resources support each business-critical service. From there, ViVID™ overlays ITSM records and vulnerability data onto these maps, enabling use cases like change impact analysis, root cause analysis, and vulnerability prioritization.
03. Why is Service Mapping important to my business?
Service Mapping helps you gain control over your IT operations and make informed decisions by quickly diagnosing problem areas and prioritizing actions based on business impact. It eliminates the errors that come with manual mapping and ensures your teams always work with accurate, current data. ViVID™ Service Mapping takes this further by turning discovery-sourced CMDB data and machine-learned relationships into service maps with ITSM records, vulnerability data, and blast radius visibility overlaid directly — so teams resolve incidents faster and plan changes with full impact context.
04. Are Discovery and Service Mapping the same?
05. What is the difference between service mapping and application dependency mapping?
06. How does service mapping help with incident management and MTTR?
07. Can service mapping work across hybrid and multi-cloud environments?
08. What data does service mapping need from discovery?
09. What are common service mapping challenges and how do you overcome them?
10. What is the role of service mapping in change management?
11. Who should use ViVID? Who is ViVID intended for?
Move faster. Act safely.
dependency, change, and risk in one map.


