UVexplorer Review: Features, Limitations, and Best Alternatives
UVexplorer alternatives include Auvik, SolarWinds Network Topology Mapper, Device42, and Virima, each addressing different needs across network discovery, CMDB management, and IT governance. UVexplorer excels in on-premises network topology mapping for mid-sized IT environments. Teams with compliance requirements, service dependency visibility needs, or cross-domain discovery demands typically evaluate broader platforms before finalizing a tool selection.
An auditor asks for an updated network topology map. The only documentation was a Visio file from 14 months ago. During review, unmanaged devices appeared on a subnet nobody owns.
This is when visibility gaps surface.
According to a Virima Infrastructure Benchmark Study, 88% of infrastructure professionals cite time constraints and 85% cite tool limitations as the top barriers to maintaining accurate infrastructure documentation.
Meanwhile, audit expectations have shifted from “show the diagram” to “prove accountability.”
This review evaluates UVexplorer, one of the most commonly researched network visualization tools for teams trying to automate IT discovery and eliminate stale diagrams, alongside the best alternatives for teams whose requirements go further.
Mapping alone may not address broader governance needs. When organizations move from basic discovery into service dependencies, compliance workflows, and audit traceability, they reach the boundary where broader governance platforms become the more defensible choice.
This review covers:
- What UVexplorer does
- Its core features and limitations
- Enterprise and regulated-industry fit
- How it compares to Auvik, SolarWinds, Device42, and Virima
- When a network mapping tool is sufficient and when it is not
What Is UVexplorer?
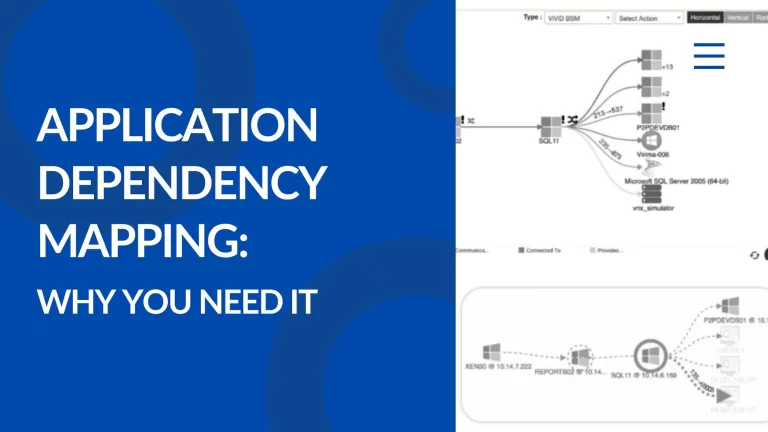
UVexplorer is an on-premises network discovery and topology mapping tool that uses automated protocols such as SNMP to detect devices and generate Layer 2 and Layer 3 network maps.
It is designed to:
- Discover network-connected devices
- Visualize network topology and generate accurate diagrams
- Maintain a device inventory
- Back up device configurations
- Export diagrams and reports
UVexplorer focuses primarily on network-level visibility: switches, routers, VLANs, subnets, and related infrastructure components. It is not a full CMDB platform, nor does it provide native ITSM workflow management.
Its core purpose is network discovery and visualization. For organizations that need discovery to extend into service relationships, lifecycle governance, and audit defensibility, that boundary is where broader platforms like Virima become relevant.
| What Does UVexplorer Do? UVexplorer automates the detection and mapping of network-connected devices using SNMP and related protocols. Its primary outputs are Layer 2 and Layer 3 topology maps, a device inventory, and configuration backups. It does not include a native CMDB, service dependency modeling, or ITSM workflow management. |
Key Features of UVexplorer
Below are UVexplorer’s primary capabilities, structured by operational impact:
Automated network discovery.
- Discovers devices, interfaces, and connections using multiple discovery methods
- Eliminates manual diagramming and uncovers unknown assets
Automatic Layer 2 and Layer 3 network mapping.
- Generates detailed topology maps down to the port level
- Provides clear visibility into physical and logical connectivity
Scheduled discoveries.
- Runs recurring scans to keep maps and inventory current
- Reduces documentation drift over time
Detailed device inventory.
- Captures serial numbers, IP and MAC addresses, installed software, interfaces, route tables, BIOS data, and more
- Supports documentation and asset validation
Device configuration backup and change tracking.
- Backs up router, switch, and firewall configurations and tracks changes over time
- Enables rollback, comparison, and audit support
Network change notifications.
- Alerts when devices appear, disappear, or topology shifts
- Improves visibility into infrastructure changes
Built-in monitoring.
- Monitors devices and services including Ping, CPU, Disk, and web services
- Provides basic performance and availability tracking
Virtual and wireless visibility.
- Discovers VMware and Hyper-V environments and monitors wireless infrastructure, including rogue access points
- Extends mapping beyond traditional hardware
Export and integration options.
- Exports maps to Visio, PDF, SVG, and Lucidchart; integrates with PRTG, IT Glue, and AssetPanda
- Supports documentation sharing and ecosystem alignment
Compliance-oriented inventory capture.
- Captures detailed device data to assist with PCI, HIPAA, FISMA, and SOX documentation requirements
UVexplorer combines discovery, mapping, monitoring, and configuration tracking into a focused network visibility platform.
Strengths of UVexplorer
Based on verified user reviews on SoftwareAdvice and Capterra, several consistent strengths stand out.
- Automatically generated network maps: Users frequently highlight UVexplorer’s topology mapping as a major advantage. Generating accurate, up-to-date network maps quickly reduces manual documentation effort and makes it easier to troubleshoot connectivity issues or present infrastructure layouts during meetings. (SoftwareAdvice)
- PRTG native integration: Many users value UVexplorer’s tight integration with Paessler PRTG. The native connector expands PRTG’s capabilities by adding detailed network discovery and visual mapping, creating a more complete monitoring and topology experience without requiring complex customization. (SoftwareAdvice)
- User-friendly dashboard: Reviewers often mention the dashboard’s clarity and ease of use. The interface allows IT teams to navigate device inventory, monitoring data, and topology maps without a steep learning curve, reducing onboarding time and operational friction. (Capterra)
- Simple implementation: Several users describe the setup as straightforward. Once configured, UVexplorer is viewed as stable and reliable, with performance that aligns with enterprise expectations for network discovery and monitoring tools. (SoftwareAdvice)
- Documentation and troubleshooting support: IT teams appreciate how quickly they can generate or update network documentation. This becomes particularly useful during audits, infrastructure reviews, or when diagnosing topology-related issues. (Capterra)
Limitations and Constraints
While UVexplorer addresses network-level visibility, infrastructure governance requirements often extend further.
Key considerations drawn from verified user reviews on Capterra:
- The network diagram layout can sometimes appear stretched and may require manual adjustment to improve visual clarity. (Capterra review)
- The self-updating maps and mesh network mapping features may feel complex initially and require additional familiarity to use effectively. (Capterra review)
- The reporting configuration, particularly threshold-based reporting, involves a learning curve and could benefit from a more intuitive setup process. (Capterra review)
In regulated industries, infrastructure visibility requirements often extend beyond connectivity into ownership traceability, lifecycle governance, risk modeling, and audit defensibility.
Network visualization tools solve operational clarity. They do not automatically solve compliance alignment.
Where UVexplorer Fits Best
UVexplorer is best suited for mid-sized IT environments that need fast, accurate network discovery and clear topology mapping without heavy complexity.
It is particularly strong for teams using PRTG, as its integration helps extend monitoring with structured network visibility and device discovery.
Organizations looking for a cost-effective, practical network mapping and asset documentation tool will find strong value here, especially network admins managing Layer 2 or hierarchical environments.
It may require some familiarity for advanced reporting or server-side configuration, but for straightforward discovery, mapping, and device backup, UVexplorer fits operational IT teams well.
Where UVexplorer May Not Be Enough
In enterprise or regulated environments, network visualization alone is rarely the final requirement.
Organizations operating under compliance frameworks such as SOX, HIPAA, ISO 27001, or PCI-DSS often require:
- Audit traceability: documented ownership, lifecycle state, and asset accountability
- Service-level dependency mapping: visibility into how infrastructure supports business services
- Change impact analysis: understanding downstream effects of infrastructure changes
- Risk and compliance workflows: evidence tracking and audit artifact generation
- CMDB alignment: structured asset records tied to service relationships
- Cross-domain discovery: servers, cloud assets, endpoints, SaaS, and applications
For example, if an auditor requests:
- A list of all assets supporting a regulated application
- Patch status across those assets
- Change history affecting them
- Responsible owners and lifecycle classification
UVexplorer and visualization tools can provide device-level visibility, but not structured service-aware governance data.
In such cases, network topology tools must integrate into broader IT asset and configuration management systems to close compliance gaps.
| When Is a Network Topology Tool Not Enough? A network topology tool falls short when organizations require audit traceability, service-level dependency mapping, or change impact analysis tied to business services. Teams operating under SOX, HIPAA, PCI-DSS, or ISO 27001 typically need structured asset ownership records, lifecycle governance, and evidence generation capabilities that go beyond what network visualization platforms provide. |
| Industry Insight: Cloud providers are expanding network visualization into posture management. AWS Shield Network Security Director combines topology discovery with prioritized security findings and remediation guidance. The direction is clear: organizations increasingly expect visualization tools to move beyond diagrams into governance intelligence. |
| Network visibility is the starting point. See how Virima’s Trusted Runtime Truth layer extends it into audit-defensible governance. Explore Trusted Runtime Truth |
UVexplorer vs Other Visualization Tools
Below is a structured comparison of UVexplorer with other commonly evaluated network and infrastructure discovery tools.
UVexplorer vs Virima
Best for: Enterprise environments requiring discovery, CMDB alignment, ITAM integration, and audit-ready visibility.
Strengths:
- Cross-domain discovery across network, servers, endpoints, and cloud, agentless and agent-based, updated through high-frequency discovery cycles rather than collected at a single point in time
- Integrated CMDB with automated population and relationship alignment, not a manually maintained database
- ViVID service mapping and dependency visualization shows how assets connect to business services, so change impact analysis and incident response run on current data, not assumptions
- IT asset management alignment across the hardware and software lifecycle
- Change impact analysis tied to live service dependencies, not just device-level changes
- Structured audit reporting and evidence generation linked to asset ownership, change history, and governance requirements
Watch-outs:
- Broader governance scope than network-only mapping tools
- Implementation planning is required in complex environments
Integration Depth: Native integration across discovery, CMDB, ITSM, and ITAM workflows.
Positioning Difference: UVexplorer visualizes network topology at the device and port level. Virima extends that foundation into ViVID service mapping, CMDB alignment, and structured audit evidence, answering not just what is connected, but what it supports, who owns it, and whether it can be defended in a compliance review.
The difference is a diagram versus a governance record.
| What Does Virima Offer Beyond Network Mapping? Virima extends network-level visibility into cross-domain discovery across servers, cloud, and endpoints, paired with an automatically populated CMDB, ViVID service mapping that ties assets to business services, and structured audit evidence generation. Where UVexplorer answers what is connected at the network layer, Virima answers what it supports, who owns it, and what changes are likely to break it. |
UVexplorer vs Auvik
Best for: Cloud-managed network visibility with built-in monitoring.
Strengths:
- SaaS deployment model
- Automated multi-site discovery
- Integrated monitoring and alerting
- Remote management capabilities
Watch-outs:
- Broader governance scope than network-only mapping tools
- Implementation planning is required in complex environments
Integration Depth: Strong integrations with monitoring platforms and MSP tools; limited native service-level governance capabilities.
Positioning Difference: Auvik emphasizes cloud-managed network monitoring. UVexplorer focuses on on-premises automated mapping without embedded monitoring.
UVexplorer vs SolarWinds Network Topology Mapper (NTM)
Best for: Organizations already invested in the SolarWinds ecosystem.
Strengths:
- SNMP-based discovery
- Automated diagram generation
- Visio export compatibility
Watch-outs:
- Primarily diagram-focused
- Separate from full ITSM capabilities unless integrated
- Limited service-aware dependency modeling
Integration Depth: Strong within the SolarWinds suite; limited standalone CMDB alignment.
Positioning Difference: SolarWinds NTM enhances diagram automation within its ecosystem, whereas UVexplorer positions itself as a focused, standalone discovery tool.
UVexplorer vs Device42
Best for: Organizations requiring discovery plus CMDB functionality.
Strengths:
- Cross-domain discovery covering network, servers, and cloud
- Built-in CMDB
- Application dependency mapping
- Broader asset lifecycle tracking
Watch-outs:
- Broader implementation scope
- More complex configuration
Integration Depth: Strong ITSM and CMDB integrations with service modeling capabilities.
Positioning Difference: Device42 extends discovery into service relationships and lifecycle governance, beyond pure network mapping.
Visualization Tools and Audit Use Cases
Network visualization tools often enter audit conversations as operational accelerators.
They help teams validate asset inventories, surface rogue devices, export diagrams, and demonstrate that configuration changes are tracked. In many audit scenarios, this structural visibility is sufficient for initial validation.
Common audit-relevant applications include:
- Asset audit validation. Confirming that discovered network devices align with official asset registers.
- Rogue device detection. Identifying unauthorized or unmanaged infrastructure that may introduce risk exposure.
- License compliance support. Cross-referencing discovered systems with installed software inventories where integrated.
- Patch evidence collection. Demonstrating patch status and configuration baselines through connected monitoring systems.
- Change documentation. Providing configuration backup history as supporting evidence.
- Audit artifact export. Generating network diagrams and inventory reports for submission.
These use cases address the structural side of audit readiness.
Structural visibility is only the first layer.
How to Choose Between UVexplorer and Alternatives
A common assumption during vendor evaluation is that all network discovery tools deliver comparable outcomes: they find devices, generate diagrams, and keep documentation current. In practice, the gaps are significant. For a broader breakdown of how different network topology mapping tools compare across discovery scope, visualization depth, and governance readiness, see the complete guide to network topology mapping tools before narrowing your shortlist.
Some organizations need their diagrams to stop drifting. Others need infrastructure evidence that stands up in front of auditors and regulators. Those are two different problems.
Solving the first does not automatically solve the second.
1. Start with the Actual Pain
If your situation looks like this:
- Your Visio diagram has not been updated in a year
- Devices appear on the network and no one remembers adding them
- You use PRTG and want better topology context
- Audit prep means exporting screenshots
You do not need a governance overhaul. You need automated discovery and clean topology mapping.
That is where UVexplorer fits best. For a full category comparison, the complete guide to network topology mapping tools covers what to look for before committing.
It discovers devices. It backs up configurations. It keeps documentation current.
For many mid-sized IT environments, that is exactly enough.
Read more: What is network topology mapping? Benefits, methods and types
2. Check the Pressure Level
If your conversations sound more like:
- “Who owns this asset?”
- “What business service does this support?”
- “What changed last quarter?”
- “Can you prove lifecycle classification?”
- “How does this impact regulated applications?”
You are no longer solving a diagram problem. You are solving a governance problem.
Topology tools were designed to answer: What is connected?
Governance platforms are designed to answer: What is connected, who owns it, what it supports, and how it impacts risk? That second question is what ViVID, Virima’s visual dependency mapping engine, is built to answer.
ViVID maps assets in the context of the business services they support, so when something changes or fails, the impact is visible before the incident call, not during it.
| How to Choose Between UVexplorer and Alternatives: Choose UVexplorer when your primary need is automated network topology mapping, particularly for on-premises Layer 2 and Layer 3 environments or PRTG-integrated monitoring. Choose a broader platform such as Virima or Device42 when requirements extend to CMDB alignment, service dependency modeling, IT asset lifecycle management, and audit-defensible governance reporting. |
3. Look at Your Environment Maturity
Be honest here.
If you operate primarily on-premises, with network-heavy infrastructure and compliance handled elsewhere, UVexplorer will likely do the job.
If you operate across on-premises, cloud, and endpoints, under SOX, HIPAA, PCI-DSS, or ISO frameworks, with CMDB and ITSM expectations and service-level impact analysis requirements, you are already beyond pure network mapping.
That is where platforms like Virima become the more defensible choice. Virima extends discovery into CMDB alignment, ViVID service mapping, and audit-ready governance reporting so the same infrastructure data that answers “what is connected?” also answers “who owns it, what does it support, and what is the compliance exposure?” Device42 covers similar ground with a stronger focus on data center and application dependency modeling.
4. Do Not Confuse Visibility with Accountability
A map is visibility.
Ownership, lifecycle, service relationships, and audit traceability: that is accountability.
They overlap. But they are not the same thing.
Choose UVexplorer if you need clarity. Choose broader platforms if you need defensibility.
Side-by-Side Comparison: UVexplorer vs Alternatives
| Evaluation Area | UVexplorer | Virima | Auvik | Device42 |
|---|---|---|---|---|
| Primary Focus | Network discovery & topology mapping | Cross-domain discovery + CMDB + governance | Cloud-managed network monitoring | Discovery + CMDB + dependency modeling |
| Deployment Model | On-premises | On-premises / Hybrid | SaaS | On-premises / Hybrid |
| Discovery Scope | Network devices (L2/L3) | Network, servers, endpoints, cloud, SaaS | Network-centric | Cross-domain (network + compute + cloud) |
| Topology Mapping | Detailed L2/L3 mapping | ViVID service-aware dependency mapping; assets visualized in context of the business services they support | Network visualization | Application & infrastructure dependencies |
| CMDB Capability | No native CMDB | Integrated CMDB | Limited | Native CMDB |
| Service Mapping | Connectivity-focused | Business service alignment | Limited | Yes |
| Change Impact Analysis | Device-level changes | Service-level impact modeling | Limited | Yes |
| Audit Evidence & Traceability | Diagram & inventory export | Structured governance reporting | Limited | Moderate |
| Best For | Mid-sized, network-focused teams | Mid-market to enterprise in regulated industries where discovery, CMDB accuracy, and audit defensibility must work together | MSPs & cloud-managed networks | Enterprises needing discovery + CMDB |
| Complexity Level | Lower | Moderate to High (enterprise feature depth; dedicated implementation support provided) | Moderate | Moderate to High |
When Visibility Is No Longer Enough: Making the Right Call
Most teams do not go shopping for governance. They go shopping for clarity. Outdated diagrams. Unknown devices. Audit pressure. That is usually where it starts.
UVexplorer solves that first layer well. It automates discovery, keeps topology current, and reduces manual documentation work. For many mid-sized, network-focused environments, that is exactly what is needed.
Clarity and accountability are not the same thing.
According to the same benchmark study, 88% of infrastructure professionals are constrained by time and 85% by tool limitations. Generating a map is faster than ever. Proving ownership, lifecycle state, service impact, and compliance alignment is not.
Choose UVexplorer if you need visibility. Look further if you need defensibility.
Visibility is the foundation. Governance determines how far it takes you. For teams that have reached the boundary where visibility is no longer enough and governance defensibility becomes the requirement, Virima’s IT discovery, integrated CMDB, and ViVID service mapping are built for exactly that next layer.
| Ready to move beyond network diagrams into audit-defensible IT governance? Schedule a demo at Virima |
Frequently Asked Questions
What are visualization tools?
Visualization tools are software platforms that convert technical data into visual formats such as maps, diagrams, dashboards, and charts. In IT infrastructure, they help teams see how devices, systems, and services are connected, making it easier to understand network topology, identify issues, and communicate system architecture.
What are the main features of UVexplorer and visualization tools?
UVexplorer and similar visualization tools typically offer automated network discovery, Layer 2 and Layer 3 topology mapping, device inventory tracking, configuration backup, and basic monitoring. Many also support diagram exports and integrations with monitoring platforms such as PRTG to help maintain up-to-date network documentation and improve operational visibility.
Is UVexplorer a good fit for enterprise environments?
UVexplorer works well for mid-sized and network-focused environments that primarily need automated topology mapping and device visibility, particularly teams using PRTG who want structured network discovery alongside monitoring. In regulated enterprises requiring CMDB alignment, service dependency mapping, and audit-ready governance workflows, UVexplorer typically needs to be paired with a broader platform. Virima is designed for that layer, combining cross-domain discovery, integrated CMDB, and ViVID service mapping into a single governance-aligned system.
Does UVexplorer support cloud-native and hybrid environments?
UVexplorer can discover certain virtualized environments and network-connected infrastructure, but its primary strength remains Layer 2 and Layer 3 network visibility. In hybrid or cloud-first environments where assets scale dynamically and services span multiple domains, organizations may require tools that extend discovery beyond network topology into cloud APIs, service relationships, and lifecycle tracking.
Can network visualization tools replace a CMDB?
No. Network visualization tools focus on mapping connectivity and identifying devices. A CMDB, by contrast, maintains structured configuration records, ownership details, lifecycle states, and service relationships. While visualization tools improve operational clarity, they do not replace the governance, audit traceability, and service-aware modeling capabilities of a fully implemented CMDB platform.