Using Data Visualization to Assess the Impact of an Incident

When an IT incident hits, every minute without clarity costs the business. EMA’s ServiceOps 2025 research found that 32% of IT leaders are experiencing longer and more expensive outages, driven specifically by configuration drift and rising change velocity — not by infrastructure failures alone. That distinction matters: the teams recovering fastest are not the ones with the newest hardware. They are the ones who can see the full picture of their environment the moment an alert fires. Data visualization turns raw CMDB and monitoring data into infrastructure maps your team can act on, right now.
| What is data visualization in IT incident management? Data visualization in IT incident management converts raw configuration and monitoring data into live infrastructure maps, letting ITSM teams pinpoint failing components, trace affected connections, and assess blast radius within minutes of an incident occurring. |
The Everyday Reality of IT Incidents
Incidents in your IT environment happen every day. Some affect a single user or a small team. Others shut down an entire business function or cascade across your whole organization. The goal of your incident management processes is to minimize impact and restore normal activity as quickly as possible.
Think of your IT environment as a highway system: an interconnected set of pathways, intersections, and destinations where users travel to reach the tools and data they need. Each request or transaction is a vehicle moving through that network.
When everything runs smoothly, traffic flows and users are productive. When an event disrupts one part of the system, congestion builds and frustration follows. That disruption is your IT incident. What users experience is not a failed server or a misconfigured route. It is the inability to reach their destination, and that blocks real work.
The financial cost of that disruption is not theoretical. ITIC’s 2024 Hourly Cost of Downtime survey found that 97% of large enterprises say a single hour of unplanned downtime costs their organization at least $100,000. For 41% of those same enterprises, the figure rises to between $1 million and $5 million per hour. During peak business periods, an unresolved incident does not just frustrate users. It drains revenue at a rate most organizations cannot sustain for long. That financial exposure is what makes the speed of your initial assessment matter as much as the fix itself.
What Visualization Actually Does During an Incident
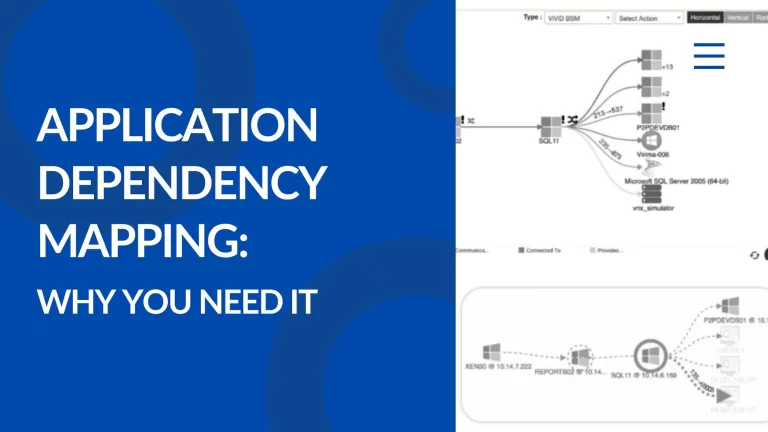
Infrastructure visualization capabilities, like those in Virima’s ViVID™ Service Mapping, turn your Configuration Management Database (CMDB) and monitoring data into easy-to-read infrastructure maps. When an incident triggers, your staff can see three things simultaneously:
- Where the failing component sits in the broader IT ecosystem
- Which other assets, services, and users depend on it
- What alternate resources could absorb traffic or redirect affected users
That contextual view directly reduces the human error that compounds incidents. Uptime Institute’s 2025 Annual Outage Analysis found that nearly 40% of organizations suffered a major outage caused by human error over the past three years, and that 85% of those incidents trace back to staff failing to follow procedures or to flaws in the procedures themselves. Visualization reduces that failure mode by making dependency context visible at the precise moment a team member needs to act, rather than asking them to reconstruct it from memory under pressure.
| How do service dependency maps reduce mean time to resolution? Service dependency maps built from live CMDB data let incident managers trace the full blast radius of a failure, identify which business services are affected, and reroute users to available resources, cutting mean time to resolution without requiring manual investigation. |
From CMDB Data to Actionable Infrastructure Maps
Visualization only works if the underlying data is authoritative. The Uptime Institute 2025 report found that IT and networking issues rose to 23% of all impactful outages in 2024, attributing the increase specifically to change management complexity and misconfigurations. That is the category of incident a current, discovery-sourced CMDB directly addresses. Virima’s IT discovery populates your CMDB with configuration items sourced from multi-protocol agent and agentless scans across on-premises, cloud, and hybrid environments. Every attribute carries a source record and conflict resolution trail, so your infrastructure maps reflect what is actually running, not what someone last documented six months ago.
When an event triggers an incident, staff members can open an infrastructure map and see the component under stress alongside all of its upstream and downstream connections. This contextual view enables the team to determine the location of the problem, identify who and what is affected, and assess the appropriate course of action without running separate queries or cross-referencing multiple systems. For more on the service management capabilities that support this workflow, see Virima IT Service Management features.
In some incidents, this view reveals alternate resources your team can use immediately. Redirecting affected users to a secondary server or failover path mitigates business impact while the primary issue is still being resolved. That is the operational difference between seeing the problem and understanding the problem.
| Why does CMDB accuracy matter during an active incident? When CMDB records are populated by live discovery rather than manual entry, visualization maps show accurate dependency paths. Teams can reroute users to alternate resources mid-incident rather than waiting for full resolution, which reduces user impact during active outages. |
The Business Cost of Operating Without Visualization
Without visualization, your ITSM staff face the equivalent of driving through a city with no navigation app after a major road closure. They rely on experience, tribal knowledge, and guesswork to determine which resources connect users to their destinations and how extensive the disruption actually is.
The cost of that guesswork is measurable. For top verticals such as banking, healthcare, and retail, the ITIC 2024 survey found average hourly outage costs exceed $5 million. EMA’s ServiceOps 2025 research also found that configuration drift is one of the primary drivers behind those rising costs: incidents rooted in undocumented changes or stale dependency records take longer to diagnose because responders cannot trust the baseline they are working from. Every minute spent reconstructing what should already be visible in a CMDB is a minute added to your MTTR and subtracted from the business.
Virima’s IT Operations Management (ITOM) capabilities streamline incident response, change management, and problem management with contextualized visibility across the IT environment. Combined with IT Asset Management (ITAM) data, teams gain a complete picture of hardware and software dependencies, license status, and end-of-life exposure, all factors that influence both the cause and the resolution path for many incidents.
| What is the cost of manual incident investigation without visualization? ITSM teams operating without infrastructure visualization rely on manual investigation during incidents, which extends mean time to resolution, increases the chance of misdiagnosis, and reduces stakeholder confidence. Live dependency maps eliminate the guesswork that makes outages last longer than they need to. |
How to Apply Data Visualization at Each Stage of Incident Response
Effective incident response follows a structured sequence, and the role of data-driven context at each phase is growing. PagerDuty’s 2025 State of Digital Operations report, which surveyed more than 1,100 operations leaders globally, found that 88% view agentic AI as either core or peripheral to the future of IT operations, and 53% of CIOs and CTOs specifically call it core. That shift depends entirely on having accurate, live infrastructure context as the foundation. Visualization is what makes that context available at each stage of response.
Detection and Initial Assessment
At the moment an alert fires, your team needs to know whether the incident is isolated or systemic. An infrastructure map from ViVID™ Service Mapping surfaces the affected component and its dependency graph simultaneously, so the initial assessment is based on topology rather than assumption.
Impact Scoping
Once the failing component is identified, the map reveals every downstream dependency. This scoping step determines which business services are at risk, which users are affected, and whether any critical processes face disruption. Incident priority and resource allocation decisions flow directly from this view.
Mitigation and Rerouting
Where alternate resources exist, visualization makes rerouting options visible. Your team can direct users to available infrastructure while the primary issue is addressed, reducing business impact without waiting for full restoration.
Root Cause and Post-Incident Review
After resolution, the same dependency maps inform root cause analysis and future prevention planning. Virima’s CMDB retains configuration history and CI relationship records, giving post-incident reviews an accurate baseline for identifying what changed before the failure occurred.
Virima’s Trusted Runtime Truth gives IT teams the live, explainable context they need to resolve incidents with authority. See how Trusted Runtime Truth powers faster incident resolution.
Move Faster. Act with Confidence.
IT incidents are unavoidable. The difference between a five-minute disruption and a five-hour outage often comes down to how quickly your team can see and understand what is happening across the environment.
Data visualization, backed by live, discovery-sourced CMDB data, gives your ITSM staff the context they need to move from alert to action in minutes. Virima connects IT discovery, CMDB, ViVID™ Service Mapping, ITAM, and ITOM into a single platform built for the demands of modern IT operations.
Schedule a demo at virima.com to see Virima’s visualization capabilities in action.
Frequently Asked Questions
What is data visualization in IT incident management?
Data visualization in IT incident management means converting raw CMDB records, configuration data, and monitoring alerts into interactive infrastructure maps. These maps show which components are affected, how they connect to other services, and which users and business functions face disruption, so teams can respond with context rather than guesswork.
How does a CMDB support faster incident resolution?
A CMDB maps the relationships between configuration items, services, and business functions. When an incident occurs, that relationship data drives impact scoping, so your team knows immediately which users are affected and which alternate resources are available. Virima populates CMDB records from live discovery rather than manual entry, which keeps the maps accurate and actionable. Learn more about Virima’s Automated CMDB at virima.com/features/cmdb.
Why do IT teams miss incidents without visualization tools?
Without visual dependency maps, ITSM staff must trace connections manually using spreadsheets, institutional knowledge, and separate monitoring consoles. That process is slow, inconsistent, and prone to missed relationships. The scale of this problem is reflected in ITIC’s 2024 research, which found that only 22% of organizations can accurately estimate their full hourly cost of downtime. If most teams cannot quantify what an outage costs, they are almost certainly also underestimating the effort required to diagnose one. Visualization tools surface the full blast radius of an incident in seconds, reducing the time between detection and informed action.
Can Virima help identify alternate resources during an active incident?
Yes. When Virima’s infrastructure maps show an affected component and its dependency graph, they also reveal which adjacent resources are available and capable of absorbing traffic or serving affected users. That visibility enables incident managers to implement mitigation steps while the primary fix is still in progress.
How does Virima’s service mapping connect to incident management workflows?
Virima’s ViVID™ Service Mapping builds dependency maps from live discovery data and connects them to your ITSM workflows via integrations with ServiceNow, Jira Service Management, Ivanti, HaloITSM, Hornbill, and Xurrent. When an incident ticket is created, the associated service map gives your team immediate visual context on affected CIs, ownership, and blast radius. See the full Virima IT Service Management features at virima.com/features/itsm for integration details.