How Does IT Visibility Improve IT Operational Efficiency in a Business?
Your IT environment is growing faster than you can track. New servers spin up, and cloud systems keep increasing. Also, shadow IT slowly creeps in. So, without a clear view, you end up guessing your decisions.
However, IT visibility helps you close this gap. It shows you what you have and how everything connects. As a result, you can use resources better and reduce downtime. You can also fix issues before they grow bigger.
In addition, IT visibility helps you measure operational efficiency and stay aligned with your business goals. This way, you make smarter decisions with real data. Over time, you build operational excellence through simple process improvements.
This page covers what IT visibility means in practice, how it drives IT operational efficiency across monitoring, compliance, resource planning, and incident response, and where tools like Virima fit in.
What is IT visibility?
IT visibility means you can see what is happening in your IT systems in near real time. It helps you measure operational efficiency and track operational cost. Also, it supports a culture of continuous improvement. So, you can better understand your production processes and system performance.
It covers how your IT assets perform, stay secure, and remain available. These assets include network devices, servers, applications, databases, and cloud systems. You collect this data continuously and connect it in one place. As a result, you get a clear and complete view.
In simple terms, IT visibility answers three key questions for you. What do you have? What state is it in? What depends on what?
When you have clear answers, you can handle tasks faster. You also reduce surprises in incident response, change management, capacity planning, and compliance. In fact, high-performing teams hit an 88% average SLA compliance rate when they improve visibility and service tracking.
How does IT visibility differ from IT monitoring?
IT monitoring tracks specific metrics like CPU utilization, memory, uptime, and response times. It also sends alerts when limits are crossed. So, you quickly know when something goes wrong. However, it only shows part of the full picture.
In contrast, IT visibility gives you a wider and clearer view. It combines monitoring data with asset inventory, dependency maps, configuration records, and ITSM data. As a result, you can optimize resources and reduce operational expenses. You can also support process improvements while reducing costs and improving customer satisfaction.
For example, monitoring tells you a server is down. However, visibility shows you which services the server supports. It also tells you who owns it and what changed last. Because of this, you understand issues faster and take better action.
How IT visibility drives IT operational efficiency
IT visibility feeds directly into the operational metrics that matter: MTTR, change success rate, SLA compliance, and resource utilization. Here is how it works across key areas.
Proactive monitoring and issue detection
Visibility lets your team spot bottlenecks and degradation before they turn into outages. Instead of reacting to tickets, ops teams can monitor infrastructure health, identify patterns in network performance or application behavior, and step in early. Fewer P1 incidents, shorter resolution times, and less firefighting, all of which contribute to operational excellence, help minimize costs and strengthen a culture of continuous improvement while aligning IT performance with broader business goals.
When paired with dependency mapping, proactive monitoring also reveals blast radius—which services and users take the hit if a specific asset fails. That context changes how you prioritize response.
Incident response and root cause analysis
When an incident happens, you first ask, “What changed?”
Today, 51% of teams use AI agents in incident management to help answer that question faster. IT visibility tools that connect with your ITSM platform show open incidents and recent changes in one place. So, you don’t have to guess anymore. As a result, you can do root cause analysis faster and identify areas for improvement. You can also reduce operational costs and use artificial intelligence to support better process improvements and decisions.
For example, a database node may stop working during a change window. However, a dependency map shows which application services depend on it. It also shows recent changes on the same screen. Because of this, you know exactly where to look. So, you avoid confusion and save time.
Resource allocation and capacity planning
IT visibility gives you data on actual usage patterns—which servers are overprovisioned, which are nearing capacity, and where bandwidth is getting consumed. This replaces gut-feel decisions with evidence-based allocation, helping organizations optimize resources, control operational expenses, and minimize costs while improving production processes and supporting long-term operational excellence.
For IT asset management teams overseeing budgets, this is the difference between buying hardware you don’t need and right-sizing infrastructure based on real demand. When visibility extends to cloud environments, it also prevents runaway spend from forgotten or orphaned instances.
Compliance and security
Compliance frameworks like GDPR, PCI DSS, HIPAA, and SOX all require organizations to demonstrate control over their IT assets. IT visibility provides the audit trail—documented asset inventories, configuration histories, and change records that auditors ask for.
On the security side, visibility surfaces unauthorized assets, configuration drift, and unpatched systems. You can’t secure what you don’t know exists. A complete, continuously updated asset inventory is the foundation that vulnerability management, access control, and incident response all build on.
Predictive analytics and forecasting
Visibility data—performance trends, usage patterns, and alert frequency—feeds predictive models powered by artificial intelligence, helping teams identify areas for improvement, enhance process improvements, and reduce operational cost while improving customer satisfaction and flagging potential outages before they happen. Early warning signs like rising error rates, increasing latency, or capacity thresholds approaching limits give your team time to act rather than react.
This matters most for capacity planning. Historical usage data combined with growth projections helps you forecast when infrastructure investments are needed and justify them with hard numbers instead of estimates.
Automation of routine tasks
IT visibility enables automation for routine operational tasks: scheduled backups, patch deployments, software updates, and configuration compliance checks. When your visibility layer knows what assets exist, what state they are in, and what policies apply, automation tools can act on that data with confidence.
This frees your team for higher-value work, supports a culture of continuous improvement, and drives operational excellence by automating repetitive tasks, reducing costs, and improving overall operational efficiency.
What role does a CMDB play in IT visibility?
A CMDB (Configuration Management Database) acts as your single source of truth for IT visibility. It stores every configuration item (CI), such as servers, applications, network devices, and cloud instances. It also shows how these items connect to each other. So, you get a clear and complete view of your IT setup.
However, without an accurate CMDB, your visibility becomes fragmented. Your monitoring tools may show that a server is down, but not the business service it supports. Also, your ticketing system may show the incident, but not the full dependency context. Because of this, you miss important details. The CMDB connects all this information in one place.
The main challenge is keeping the CMDB accurate. Manual updates become outdated very quickly. So, you need automated IT discovery. This scans your systems regularly and updates CI data in the CMDB without manual effort.
Scan-based discovery works well for hardware, software, and configuration data. However, it cannot capture details like asset ownership, lifecycle status, business criticality, or SLA assignments. That is where Virima’s Autonomic Social Discovery (ASD) helps. It collects knowledge from people and adds it to the CMDB. As a result, you get both system data and human insights in one place.
What is the ROI of IT visibility?
The ROI of IT visibility shows up in three operational areas: reduced downtime, faster incident resolution, and smarter resource allocation. When ops teams have accurate infrastructure data, they spend less time diagnosing issues and more time preventing them.
Quantifying it depends on your environment, but the math typically centers on MTTR reduction (fewer hours per incident multiplied by cost per hour of downtime), avoided overspend on unused resources, and audit preparation time saved. Organizations with mature visibility practices also report fewer failed changes and fewer compliance surprises—both of which carry real cost when they go wrong.
Using data analytics to improve IT operational efficiency
IT visibility generates a large volume of operational data. The value comes from turning that data into insights your team can act on to measure operational efficiency, identify areas for improvement, and align IT initiatives with strategic business goals while controlling operational expenses.
Data collection and integration
Effective analytics starts with consolidating data from across your infrastructure—network devices, servers, applications, cloud platforms, and databases—into a centralized repository. This gives your analytics tools a complete dataset instead of isolated silos.
Visualization and reporting
Dashboards and reports translate raw data into patterns your team can act on. The best visibility platforms offer filterable, role-specific views: an ops manager sees SLA compliance trends, while an infrastructure engineer sees capacity utilization by subnet.
Root cause analysis at scale
When you have historical visibility data, root cause analysis goes beyond individual incidents. You can spot recurring patterns—the same CI involved in multiple incidents, configuration drift that correlates with outages, and change windows that consistently produce failures. Those patterns are where IT operational efficiency improvements actually come from.
Business process optimization
Visibility data reveals where IT bottlenecks constrain business operations. Slow provisioning, manual asset tracking, and reactive incident response — they all show up in the data. Analytics helps you quantify the impact and prioritize the fixes that deliver the most operational improvement.
Achieve IT operational efficiency with Virima
Virima brings IT visibility, asset management, service mapping, and IT operations management (ITOM) into one platform. It also connects easily with the ITSM tools you already use. So, you don’t need to switch between multiple systems. As a result, you can manage your IT environment more smoothly.
IT Discovery:
Virima’s discovery engine uses many probes across agentless and agent-based methods. It helps you detect thousands of physical and virtual assets on a regular schedule. It supports Windows, Linux, Unix, and Mac systems. It also connects with cloud platforms like AWS and Azure. So, you can track hardware, software, and configuration changes easily. All this data goes directly into the Virima CMDB.
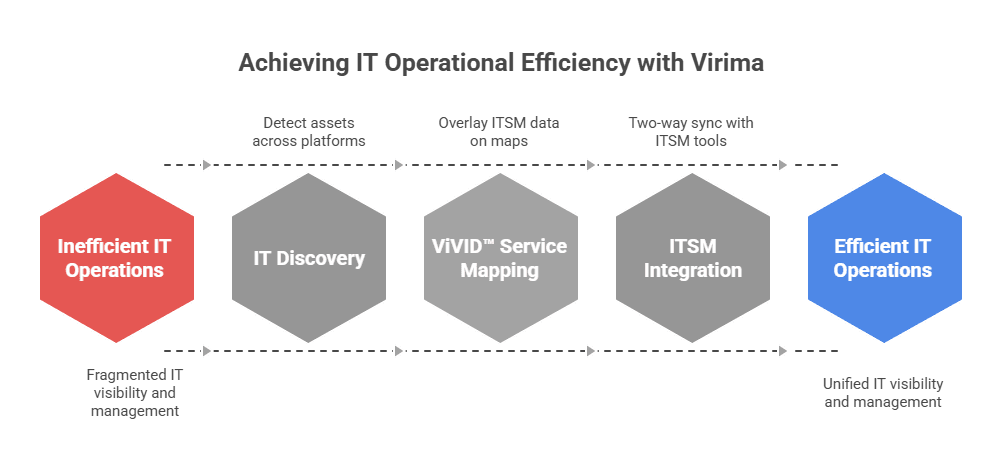
ViVID™ Service Mapping:
Every ViVID map combines ITSM incident and change records with NIST NVD vulnerability data. It places this data on top of dependency maps built by Discovery and Service Mapping. So, you can clearly see what is affected, what changed, and what is at risk. Because of this, you make faster and better decisions.
ITSM Integration:
Virima supports two-way sync with ServiceNow, Jira Service Management, Ivanti, HaloITSM, and Cherwell. It also integrates with Xurrent and Hornbill. So, you can see open incidents and recent changes directly on ViVID maps. As a result, you can perform root cause analysis quickly without switching tools.
Operational highlights:
Discovery stores and processes asset, configuration, and relationship data. It keeps a complete and updated inventory of your IT assets. You can also track CI changes over time. So, you always have accurate and reliable information.
Change management integration identifies risk, measures impact, and pinpoints stakeholders for every change request.
Incident management via ViVID shows the root cause and full blast radius of service disruptions. Vulnerability prioritization based on asset criticality, powered by NIST NVD data at no extra cost. Virima holds PinkVERIFY™ ITIL certification across six processes: SACM, change, incident, problem, request, and knowledge management.
Virima also connects with system monitoring and event tools like SolarWinds, Nagios, and LogicMonitor. So, you can see alerts about possible service issues before they affect users. This helps you act early instead of reacting later.
As a result, you can manage complex IT environments with more confidence. You get a clear view through discovery, mapping, ITSM integration, and security insights. Because of this, you can improve IT operational efficiency in a practical way.
You can also optimize resources and minimize costs without guessing. At the same time, you improve customer satisfaction by reducing service disruptions. In addition, you build operational excellence through steady process improvements and better production processes.
Finally, you improve change success rates and stay ready for compliance audits. This means fewer surprises and smoother operations every day. Schedule a demo to see how Virima fits your operational environment.