Enhancing Service Uptime: The Power of Virima Service Mapping and ViVID™ with Jira Service Management Automation
Jira Service Management automation is the process of using rule-based workflows within JSM to trigger IT actions automatically, including incident creation, ticket routing, escalation, and change request generation. These capabilities accelerate ITSM processes, but stop short of the infrastructure dependency context required for root cause analysis and change impact assessment. Virima’s ViVID™ service mapping fills that gap, giving IT teams the discovery-driven visibility that turns fast workflows into accurate ones.
| What is Jira Service Management automation? Jira Service Management automation uses rule-based workflows to trigger IT actions automatically, covering incident creation, ticket routing, alert escalation, and change request generation. It accelerates process execution but does not provide infrastructure dependency context. Teams that add discovery-sourced service mapping alongside JSM automation close this gap and reduce mean time to repair (MTTR) for complex incidents. |
What Are Service Uptime and SLAs?
Service uptime measures how long a service or application runs without interruptions. It is expressed as a percentage of total available time and directly reflects service availability to your users.
Service Level Agreements (SLAs) define the minimum uptime your team commits to. When you miss SLA targets, you face consequences ranging from financial penalties to damaged customer trust.
Improving SLAs means reducing the frequency and duration of outages. In practice, that requires four things:
- Reducing mean time between failures (MTBF) with preventive action
- Cutting the mean time to repair (MTTR) when incidents occur
- Reducing disruptions caused by changes to your environment
- Staying ahead of recurring problems before they become incidents
The Virima and Jira Service Management integration improves all four metrics: it reduces MTTR by providing visual root cause context at incident time; it reduces MTBF by surfacing recurring CI-level patterns during problem management; it lowers change failure rates through pre-approval dependency and impact analysis; and it improves SLA compliance by shortening both investigation and resolution cycles.
This is where Jira Service Management automation, combined with Virima’s service mapping and ViVID™ capabilities, gives your team the edge.
4 Ways Virima Maximizes Service Uptime by Enhancing Jira Service Management Automation
1. Take Monitoring Through JSM to a New Level
What if your monitoring alerts showed not just what failed, but everything connected to it? What if you could see the affected component on a live dependency map the moment an alert fires?
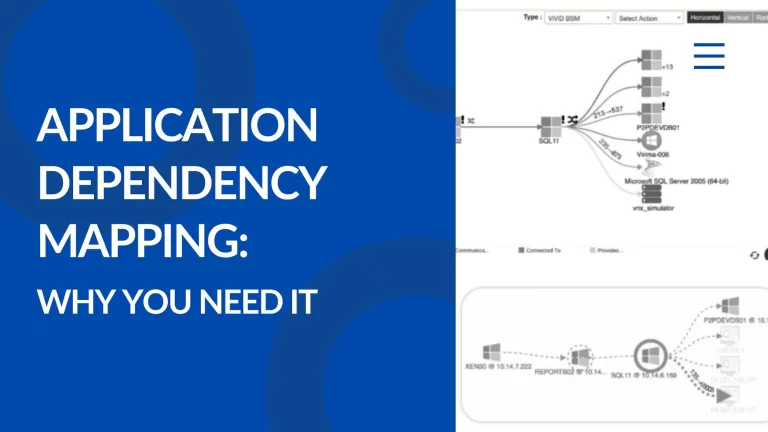
That is what you get when you overlay JSM monitoring data on Virima’s ViVID™ service maps. Instead of raw alert noise, your team sees topology context, including which services depend on the failing component, who owns it, and what changed recently.
Quick Response to Alerts
A monitoring tool surfaces data on network components such as routers, switches, and firewalls. Virima’s ViVID™ feature overlays this data on your service map so the affected component is immediately visible.
If network latency spikes or packet loss occurs, the service map highlights the specific device causing the problem. Your team skips the manual correlation step and goes straight to resolution.
Proactive Response to Alerts
Alert thresholds detect potential issues before they become outages. But raw alerts lack context. When ViVID™ displays the configuration item (CI) triggering the alert alongside the services depending on it, your team can judge severity and act before the alert escalates into a disruption.
| How does ViVID™ improve incident resolution in Jira Service Management? ViVID™ overlays Jira ITSM data, including open incidents, recent changes, alerts, and vulnerability data, onto Virima’s discovery-driven service maps. Incident teams get immediate visibility into the affected CI, its dependencies, recent change history, and ownership. Teams identify root causes faster because the context is visual and current, not buried in ticket queues or static CMDB records. |
2. Add Velocity to Jira Service Management Automation in Incident Resolution
JSM centralizes alerts, prioritizes issues, and routes tickets efficiently. Jira Service Management automation handles a large share of the legwork. But when it comes to finding the root cause, the platform alone cannot tell you which infrastructure component failed, what changed, or who owns the affected service.
That gap is where Virima’s ViVID™ and service mapping integration for JSM make the difference. Service mapping in JSM provides a live visual topology of the infrastructure components behind each service. When an incident fires, teams can immediately see the affected configuration item, its upstream and downstream dependencies, recent changes, and ownership details. This dependency context replaces manual environment reconstruction, reducing mean time to repair and preventing repeat incidents caused by incomplete diagnosis. For more on this approach, the incident management and service mapping guide covers it in depth.
| How does Virima reduce MTTR in JSM incidents? Virima ViVID™ reduces MTTR by surfacing the affected configuration item, its upstream and downstream dependencies, recent change history, and ownership data in a visual map alongside each JSM incident ticket. This eliminates the manual environment reconstruction that typically extends incident investigations from hours to minutes. |
Handling Change-Born Incidents
Changes in your IT environment cause a large share of incidents. ViVID™ overlays JSM change data on your service and application dependency maps. Incident teams can see the change status of infrastructure components related to the disruption right away. That context tells teams what changed, when, and which change is likely responsible, cutting hours from the investigation.
More Effective Stakeholder Collaboration
Incidents involve multiple teams. When you integrate Jira Service Management with Virima, ViVID™ surfaces ownership details and dependency relationships in a shared visual map. Everyone on the call sees the same picture. That shared view reduces duplicated effort and speeds up resolution.
Root Cause Identification
ViVID™ transforms CMDB data into a visual dependency map. Incident responders can see recent incidents on dependent CIs that may be connected to the current outage. Instead of chasing logs and guessing, your team traces the chain of impact back to its source.
ViVID™ presents a live visual dependency map alongside each JSM incident ticket. Responders immediately see which configuration items are affected, what changed recently, and which teams own each component. This visual context eliminates the manual environment reconstruction that typically extends incident investigations, directly reducing mean time to repair.
3. Speed Up the Change Management Timeline Through Jira Service Management
Inefficient changes cause disruptions. Disruptions hurt service uptime. A stronger change management process directly improves your SLA performance.
JSM provides pre-defined workflows for normal changes and accelerated approvals. Its built-in change risk scoring and change management tracking help teams move faster. But the system still needs infrastructure context to make those assessments meaningful.
Enhancement by Virima
Virima’s ViVID™ and service mapping integration provides that context. Your team gets a complete picture of dependencies, relationships, and potential impact before any change goes through.
Virima ViVID™ overlays service dependency maps directly alongside JSM change requests. Before a change is approved, teams see every downstream service that depends on the target CI, historical incidents on related components, and the owners of each affected area. This pre-change visibility reduces unplanned outages caused by changes and shortens the approval cycle by giving reviewers the evidence they need to act quickly.
| How does Virima service mapping reduce change-led disruptions in JSM?Virima ViVID™ overlays incident history, vulnerability data, and dependency context on service maps viewed alongside JSM change requests. Before a change is approved, teams see which services depend on the component being changed, what incidents have occurred on related CIs, and who owns each affected piece of infrastructure. This context makes change impact assessment faster and more accurate. |
Speeding Up the Normal Change Timeline
Two things determine how fast a normal change can move. First, your team needs a complete understanding of dependencies, relationships, and potential impact. Second, they need to identify the right stakeholders quickly and get everyone aligned.
ViVID™ handles both. Take a network change as an example. ViVID™ surfaces the teams responsible for administration, security, and application support. Combined with the change calendar in JSM, that context drives faster collaboration and cuts unnecessary waiting.
Reducing Change-Led Disruptions with Better Impact Assessment
The same service mapping insights that help with root cause analysis also support change impact assessment. When the incident history for a server hosting critical applications is visible on the service map, your team can assess the real risk of a planned change on that server before committing.
Combined with JSM’s built-in change risk scoring, ViVID™ helps your team plan contingencies and reduce the chance that a change turns into an outage. To understand the full value of Virima and Jira working together, the integration walkthrough covers the technical details.
4. Strengthen Problem Management Through Jira Service Management
Effective problem management reduces repeat incidents and protects service uptime over time. JSM provides a default problem management workflow following ITIL guidance: problem investigation, workaround identification, and known error recording.
Virima adds the infrastructure visibility that makes each of those steps faster.
Problem Investigations with ViVID™ and Service Mapping
ViVID™ maps the relationships between applications, servers, databases, and network devices in a visual format. When investigating a problem, your team can see the full scope of affected areas, associated alerts, incident history, and component dependencies.
That visibility shortens investigation time. Instead of reconstructing the environment from memory or outdated documentation, your team works from a discovery-driven map that reflects what your infrastructure actually looks like. The business service mapping guide explains the full picture.
Identifying Workarounds
Virima’s ViVID™ service maps help your team find alternative paths or systems to use as temporary workarounds until a permanent fix is in place. By visualizing the impact of potential workarounds and identifying usable alternative resources, your team can keep services available while the root cause is addressed.
| What is the difference between Jira Service Management automation and Virima ViVID™? Jira Service Management automation handles workflow triggers, ticket routing, escalations, and change request creation based on rules. Virima ViVID™ provides the infrastructure dependency context that makes those workflows more effective. JSM manages the process; Virima maps the environment. Together, they give IT teams both the speed of automation and the accuracy of discovery-driven visibility. |
JSM Automation vs. Virima ViVID™: At a Glance
The two capabilities are complementary. The table below shows how each addresses a different layer of IT operations.
| Capability | JSM Automation | Virima ViVID |
| Primary function | Workflow triggers and ticket routing | Infrastructure dependency mapping |
| Root cause context | Not provided | Visual CI relationship map |
| Change impact view | Risk score only | Live dependency map + incident history |
| Stakeholder identification | Manual lookup | Surfaced automatically from CMDB |
| Data source | Ticket and rule history | High-frequency agentless discovery |
| MTTR impact | Speeds routing | Reduces investigation time |
| JSM automation vs. Virima ViVID™ JSM automation rules control process execution: routing alerts, escalating tickets, and closing requests based on defined criteria. Virima ViVID™ provides the infrastructure knowledge layer that tells teams what failed, what depends on it, and what changed. The two capabilities are complementary. JSM drives process speed; Virima delivers dependency accuracy. |
When Service Uptime Is Non-Negotiable, You Need More Than Automation
Jira Service Management automation is a strong foundation. It speeds up workflows, routes work to the right teams, and reduces manual effort. But when an incident hits or a change carries unknown risk, your team still needs to know what your infrastructure looks like, what it depends on, and what it has done recently.
Virima’s ViVID™ service maps and high-frequency discovery cycles give JSM that grounding. Your teams get the dependency context that turns fast workflows into correct ones. For a true CMDB built for Jira Service Management, see how Virima delivers discovery-sourced accuracy to your JSM environment.
Give your IT teams the tools to protect service uptime and exceed your SLAs. Schedule a demo and see how Virima ViVID™ and service mapping enhance your Jira Service Management automation environment.
| What metrics does the Virima and JSM integration improve? The Virima and Jira Service Management integration improves four key metrics: MTTR (mean time to repair) by providing visual root cause context at incident time; MTBF (mean time between failures) by surfacing CI-level patterns during problem management; change failure rate through pre-approval dependency analysis; and SLA compliance by shortening investigation and resolution cycles. |
Frequently Asked Questions
Does Virima replace Jira Service Management?
Virima integrates with JSM to extend its capabilities. JSM manages incidents, changes, and problems through structured workflows. Virima provides the discovery-driven infrastructure context and ViVID™ service maps that give JSM data greater depth and accuracy. The two tools work together.
How does ViVID™ help with SLA compliance?
ViVID™ reduces the time your team spends finding root causes, assessing change impact, and identifying stakeholders. Faster resolution and fewer change-led disruptions directly improve MTTR and MTBF metrics, which drive SLA performance.
What types of infrastructure does Virima discover?
Virima uses high-frequency, agentless discovery to map assets across on-premises, cloud (AWS and Azure), and hybrid environments. Discovery results feed a continuously updated CMDB, which powers ViVID™ service maps. JSM teams are always working from current infrastructure data rather than manually maintained or stale records.
Is the Virima and JSM integration difficult to set up?
Virima offers a deep out-of-the-box integration with Jira Service Management. Most teams complete initial configuration and see their first dependency map within 60 minutes of enabling the integration, without custom development work.
Do other ITSM platforms get the same ViVID™ capabilities?
Yes. The same ViVID™ service mapping capabilities are available for teams on other platforms. For example, the Virima Xurrent integration delivers CMDB data and dependency context into Xurrent with the same advantages for incident response and change management.
What is the difference between JSM automation rules and Virima service maps?
JSM automation rules control process execution: when an alert fires, route it, escalate it, or close it based on defined criteria. Virima service maps provide the infrastructure knowledge layer that tells teams what failed, what depends on it, and what changed. The two capabilities are complementary, not redundant.
Schedule a demo and see how Virima ViVID™ and service mapping enhance your Jira Service Management automation environment
PAA and AI Query Coverage Map
| Question / Query | Covered in This Post | Recommended Action |
| What is Jira Service Management automation? | Yes | Citable definition in opening paragraph |
| How does service mapping improve JSM incident response? | Yes | Integrated into Section 2 body text |
| What is the difference between JSM automation and Virima ViVID? | Yes | FAQ and standalone answer block in Section 4 |
| How does Virima reduce MTTR? | Yes | Integrated into Section 2 root cause subsection |
| What metrics does the Virima and JSM integration improve? | Yes | Integrated into SLA section |
| How does ViVID support change management in JSM? | Yes | Integrated into Section 3 Enhancement subsection |
| What infrastructure does Virima discover? | Yes | FAQ answer updated with citable language |
| How do I set up Virima with JSM? | Partial | Expand with step-level guidance in a future section |
| JSM automation vs ServiceNow automation | No | Add comparison table in future update |
| How does ViVID support change advisory board reviews? | No | Add dedicated subsection under change management |